

Abstract
Plant phenology is an important indicator of ecosystem dynamics and services. However, little is understood of its responses to climate change, particularly in ecologically sensitive regions such as arid and semi-arid grasslands. In this study, we analyzed a long-term climate and plant phenology dataset of thirteen grassland species in the Inner Mongolia of China, collected during 1981–2011 time period, to understand temporal patterns of plant phenology and then developed a simple chilling-adjusted physiological model to simulate phenological responses of each plant species to climate change. The results of regional climate analysis suggested that the minimum temperature was increasing at a greater rate than mean and maximum temperatures in the region and the climate variability had significant impacts on vegetation phenology. Chilling from an early stage in spring in general slowed down the phenological development in most plant species, although there were some inconsistencies among sites and years. Specifically, we found lower precipitation during green-up resulted in delayed flowering, which may attribute to plant self-adjustment strategy to respond changes in climate. These climate dependent phenologies were characterized by a simple physiological model. Scenario analysis suggested that by 2071–2100 significant shifts in plant phenology are expected in Inner Mongolia, including as much as 6–11 days earlier in green-up time and 8–11 days shorter in growing season due to earlier senescence.
Export citation and abstract BibTeX RIS

Content from this work may be used under the terms of the Creative Commons Attribution 3.0 licence. Any further distribution of this work must maintain attribution to the author(s) and the title of the work, journal citation and DOI.
1. Introduction
Plant phenology, the timing of recurrent biological events of plants, is determined by biotic and abiotic factors, and by the interrelation among phases of the same or different species (Lieth 1974). The timing of phenological events is a major determinant of plant productivity and species distribution (Vitasse et al 2011). It is related to seasonal and inter-annual dynamics of vegetation and is highly sensitive to climate variability (Fu et al 2014, Han et al 2015, Keenan and Richardson 2015). Therefore, phenological characteristics can be used as an integrated indicator of climate change.
Changes in phenological phases can potentially impact terrestrial ecosystem functions and services such as carbon, water and nutrient cycles, and productivities (Schwartz 1998, White et al 1999, Menzel 2000, Piao et al 2007). Changes in these critical ecosystem services can have significant implications to the livelihoods of human society, particularly rural families such as ranchers and farmers as their lives rely on these services for sustainable development.
Plant phenology of grasslands is also a major factor affecting plant function such as light and water use efficiency, seed production, and the total biomass production (Vitasse et al 2011). Climate change can lead to a failure in flowering or fruiting (Wang et al 2015) and result in a low seed production and even a change in the structure of plant communities (Lesica and Kittelson 2010). However, knowledge on how climate change affects phenology of different grassland species is very limited.
In addition to physiology, plant phenology is also dependent on the external environmental temperature (Thompson and Clark 2006). The timing of a given phenological stage is often determined by a threshold of accumulated temperature, which is usually measured by growing degree-days or GDD (McMaster and Wilhelm 1997, Bonhomme 2000, Cook et al 2010, Fu et al 2014). Plant development can be characterized either by a linear function of temperature when the temperature is above a baseline value or by a nonlinear function when it is below the baseline to account for the base, optimal and maximum temperatures for growth. There is also a negative impact term accounting for extreme high temperature (i.e. supra-optimal temperature) that may progressively deactivate certain plant enzymes, and consequently slow down growth (Atkinson and Porter 1996, Bonhomme 2000).
Previous studies revealed that a period of low temperature (chilling effect) during an early development stage could hasten flowering of some herbaceous (e.g., Cook et al 2012, Fu et al 2014) and some woody species (e.g., Luedeling et al 2009, Richardson et al 2013, Clark et al 2014). Sometimes it can also promote flowering of some perennial grasses in temperate and cold environments (Heide 1994, Atkinson and Porter 1996, Shirazi 2003). As global warming trend continues, especially in winter times, the chilling period may be shortened or even disappear in some geographic regions to affect early vegetation growth (Cook et al 2012, Hart et al 2014, Vitasse et al 2011, Guo et al 2015). Shortening or disappearance of chilling period, due to climate warming, has significant implications for grassland species that require chilling effect to trigger growth (Donald 1984), such as Kobresia pygmaea as shown in a warming trend experiment by Dorji et al (2013). To date, however, little is known about chilling effect on phenological events of individual grassland species in Mongolian plateau.
It is imperative to understand phenological change at individual species level in grasslands in response to seasonal and daily temperature variations, particularly to chilling effect, which has significant implications in species distribution, biomass production, and water and carbon cycles, in anticipation of future climate change. The objectives of this study are to: (1) characterize chilling effect on plant phenology at species level using a long-term phenological dataset from Inner Mongolia, China; (2) develop a physiological model to account for and subsequently simulate chilling effects on species phenology; and (3) predict future climate change impacts on species distribution in Inner Mongolian grasslands.
2. Materials and methods
2.1 Study sites
Phenological and climate data were collected at eight (8) experimental sites in Inner Mongolia Autonomous Region of China, located between 97°10'E to 126°09'E and 37°24'N to 53°20'N (figure 1). The vegetation types at these sites include meadow steppe (found in Ergun, Ewenkizu Qi or Ewenki, and Bayaertuhushuo or Bayar), typical steppe (found in Xilinhot or Xilinhot, Xianghuang Qi or Xianghuang and Qahar Youyi Houqi or Qahar) and desert steppe (found in Wushenzhao or Wushenzhao and Alxa League or Alxa). The climate in Inner Mongolia can be characterized by cold and dry winter and warm and rainy summer, with higher rain-use efficiency than most other areas in the semi-arid and arid regions of China (Zhang et al 2011). The annual rainfall decreases gradually from the East (∼400 mm) to the West (∼200 mm) while the corresponding annual mean temperature ranges from −1.6 °C to 9.2 °C.
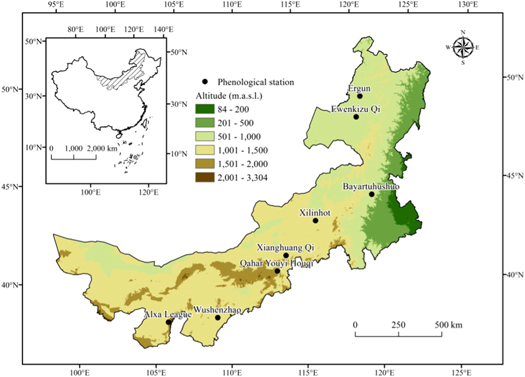
Figure 1. Distribution of observation sites in Inner Mongolia, where m.a.s.l stands for meters above sea level.
Download figure:
Standard image High-resolution image2.2 Phenological and climate data
The phenological data of thirteen dominant grassland species were collected at the eight experimental sites, including the timing of the main phenophases, such as green-up, heading, flowering, fruiting and senescence from 1981 to 2011 by the China Meteorological Administration and the Inner Mongolia Meteorological Bureau of China. These experimental sites were located in natural pastures with an area of ∼10 000 m2 at each site where thirteen dominant grassland species (table 1) were found to include Poaceae (6 species), Rosaceae (1 species), Asteraceae (2 species), Zygophyllaceae (2 species), Fabaceae (1 species) and Tamaricaceae (1 species). A permanent experimental plot (10 m2) at each site was set up to collect phenology data for each species found within the plot. Ten individual plants for each species were examined in the afternoon every two days to record phenological information. The date of each phenological event was recorded when 50% of observed plants reached to a phenological event. For species with branches, the observations were made on the main stems only.
Table 1. Summary of dominant species and phenology dataset at observation stations.
| Station | Species | Family of species | Start year | End year | Number of observation years | Steppe type |
|---|---|---|---|---|---|---|
| Ergun | Leymus chinensis | Gramineae | 1983 | 2007 | 20 | Meadow |
| Stipa baicalensis | Gramineae | 1983 | 2011 | 26 | ||
| Ewenki | Leymus chinensis | Gramineae | 1984 | 2011 | 11 | Meadow |
| Stipa baicalensis | Gramineae | 1984 | 2009 | 14 | ||
| Agropyron cristatum | Gramineae | 1995 | 2011 | 9 | ||
| Artemisia frigida | Compositae | 1997 | 2005 | 6 | ||
| Bayar | Leymus chinensis | Gramineae | 1983 | 2010 | 22 | Meadow |
| Agropyron cristatum | Gramineae | 1988 | 2010 | 22 | ||
| Potentilla tanacetifolia | Rosaceae | 1989 | 2010 | 18 | ||
| Xilinhot | Stipa krylovii | Gramineae | 1984 | 2011 | 20 | Typical |
| Leymus chinensis | Gramineae | 1988 | 1991 | 3 | ||
| Cleistogenes squarrosa | Gramineae | 1987 | 2011 | 12 | ||
| Artemisia frigida | Compositae | 1995 | 2007 | 11 | ||
| Xianghuang | Leymus chinensis | Gramineae | 1984 | 2009 | 18 | Typical |
| Stipa krylovii | Gramineae | 1985 | 2009 | 22 | ||
| Agropyron cristatum | Gramineae | 1984 | 2009 | 23 | ||
| Artemisia frigida | Compositae | 1988 | 1991 | 4 | ||
| Qahar | Stipa krylovii | Gramineae | 1983 | 2006 | 22 | Typical |
| Leymus chinensis | Gramineae | 1983 | 2007 | 23 | ||
| Wushenzhao | Puccinellia distans | Gramineae | 1981 | 2009 | 28 | Desert |
| Phragmites australis | Gramineae | 1981 | 2009 | 28 | ||
| Leymus secalinus | Gramineae | 1986 | 2009 | 20 | ||
| Alxa | Sarcozygium xanthoxylon | Zygophyllaceae | 1983 | 2007 | 23 | Desert |
| Caragana stenophylla | Leguminosae | 1983 | 2002 | 13 | ||
| Nitraria tangutorum | Zygophyllaceae | 1983 | 2007 | 21 | ||
| Reaumuria songorica | Tamaricaceae | 1983 | 2007 | 23 |
In addition to the phenological data, daily minimum, mean and maximum air temperatures along with daily precipitation data from 1981 through 2011 were obtained from the China Meteorological Administration recorded at nearby weather stations (supplementary table 1).
For future scenario analysis, climate data from 2041 to 2100 timeframe were taken from the output of PRECIS (Providing Regional Climates for Impacts Studies), a regional climate modeling system based on the third generation of the Hadley Centre's regional climate model (HadCM3) (Jones et al 2004). The IPCC SRES A2 scenario, which represents an environmentally pessimistic development pathway in China under medium-high emissions, is used in this study. The model predictions from 1961 to 1990 were in a good agreement with the climate record in Inner Mongolia (Xu et al 2006) and were used in estimating the grassland net primary productivity (Li et al 2014). The predicted future phenologies of the species were averaged from 2041 to 2070 to present the period of the 2050s (s indicates a decade), and from 2071 to 2100 to represent the period of the 2080s. The future phenological characteristics were compared to the historical observation data from 1981 to 2011 to derive standard deviations of phenology in the future.
In this study, the observed phenological events and climate data from 1981 to 2000 were used for model development, while the data from 2001 to 2011 were used for model verification. Since the observation data of Caragana stenophylla at Alxa was only available from 1983 to 2002, the data prior to 1995 for this species were used for model development and those acquired after 1995 were used for model validation.
2.3 Description of phenological models
In this study, we first analyzed phenological data from 1981 to 2000 using an existing thermal time (TT) model and an existing physiological time (PT) model. The PT model then was modified to include chilling effect (PTc) to assess potential impact of climate warming trend on plant phenologies. The new PTC model was then validated using data from 2001 to 2011 and subsequently used to simulate phenologies under future climate scenarios.
The TT model is based on the concept of TT (°C d), similar to models based on growing degree days (Monteith 1977). It assumes a linear relationship between development rate and temperature above a base line Tb (Bonhomme 2000, Thompson and Clark 2006, Zhang et al 2008):

where TT is set to zero when the temperature T is below Tb.
The PT model assumes a 'broken stick' response function (see supplementary figure 1) with the temperature (Diekmann 1996, Campbell and Norman 1998, Soltani et al 2006, Zhang et al 2008, Wang et al 2014). It further assumes a maximum development rate when temperature is above a threshold and it calculates the number of days required for a certain phenological event to occur (Zhang et al 2008, Wang et al 2014). The PT can be either calculated from field observations or modeled as a function of temperature. Previous studies suggested that the function is usually a two-phase linear 'broken stick' or a smooth optimum relationship with temperature (Yin et al 1995).
It is noted that in this study we did not consider a maximum temperature tolerance (e.g. 35 °C for most plant species) that could hinder plant development, because daily temperature during the warmest month, July, in Inner Mongolia rarely reaches 23 °C. Therefore, we assume that the daily growth is at its maximum rate when the temperature is above the optimum baseline.
In this study, PT is calculated by summing daily values of the thermal effectiveness  (ranging from 0.0 to 1.0) starting from the first day of the year (Hanninen 1995, Cao and Moss 1997):

where
T is the daily temperature, Tb is the base temperature, and To is the optimal temperature.
In addition to the accumulation of heat needed for plants to develop leaves or flower in spring, many plants in temperate climate zone require an accumulation of cold days (chilling effect) to break plant dormancy for woody species (Campoy et al 2012, Luedeling et al 2013, Guo et al 2015) and to vernalize floral initiation in herbaceous species (Donald 1984, Cao and Moss 1997). Therefore, the PT model was further modified to account for chilling effect by assuming that lack of chilling would delay the optimal development. The modified model, PTC, accounts for both the effect of chilling completion (CC) and thermal effectiveness to achieve phenological stages.
The chilling effect, c(T), can be modeled by setting the value to be 1.0 when the temperature is between the baseline and optimal temperatures (Cao and Moss 1997) and 0.0 when the temperature is below chilling-base temperature Tcb to account for frozen effect. When the temperature is in between Tco and Tcm, it is a simple linear function. There is no chilling effect when the temperature is above the maximum chilling temperature (Tcm) or below the chilling-base temperature (Tcb). Mathematically chilling effect, c(T), can be expressed as:
where, Tcb is the base temperature to be determined experimentally, Tco is the optimal temperature, and Tcm is the maximum temperature for chilling effect.
Phenological development is dependent on CC (Cao and Moss 1997), expressed as the fraction of accumulated chilling effect c(T) from 1 October of the previous year to the total chilling requirement (CCm). The value of CC is set to a maximum value of 1.0

Chilling-adjusted PT (PTC) can be modeled as the product of daily temperature effect f(T) and CC (Cao and Moss 1997). The PTC is the number of physiological days required under optimal development and CC. If the chilling is not completed, the development rate of species is reduced proportionally. Due to the chilling requirement of floral initiation in grass species, the chilling effect is only used for predicting flowering events. Therefore, the PTc is expressed as:

The integration time (t, days) of TT, PT and PTC starts from 1 January of a year to each event for all species. However, the CC is calculated from 1 October of the previous year to include both initiations of leaf and the floral buds (Donald 1984, Chen et al 2014).
2.4 Model parameterization
The base temperature (Tb) and optimal temperature (To) for the model were determined by fitting the model to historical observations. Doing so, we first tested Tb using a TT model (Monteith 1977, Bonhomme 2000, Thompson and Clark 2006, Zhang et al 2008), by setting Tb value from 0 °C to 10 °C to determine the Tb with the least square fitting. We then tested To by using the PT model at a fixed Tb determined in the first step with the value of To set between 10 °C and 30 °C to determine the To with least square fitting. To determine the threshold temperatures of chilling, we first fixed the chilling-base temperature for grass species based on previous research (Fu et al 2014), and then determined the values of optimal and maximum chilling temperatures.
Further, based on the analysis of experimental data,  and
and  were set to 0 °C and 15 °C for equation (3), respectively.
 and
and  were set to −5 °C, 0 °C, and 5 °C for equation (4), respectively. The same thresholds were used in the model for all herbaceous species and shrubs found at our study sites in Inner Mongolia.
The requirements of CCm for different species were categorized into strong (CCm = 65), moderate (CCm = 60) and weak (CCm = 50) sensitivities to chilling temperatures. The CCm was estimated from the phenological data from 1981 to 2000.
2.5 Accounting for diurnal temperature variation
The daily maximum and minimum temperatures do not change at the same rate; they are often accompanied by reduced frost occurrence and increased heat stresses (Wang et al 2015). Including the variation of minimum and maximum temperatures rather than only using daily average in the model enables better presentation of phenological characteristics in understanding climate impacts on plant growth.
The daily mean temperature was calculated as the average of the daily maximum and minimum values (Cannell and Smith 1983). The effect of diurnal temperature variation on chilling-adjusted PT (PTC) was considered as 50% in average, 25% in both maximum and minimum air temperatures (Yang et al 2004, Zhang et al 2008). The actual daily thermal effect f(T) can be distributed among these three temperatures by:
where f(Tmean), f(Tmax) and f(Tmin) are the thermal effect calculated in equation (3), replacing T with Tmean, Tmax and Tmin, respectively. Calculation of actual c(T) regarding daily temperature variation is similar to the calculation of actual f(T).
2.6 Historical phenology and model evaluation
To assess the predictive capability of the model, the root mean square error (RMSE) and the coefficient of variation of the root mean square error (CVRMSE) were used as indicators of model fitting:

where obsi is the observed phenological date in year i at a given site, prei is the simulated phenological date, and n is number of years. CVRMSE (%) is calculated by the RMSE normalized to the mean of the observed values. The prediction is considered excellent if the CVRMSE < 10% and good if 10 < CVRMSE < 20% (Lin et al 2008).
3. Results
3.1 Climate characteristics
In most years, the maximum temperature and precipitation occurred in July at all study sites, except at Wushenzhao station, which occurred in August. Variations in precipitation (CV = 15.0%) and mean air temperature (CV = 17.6%) across all years and sites were quite high. From 1981 to 2010, significant (P < 0.05) increasing trends were observed in air temperatures at a rate of 0.42 °C per decade for annual maximum temperature (R2 = 0.30, P < 0.01), 0.47 °C per decade for the average (R2 = 0.37, P < 0.01), and 0.53 °C per decade for the minimum (R2 = 0.42, P < 0.01) across all study sites (figure 2(a)). In other words, minimum temperatures were increasing at a rate that is faster than mean and maximum temperatures. Annual precipitation indicate an insignificant decreasing trend (1.53 mm per decade) (R2 = 0.08, P = 0.1) (figure 2(b)).
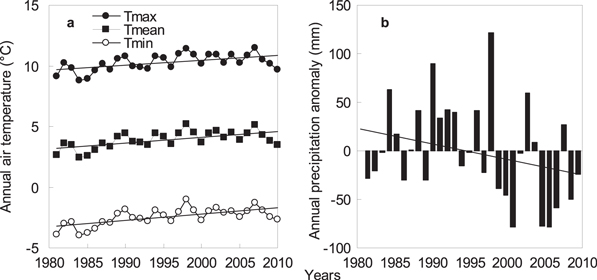
Figure 2. Annual maximum (Tmax), mean (Tmean), minimum (Tmin) temperatures (a) and annual precipitation anomaly (b) at eight observation stations from 1981 to 2010 in Inner Mongolia. Regressions for trends were y = 0.042x − 73.9 (R2 = 0.30, P < 0.01, s.d. = 0.68 °C) for Tmax, y = 0.047x − 90.52 (R2 = 0.37, P < 0.01, s.d. = 0.71 °C) for Tmean, and y = 0.053x − 107.13 (R2 = 0.42, P < 0.01, s.d. = 0.69 °C) for Tmin. Regression for trend of annual precipitation anomaly was y = −1.53x + 23.83 (R2 = 0.08, P = 0.1, s.d. = 49.58 mm).
Download figure:
Standard image High-resolution image3.2 Phenological thermal requirements
The thermal requirement for each phenological development stage differed significantly (P < 0.01) among species (table 2). The thermal requirement for green-up ranged from 150 to 196 °C d for TT and from 9.6 to 12.4 days for PT for most species and sites, except for some species in Western regions, e.g. Cleistogenes squarrosa, Phragmites australis, Reaumuria songorica and Nitraria tangutorum, with a much higher requirement, 249–574 °C d for TT and 16.2–34.8 days for PT. The time from green-up to flowering of Stipa at five sites in middle and Eastern regions was 1575 °C d for TT and 78.8 days for PT, while that of Leymus chinensis in the same region was lower than that of Stipa, 963 °C d for TT and 52.4 days for PT. In the Western region (Alxa), the dominant species Caragana stenophylla had the earliest green-up among all species, and had the longest growing period from green-up to senescence, 3555 °C d for TT and 181 days for PT. The variation (percentage of standard error over the mean value) of physiological days for all stages was 16.9% smaller than that of TT, which indicates higher accuracy in the PT approach for quantifying grass phenology.
Table 2. The observed phenological day (days), thermal time (TT, °C d) and physiological development day under optimal temperature (PT, days) of each phenology for dominant species at observation sites from 1981 to 2000. The mean values with s.e. (standard error) were given for all sites and years. All development stages started from the first day of a year.
| Green-up | Heading | Flowering | Fruiting | Senescence | |||||||||||
|---|---|---|---|---|---|---|---|---|---|---|---|---|---|---|---|
| Species | Day | TT | PT | Day | TT | PT | Day | TT | PT | Day | TT | PT | Day | TT | PT |
| Stipaa | 116.0 ± 1.5 | 182 ± 10 | 11.6 ± 0.6 | 190.9 ± 2.6 | 1337 ± 51 | 72.8 ± 2.5 | 209.6 ± 3.1 | 1691 ± 61 | 90.4 ± 2.9 | 233.6 ± 3.0 | 2131 ± 58 | 112.8 ± 2.8 | 259.7 ± 2.5 | 2512 ± 45 | 133.6 ± 2.2 |
| L. chinensis | 116.0 ± 1.3 | 181 ± 9 | 11.6 ± 0.5 | 169.3 ± 1.5 | 913 ± 30 | 52.2 ± 1.6 | 181.8 ± 1.3 | 1144 ± 26 | 64.0 ± 1.49 | 222.5 ± 1.9 | 1945 ± 42 | 103.3 ± 2.1 | 261.1 ± 1.3 | 2561 ± 27 | 136.4 ± 1.4 |
| A. cristatum | 110.9 ± 2.4 | 175 ± 25 | 11.0 ± 1.4 | 168.8 ± 2.5 | 951 ± 51 | 54.0 ± 2.4 | 187.2 ± 2.3 | 1294 ± 51 | 71.2 ± 2.4 | 219.5 ± 2.5 | 1950 ± 51 | 102.8 ± 2.5 | 252.7 ± 1.8 | 2529 ± 29 | 132.7 ± 1.6 |
| A. frigida | 108.1 ± 4.5 | 150 ± 27 | 9.6 ± 1.6 | — | — | — | 231.6 ± 3.2 | 2239 ± 91 | 114.4 ± 3.6 | 264.8 ± 5.0 | 2726 ± 91 | 140.8 ± 4.0 | 282.2 ± 4.2 | 2894 ± 78 | 151.0 ± 3.4 |
| C. squarrosa | 121.7 ± 5.1 | 302 ± 73 | 18.3 ± 4.1 | 215.4 ± 3.2 | 1979 ± 41 | 101.3 ± 2.6 | 236.6 ± 7.6 | 2381 ± 137 | 121.1 ± 6.6 | 253.3 ± 4.7 | 2671 ± 79 | 136.4 ± 3.7 | 265.3 ± 3.2 | 2849 ± 79 | 146.3 ± 3.4 |
| L. secalinus | 96.2 ± 1.0 | 171 ± 8 | 11.2 ± 0.5 | 166.3 ± 1.2 | 1151 ± 35 | 64.5 ± 1.7 | 179.3 ± 1.5 | 1415 ± 38 | 77.0 ± 1.7 | 214.8 ± 1.2 | 2195 ± 36 | 112.0 ± 1.6 | 226.4 ± 1.9 | 2436 ± 47 | 123.4 ± 2.2 |
| P. australis | 132.4 ± 1.2 | 574 ± 15 | 34.8 ± 0.8 | 202.9 ± 1.3 | 1955 ± 38 | 101.2 ± 1.6 | 240.7 ± 1.0 | 2746 ± 33 | 138.0 ± 1.3 | 269.9 ± 0.9 | 3198 ± 32 | 162.9 ± 1.2 | 274.1 ± 1.3 | 3249 ± 37 | 165.9 ± 1.5 |
| P. distans | 93.7 ± 1.2 | 152 ± 12 | 10.0 ± 0.8 | 163.6 ± 0.9 | 1114 ± 19 | 62.6 ± 1.0 | 174.5 ± 0.9 | 1333 ± 24 | 73.1 ± 1.1 | 197.9 ± 1.8 | 1843 ± 45 | 96.1 ± 1.9 | 210.2 ± 2.1 | 2115 ± 55 | 108.2 ± 2.4 |
| P. tanacetifolia | 112.5 ± 3.3 | 196 ± 25 | 12.4 ± 1.5 | — | — | — | 210.7 ± 2.1 | 1811 ± 65 | 95.4 ± 2.5 | 238.33 ± 2.7 | 2349 ± 57 | 122.0 ± 2.9 | 256.7 ± 2.2 | 2634 ± 56 | 137.6 ± 2.7 |
| R. songorica | 100.5 ± 1.6 | 249 ± 16 | 16.2 ± 1.0 | — | — | — | 214.1 ± 1.7 | 2382 ± 31 | 119.5 ± 1.2 | 273.59 ± 1.1 | 3506 ± 41 | 175.6 ± 1.4 | 316.1 ± 1.5 | 3849 ± 39 | 197.3 ± 1.2 |
| N. tangutorum | 110.9 ± 1.7 | 359 ± 21 | 23.0 ± 1.2 | — | — | — | 155.4 ± 2.4 | 1076 ± 49 | 61.6 ± 2.4 | 205.07 ± 1.3 | 2175 ± 41 | 110.6 ± 1.7 | 306.9 ± 1.4 | 3821 ± 45 | 195.0 ± 1.5 |
| S. xanthoxylon | 91.6 ± 1.5 | 172 ± 13 | 11.3 ± 0.8 | — | — | — | 117.6 ± 1.6 | 435 ± 16 | 27.6 ± 0.9 | 178.63 ± 1.2 | 1552 ± 32 | 83.9 ± 1.5 | 299.1 ± 2.0 | 3766 ± 38 | 191.7 ± 1.2 |
| C. stenophylla | 92.7 ± 2.2 | 170 ± 28 | 11.1 ± 1.7 | — | — | — | 122.0 ± 3.7 | 480 ± 58 | 30.0 ± 3.1 | 172.4 ± 2.7 | 1387 ± 70 | 76.1 ± 3.3 | 307.7 ± 2.1 | 3725 ± 27 | 192.1 ± 0.5 |
The maximum chilling requirements (CCm) for 13 species in Inner Mongolia ranged from 38 to 66 (table 3), which indicates the possibility of difference in CC for different species with respect to chilling sensitivity (strong, medium or weak). The chilling time in meadow steppe or typical steppe was less than 50 while in desert steppe, it was slightly more than 60. The variation (SE/mean, %) in chilling-adjusted PT (PTC) was 2.42% for senescence. The variations of PTC for all developmental stages were similar to that of PT and smaller than that of TT. These results suggest that all species in Inner Mongolia meet the chilling requirement under current climatic condition.
Table 3. Chilling-adjusted physiological time (PTC, days) of 13 species at eight observation sites from 1981 to 2000. The mean values with s.e. (standard error for years) was given. All development stages started from the first day of a year. Chilling effect of previous year was included in the model.
| Species | Site | CCma | Green-up | Heading | Flowering | Fruiting | Senescence |
|---|---|---|---|---|---|---|---|
| Stipab | Xianghuang | 53.0 ± 1.4 | 8.4 ± 1.3 | 49.6 ± 6.2 | 66.0 ± 7.1 | 87.1 ± 7.5 | 118.4 ± 6.4 |
| Ergun | 37.5 ± 1.4 | 7.6 ± 0.5 | 46.9 ± 1.8 | 56.8 ± 2.1 | 72.3 ± 2.5 | 101.6 ± 2.3 | |
| Ewenki | 39.9 ± 1.5 | 6.9 ± 0.4 | 60.7 ± 2.9 | 78.6 ± 4.9 | 100.7 ± 3.6 | 117.9 ± 2.8 | |
| Xilinhot | 45.7 ± 1.5 | 5.4 ± 0.8 | 82.5 ± 2.6 | 105.1 ± 4.7 | 123.0 ± 3.2 | 138.2 ± 4.3 | |
| Qahar | 56.0 ± 1.7 | 15.9 ± 1.0 | 75.4 ± 4.5 | 92.4 ± 4.1 | 124.8 ± 2.7 | 139.5 ± 2.1 | |
| Mean | 47.0 ± 1.1 | 9.0 ± 0.6 | 62.6 ± 2.5 | 79.5 ± 3.0 | 101.1 ± 3.2 | 121.7 ± 2.5 | |
| L. chinensis | Xianghuang | 53.0 ± 1.5 | 8.1 ± 1.1 | 51.3 ± 1.7 | 63.9 ± 1.7 | 94.1 ± 3.4 | 131.2 ± 2.9 |
| Bayar | 48.7 ± 0.9 | 9.0 ± 0.9 | 41.8 ± 1.8 | 52.9 ± 1.2 | 97.4 ± 3.3 | 131.0 ± 2.4 | |
| Ergun | 38.3 ± 2.3 | 6.0 ± 0.4 | 27.7 ± 2.0 | 34.9 ± 1.8 | 61.0 ± 2.4 | 100.5 ± 3.3.1 | |
| Xilinhot | 49.1 ± 2.3 | 5.4 ± 0.4 | 50.8 ± 3.8 | 61.9 ± 4.5 | 110.2 ± 1.9 | 137.6 ± 9.2 | |
| Ewenki | 38.6 ± 1.6 | 6.4 ± 0.4 | 33.1 ± 2.4 | 44.4 ± 3.5 | 74.0 ± 3.3 | 111.4 ± 3.7 | |
| Qahar | 56.2 ± 1.8 | 15.7 ± 0.8 | 66.5 ± 3.2 | 76.3 ± 2.8 | 118.5 ± 4.1 | 142.1 ± 1.2 | |
| Mean | 49.0 ± 1.0 | 9.1 ± 0.6 | 47.1 ± 1.9 | 57.8 ± 1.9 | 94.9 ± 2.7 | 127.8 ± 2.1 | |
| A. cristatum | Xianghuang | 53.0 ± 1.3 | 10.6 ± 2.8 | 55.4 ± 4.7 | 71.5 ± 4.6 | 94.2 ± 3.8 | 129.4 ± 1.8 |
| Bayar | 49.6 ± 1.1 | 8.6 ± 0.9 | 44.5 ± 1.4 | 62.1 ± 1.6 | 107.5 ± 3.6 | 129.6 ± 3.1 | |
| Ewenki | 39.2 ± 1.9 | 6.4 ± 0.8 | 39.0 ± 1.9 | 52.7 ± 4.5 | 73.0 ± 4.5 | 102.7 ± 4.1 | |
| Mean | 49.8 ± 0.8 | 9.3 ± 1.4 | 49.2 ± 2.6 | 65.4 ± 2.7 | 95.8 ± 3.0 | 125.5 ± 2.2 | |
| A. frigida | Xianghuang | 54.3 ± 1.3 | 6.7 ± 2.7 | 71.0 ± 11.6 | 100.4 ± 4.2 | 126.9 ± 3.6 | 142.8 ± 2.4 |
| Xilinhot | 47.9 ± 1.9 | 3.9 ± 0.6 | 99.1 ± 4.8 | 118.0 ± 3.2 | 148.6 ± 3.2 | 155.1 ± 4.8 | |
| Ewenki | 37.7 ± 1.7 | 11.9 ± 1.3 | 62.7 ± 5.1 | 85.8 ± 4.3 | 105.9 ± 4.6 | 115.9 ± 5.7 | |
| Mean | 46.8 ± 2.0 | 7.0 ± 1.5 | 80.7 ± 5.9 | 103.8 ± 4.3 | 130.2 ± 5.3 | 140.4 ± 5.2 | |
| C. squarrosa | Xilinhot | 47.6 ± 2.2 | 15.1 ± 3.4 | 92.2 ± 3.7 | 111.8 ± 3.74 | 127.1 ± 2.5 | 137.0 ± 3.4 |
| L. secalinus | Wushenzhao | 60.7 ± 1.3 | 9.2 ± 0.5 | 60.9 ± 1.9 | 72.2 ± 2.2 | 107.2 ± 2.0 | 118.6 ± 2.6 |
| P. australis | Wushenzhao | 59.4 ± 1.0 | 31.5 ± 0.9 | 95.4 ± 1.8 | 132.0 ± 1.6 | 156.9 ± 1.5 | 160.2 ± 1.9 |
| P. distans | Wushenzhao | 59.5 ± 1.0 | 7.9 ± 0.7 | 58.3 ± 1.1 | 68.5 ± 1.5 | 90.7 ± 2.1 | 102.4 ± 2.5 |
| P. tanacetifolia | Bayar | 49.8 ± 1.1 | 10.5 ± 1.4 | — | 90.7 ± 29 | 117.1 ± 3.7 | 131.3 ± 3.3 |
| R. songorica | Alxa | 64.4 ± 1.1 | 14.1 ± 1.0 | — | 114.2 ± 2.1 | 170.3 ± 2.2 | 192.0 ± 1.8 |
| N. tangutorum | Alxa | 64.7 ± 1.2 | 20.6 ± 1.3 | — | 58.1 ± 2.5 | 105.5 ± 2.1 | 189.7 ± 2.1 |
| S. xanthoxylon | Alxa | 64.0 ± 1.1 | 9.6 ± 0.8 | — | 25.2 ± 1.0 | 79.8 ± 1.8 | 186.6 ± 1.7 |
| C. stenophylla | Alxa | 66.4 ± 4.2 | 9.5 ± 1.7 | — | 274 ± 3.4 | 71.9 ± 4.2 | 186.1 ± 2.0 |
aCCm indicates the maximum accumulative chilling effectiveness, which is a possible value for the completion of chilling from the first day of a year to flowering time. bStipa indicates Stipa baicalensis and Stipa krylovii.
3.3 Model validation
Compared with the phenology observations from 2001 to 2011, the PTC model results showed agreement with observations for the timing of green-up, heading, flowering, and fruiting. The overall prediction bias across all species, years, and sites was −2.4 days for time to green-up, 3.4 days for flowering, −1.7 days for fruiting, and −7.6 days for senescence. The overall CVRMSE was 9.0% for green-up, 6.9% for flowering, 6.3% for fruiting, and 6.8% for senescence (table 4). For all phenological events, the chilling-adjusted PT (PTC) models for Stipa and Leymus chinensis had small biases (figure 3). However, the predictions at the Xianghuang site showed a large discrepancy compared to the observations (figure 3), which we postulate was caused by frequent droughts.
Table 4. Predicting bias (days) and cumulative variation of root mean squared error (CVRMSE, %) for the validation of chilling-adjusted physiological time model (PTC) for 13 species at eight observation sites from 2001 to 2011.
| Green-up | Heading | Flowering | Fruiting | Senescence | ||||||
|---|---|---|---|---|---|---|---|---|---|---|
| Species | Bias | CVRMSE | Bias | CVRMSE | Bias | CVRMSE | Bias | CVRMSE | Bias | CVRMSE |
| Stipaa | −2.4 | 9.5 | −0.6 | 13.0 | 3.7 | 12.9 | 5.4 | 14.3 | 4.8 | 12.3 |
| L. chinensis | −2.0 | 9.3 | −7.0 | 13.6 | −7.7 | 13.2 | −6.8 | 10.7 | −3.3 | 6.9 |
| A. cristatum | −3.5 | 9.3 | 3.8 | 9.1 | 4.5 | 9.2 | 0.2 | 9.2 | 3.9 | 7.4 |
| A. frigida | −1.2 | 8.8 | −5.9 | 6.9 | −4.3 | 4.5 | −3.7 | 6.8 | −12.4 | 7.3 |
| C. squarrosa | −0.3 | 6.2 | 3.8 | 5.1 | 13.7 | 7.7 | 4.3 | 3.1 | 4.3 | 2.6 |
| L. secalinus | −7.5 | 9.6 | −1.0 | 3.9 | 2.6 | 4.1 | −5.8 | 4.2 | −23.3 | 9.8 |
| P. australis | −1.3 | 4.8 | 0.6 | 4.4 | 3.4 | 5.1 | −4.6 | 3.4 | −11.9 | 4.8 |
| P. distans | −17.0 | 17.6 | −1.2 | 3.1 | 1.4 | 2.9 | 0.2 | 4.0 | −14.0 | 7.6 |
| P. tanacetifolia | −2.8 | 11.5 | 11.2 | 8.8 | 12.3 | 9.1 | 10.3 | 8.9 | 9.2 | 9.7 |
| R. songorica | 2.9 | 7.8 | −7.0 | 6.2 | 1.4 | 6.6 | −5.4 | 2.8 | −17.0 | 5.7 |
| N. tangutorum | −3.3 | 10.7 | — | — | 4.8 | 5.0 | −3.7 | 3.4 | −15.8 | 5.2 |
| S. xanthoxylon | 4.0 | 6.2 | — | — | 0.1 | 1.5 | −6.1 | 6.7 | −3.7 | 2.8 |
| C. stenophylla | 2.8 | 6.2 | — | — | 8.0 | 8.0 | −7.0 | 4.1 | −19.5 | 6.5 |
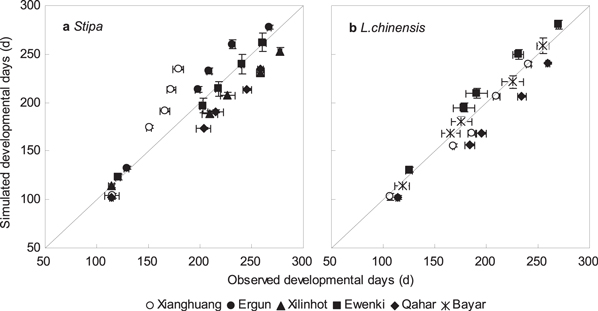
Figure 3. The comparison between all observed and simulated phenology events for Stipa (a) and Leymus chinensis (b) by using chilling-adjusted physiological time model (PTC) at 6 sites from 2001 to 2011.
Download figure:
Standard image High-resolution image3.4 Simulated phenological change under future climate change
Using the A2 climate scenario, we projected phenology for Stipa and Leymus chinensis in two future time periods: 2041–2070 (2050s) and 2071–2100 (2080s). For Stipa, the timing of green-up in the 2050s is 6.4 days earlier than in the 2080s, but not significantly different from historical observations. The length of the growing season of Stipa would be shortened by 9.8 days in the 2050s and by 11.0 days in the 2080s (figure 4(a)). For Leymus chinensis, the green-up time was 5.8 days earlier in the 2050s and 10.9 days earlier in the 2080s than historically observed values. The length of the growing season of Leymus chinensis is predicted to be shortened by 9.0 days in the 2050s and by 7.8 days in the 2080s (figure 4(b)). The shortening of growing season for two grass species in future climate change comparing to historical observations was due to earlier senescence.
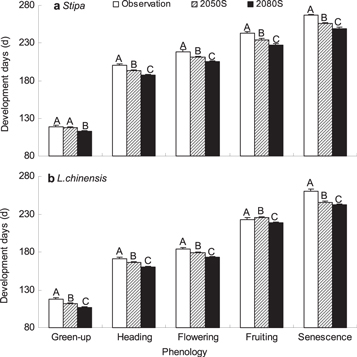
Figure 4. Changes in phenology events of Stipa and Leymus chinensis under future climate change predicting by chilling-adjusted physiological time model. Climate scenario for the emission situation of A2 (with medium-high emissions) in Inner Mongolia was used. Observation was averaged from 1983 to 2011, 2050s indicates the period from 2041 to 2070 and 2080s is the period from 2071 to 2100.
Download figure:
Standard image High-resolution image4. Discussion and conclusions
The plant phenology in Inner Mongolia varied between years and among the study sites due to difference in climate patterns. The species in desert steppe in the Western part of the region required much more TT (°C d) or PT (days) than those in meadow and typical steppe in the central and Eastern part of the region.
The chilling-adjusted physiological phenology model captured fundamental characteristics of species, indicated by its agreement with the observations. The bias for each modeled phenophase ranged from −7.6 to 3.4 days with CVRMSE < 9.0%. It should be noted that the current model neglects photoperiod effect (Cao and Moss 1997), which is also important in grass species. The chilling-adjusted phenological model did not improve the prediction much in comparison with physiological model (see supplementary table 2 and figure 2). However, it is more adaptable to assess climate change, particularly when the increase in minimal temperature might reduce the possibility of CC.
Compared with the historical records, phenological development from green-up to senescence of two major grass species is projected to be shortened by 9 to 10 days in the 2050s and 8 to 11 days in the 2080s under A2 future climate scenario.
The plant thermal requirement is an essential indication to estimate the length of different phenological development phases (McMaster and Wilhelm 1997, Bonhomme 2000, Trudgill et al 2005). The linear relationship between development rate and temperature is commonly used, and the nonlinear relationship involving optimal and maximal temperatures is increasingly applied to improve the estimation accuracy as it accounts better for climate extremes (Wang 1960, McMaster and Wilhelm 1997, Agonga 2006). In this study, we used 0 °C as a base temperature and 15 °C as an optimal temperature for all species based on historical observations. However, controlled experiments are needed to obtain more accurate estimates of cardinal temperatures for different species. Extremely high temperatures would delay plant development rate by deactivating certain enzymes (Bonhomme 2000) or damaging plant tissue (Alshareef 2010). In this study, the negative effect of high temperature was not considered because this region is mostly below optimal temperature.
Unlike many woody species where the flower bud is exposed to low temperatures during autumn and winter, the grass species starts floral stage after the physiological grass growth in spring. However, the chilling effect on leaf buds of grass species might start from the autumn in previous year; the accumulation of chilling is therefore reasonable in this study to be set from 1 October of the previous year. Most perennial grasses in temperate climate have a chilling requirement for flowering, with a primary induction brought about by low temperatures (Heide 1994, Tooke and Battey 2010). As global warming trend continues, especially in winter, plant development in spring is expected to be delayed due to the lack of chilling effect (Yu et al 2010, Guo et al 2015). It is difficult to quantify the collective warming and chilling effects on the timing of phenophase. Further, decoupling of chilling followed by climate warming is also difficult to evaluate, with little evidence of chilling effect being found (Clark et al 2014).
There are many practical questions that remain unanswered including if species adapt to warming conditions by changing their chilling requirements, but they should be addressed in future studies (Schwartz and Hanes 2010). This study only explored chilling effects on grass phenology at the species level. Some herbaceous species, especially those that are sensitive to chilling, such as winter wheat, requires certain accumulation of chilling temperature to initiate the flowering (Donald 1984) and thus, chilling becomes an important factor in the phenological model (Cao and Moss 1997). Chilling effect on grass species is typically ignored in many phenological models because its leaf phenology is likely opportunistic. Grass species cannot be vernalized as imbibed seed (a stage when the seeds absorb water from the soil before germination and emergence occur) and therefore must first produce a certain amount of vegetative growth as a seedling, e.g. reed canary grass (Pbalaris Arundinacea) (Donald 1984). The chilling-adjusted phenological model proposed in this study made it possible to study phenological changes in other ecological regions.
The photoperiod effect is also important to predict grass species phenology (Tooke and Battey 2010). However, this is not included in our current phenological model because our observations were made under an environmental condition where the differences in day length were too small to quantify this effect. Photoperiod is found to compensate for the lack of chilling effect, and might be more influential than temperature in some tree species phenology (Way and Montgomery 2014). However, we do not know if this would be the case for leaf phenology (versus flower phenology) of grass species.
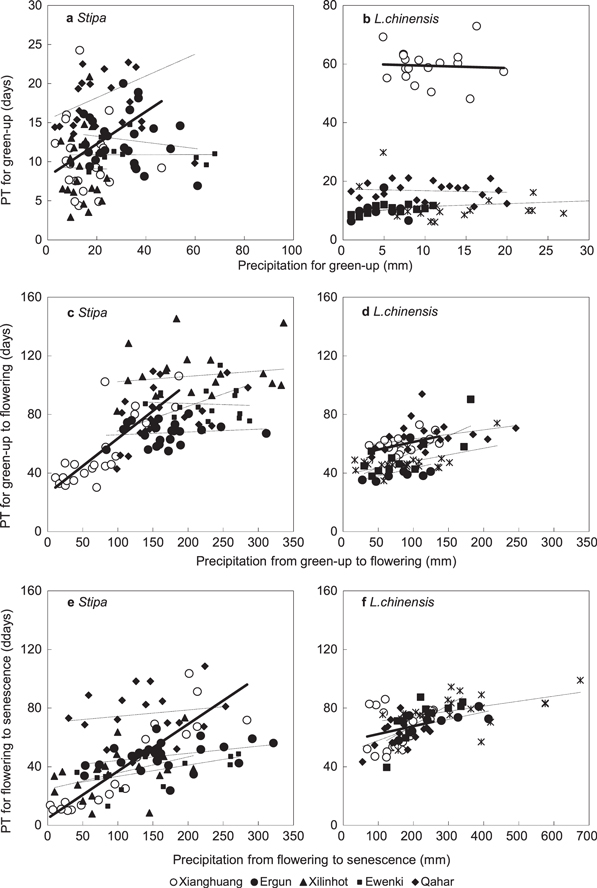
Precipitation is a dominant factor determining productivity of grasslands in arid and semi-arid regions (Li et al 2014) and also an important regulator of spring phenology (Cong et al 2013). The influence of precipitation on phenological phases is also vegetation type and soil water dependent (Jolly and Running 2004, Piao et al 2006, Liancourt et al 2012). We found the flowering and senescence times of Stipa and Leymus chinensis were significantly sensitive to drought (figure 5), but there was little impact on green-up (figures 5(a) and (b)).
Figure 5. Relationships between total precipitation (mm) and physiological time (PT, days) for green-up, flowering and senescence in Stipa and Leymus chinensis. The times that the grasses are motivated to flower and senescence are linearly increased with precipitation (solid lines) in Xianghuang (open circles) while there are no significant difference in other sites (dotted lines and solid circles).
Download figure:
Standard image High-resolution image
There was also an overall increasing trend for precipitation and physiological development for Leymus chinensis, with a regression of y = 0.13x + 42.92 (R2 = 0.24, P < 0.01) (figure 5(d)). To further improve the prediction of phenology in grass species, patterns of precipitation need to be taken into account (Cong et al 2013, Chen et al 2014, Shen et al 2014). In the future, it would be beneficial to quantify the drought effect on grass phenology while considering both regional precipitation and soil moisture content (pre-green-up precipitation). Additionally, plant fertilization is also sensitive to temperature stress during the flowering and pollen development stages (Thuzar et al 2010).
Change in phenological events and growing season length, associated with the future climate change, could be crucial for determining appropriate grazing pressure, estimating net primary productivity of grasslands (Piao et al 2007, Caldararu et al 2014, Chen et al 2014), and ecosystem functioning (Edwards and Richardson 2004). Controlled experiments are needed to understand the physiological and ecological mechanisms on the relationship between species-level phenological events and thermal requirement, such as chilling effect.
Acknowledgments
This research was supported by National Basic Research Program of China '973' (2012CB956204), National Nature Science Fund (NSFC) Project (41271053, 31461143025, 41475104, 41401048), NASA Land Cover Land Use Change (NNX08AH50G), and the 1000-talent project at Zhejiang University. We thank Dr Wopke van der Werf in Wageningen University for his helpful comments and reviews.