

Abstract
While terrestrial precipitation is a societally highly relevant climate variable, there is little consensus among climate models about its projected 21st century changes. An important source of precipitable water over land is plant transpiration. Plants control transpiration by opening and closing their stomata. The sensitivity of this process to increasing CO2 concentrations is uncertain. To assess the impact of this uncertainty on future climate, we perform experiments with an intermediate complexity Earth System Climate Model (UVic ESCM) for a range of model-imposed transpiration-sensitivities to CO2. Changing the sensitivity of transpiration to CO2 causes simulated terrestrial precipitation to change by −10% to +27% by 2100 under a high emission scenario. This study emphasises the importance of an improved assessment of the dynamics of environmental impact on vegetation to better predict future changes of the terrestrial hydrological and carbon cycles.
Export citation and abstract BibTeX RIS

Content from this work may be used under the terms of the Creative Commons Attribution 3.0 licence. Any further distribution of this work must maintain attribution to the author(s) and the title of the work, journal citation and DOI.
1. Introduction
Terrestrial evapotranspiration is the transfer of water from the land surface to the atmosphere. It is the sum of evaporation from soils and vegetation, and plant transpiration [1]. The partitioning of evapotranspiration into its three components is not accurately know [2]. In the second global soil wetness project [3] 13 land models were forced by reanalyses data and direct measurements and it was found that the multi-model mean estimate of plant transpiration amounts to 48% of global evapotranspiration [2]. Transpiration describes the evaporation of water from the vascular system of plants through leaf pores, or stomata. It couples the biochemical process of leaf carbon uptake through photosynthesis with the biophysical process of moisture exchange [4]. Both processes depend on the opening of stomata, defining the strength of stomatal conductance [5].
Stomatal conductance is sensitive to atmospheric CO2 concentrations, since the rate of photosynthesis that can be performed by the plant, depends on how much carbon and moisture is available. Opening the stomata allows plants to take up more CO2 through diffusive fluxes from the ambient air, simultaneously they will lose more water through the opened stomata. Thus, there is a trade off between CO2 uptake and the associated water loss, which defines the water-use efficiency (WUE) of the plant.
With increasing atmospheric CO2 concentrations, the diffusive flux of CO2 will increase and the stomata can take up the same amount of carbon, while opening their stomata less often [6]. However, it is currently under debate if plants will take up more carbon and grow more biomass by optimizing their WUE or if they will reduce their water loss and grow the same biomass. A recent study in which WUE was derived from satellite-based remote sensing data suggest that land-cover and land-use changes in recent years caused an small decline in the global WUE [7], with a lot of internal variability. In contrast to this, in various CO2 enrichment experiments a decrease in stomatal conductance was evident. However, even under experimental conditions, there is a large uncertainty in the CO2 induced change in stomatal conductance [8]. In open-top chamber experiments, the relative decrease in stomatal conductance varied between 8.3% and 59%, with CO2 concentrations increased to between 550 and 900 ppm. Likewise an overall decrease in evapotranspiration and an increase in the plants' WUE with higher levels of CO2, were observed during open field and forest, free-air concentration enrichment experiments [5]. The observed changes in these terrestrial ecosystems are larger in magnitude than predicted by 13 terrestrial biosphere models and suggest a partial closure of stomata [5]. Closing stomata will reduce the water exchange between vegetation and atmosphere [1], which is likely to feed back on the amount of water vapour in the atmosphere available for precipitation.
Although a positive trend in precipitation under CO2 induced global warming is expected from the Clausius–Clapeyron equation [9, 10], it is not yet evident over land. For the recent historical period, between 1951 and 2005, in which atmospheric CO2 concentrations have increased by about 70 ppm, observed terrestrial precipitation shows changes between −7 and +2 mm per decade, with error bars ranging from 3–5 mm per decade [11]. In comparison, the models of the coupled model intercomparison project 5 (CMIP5) [12] simulate terrestrial precipitation changes for the period of 1930–2004 with values ranging between −4.2 and +1.2 mm per decade [13]. Due to the large uncertainty in the observations and the large inter-model range, it is difficult to make out a clear trend in terrestrial precipitation.
For projections under the representative concentration pathway 8.5 (RCP8.5) emission scenario, the CMIP5 models simulate global precipitation increases of 5%–11%, relative to present day, by 2100 [9]. The sign of this response is consistent with the predicted physically driven increase in atmospheric water vapour [10]. In contrast to the positive precipitation trends of all CMIP5 models, the University of Victoria Earth System Climate Model (UVic ESCM) in its standard configuration used by the Kiel group [14], simulates a negative global trend in future precipitation of −0.3% during this period if forced with the same CO2 emission scenario, but no other forcing [15] (see experimental set up and forcing). The negative trend can be traced back to the high CO2-sensitivity of plants in the UVic ESCM. In a 4xCO2, biogeochemically uncoupled, experiment (in which CO2 changes only affect the radiative forcing) the UVic ESCM shows a positive precipitation trend of roughly 2%  . However, the model reacts differently if the physiological response to CO2 is included. Under the RCP8.5 emissions scenario the model simulates a reduction of precipitation over land by 3.4%
  of global warming, which is only partly compensated by the physically driven increase of precipitation of 1.3%
  over the ocean [15].
The objective of the following analysis is to investigate how uncertainties in the CO2-sensitivity of transpiration affect simulations of a future climate. Transpiration contributes to three fundamental equations of state in the Earth system. The water mass transfer contributes to the hydrological cycle and the mass balance, the latent heat flux from transpiration is part of the energy budget, and due to the relationship to the carbon uptake of the terrestrial biosphere, transpiration indirectly influences the carbon cycle as well. In this study we want to assess how the uncertainty in the dynamical response of transpiration to increasing CO2 concentrations impacts these three components. Since terrestrial precipitation is an important climate variable and commonly used in other model intercomparisons, the emphasis of our sensitivity study lies in the evolution of simulated precipitation over land under simulated global warming. We will, in addition, investigate the consequences for simulated terrestrial transpirational cooling, water availability, and carbon exchange and storage.
2. Methods
2.1. General model set up
The model used in the following analysis is version 2.9 of the UVic ESCM, a climate model of intermediate complexity, with a horizontal resolution of 3.6° longitude × 1.8° latitude. It includes schemes for ocean physics based on the modular ocean model version 2 [16], ocean biogeochemistry [14], and a two-dimensional atmospheric energy moisture balance model including a thermodynamic sea ice model [17, 18]. The terrestrial component consists of simplified versions of the Meteorological Office surface exchange scheme (MOSES) and the top-down representation of interactive foliage and flora including dynamics (TRIFFID) vegetation model [19, 20]. The land surface scheme calculates surface albedo, runoff and evapotranspiration, which is a function of canopy resistance and based on the Penman–Monteith equation [21]. The vegetation scheme calculates the state of the terrestrial biosphere in terms of soil carbon, and the structure and coverage of bare soil or five plant functional types [20, 22]. Changes in vegetation biomass and distribution are driven by net carbon fluxes, which are derived for each vegetation type using the coupled photosynthesis stomatal conductance model [24].
2.2. Scaling methodology
In the UVic ESCM the leaf conductance of H2O (gw) is directly proportional to the leaf conductance of CO2 (gc) via their molecular diffusivities:

β accounts for different molecular diffusivities of water vapour and CO2. As in numerous other models [23], gc is directly proportional to the amount of carbon uptake by photosynthesis (P) and the gradient between the internal (CI) and ambient (CA) CO2 concentration

α is a unit conversion factor.
Since transpiration is an important parameter connecting the energy balance, water mass balance and the carbon cycle, the objective of the applied scaling was to investigate the relevance of changes in the CO2-sensitivity of transpiration to future climate projections.
The scaling could have been applied to both, the stomatal conductance of carbon and water vapour, which would have kept the molecular diffusivities consistent. In models, the effect of CO2 on photosynthesis and transpiration are highly parameterized and not well constrained by observations. The UVic ESCM underestimates the fertilization effect on photosynthesis over the historical period [25] and the transpiration response to CO2 appears to be larger compared to other models. Therefore, we decided to scale only the strength of gw relative to its preindustrial value, undoing the direct proportionality of CO2 and H2O stomatal conductance. Since we do not change the effect of CO2 on photosynthesis we keep the model's photosynthesis response closer to observations. Simultaneously, we manipulate the CO2-sensitivity of transpiration, in order to cover the wide range simulated by other models. While modifying only the transpiration response to CO2 may seem to make the model inconsistent in terms of stomatal conductance, it is a simple and clean way to separate the two different effects and allows us to manipulate plant WUE.
In order to vary the sensitivity of transpiration to increasing atmospheric CO2 concentrations, a scaling is applied to the ambient CO2 concentration, CA, used in calculating the stomatal conductance of water vapour.  can be scaled up or down, relative to preindustrial concentrations of 280 ppm (
 ), using a sensitivity factor, fsens:

This scaling is only applied to ambient CO2 used in calculating the leaf's conductivity to water vapour. The other equations used in the model, including those for photosynthesis continue to use the unaltered ambient CO2 concentration for all calculations.
For consistency, in the calculations for gw, a scaled version of the internal CO2 concentration ( ) is calculated by replacing the CA with
  . Note that the calculation itself was not altered.

Here C* is the canopy-level photorespiration compensatory point and F0 is the ratio of the internal to the ambient CO2 concentration for plants that are not water stressed. Plants are not water stressed if the canopy-level specific humidity deficit, Q, equals zero. The critical humidity deficit Qcrit and F0 are constant values depending on the plant functional type, m, their values are given in table 1. Both scaled CO2 concentrations,  and
and  , are used to calculate the leaf's conductivity with respect to water vapour:

In case CA is scaled down, plants will only feel a reduced increase in ambient CO2 and the difference between CA and CI would be reduced, causing the leaf conductivity for water vapour, and consequently transpiration, to increase. Note, that the scaling only affects the leaf conductance of H2O and not the leaf conductance of CO2 (figure 1). Consequently, the scaling alters the amount of transpirational water lost by the plant per unit of carbon uptake, so effectively the WUE.
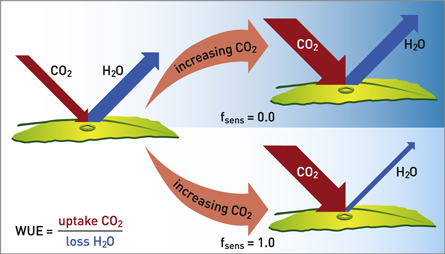
Figure 1. Illustration of the effect of different applied scaling factors for the cases of  (top) and
  (bottom).
Download figure:
Standard image High-resolution imageTable 1. List of parameters used in the calculations for the internal CO2 concentration, the leaf conductance of CO2 and water vapour. Given are descriptions or values of the parameter and their units.
| Parameter | Description/Value | Units |
|---|---|---|
| CA | Ambient canopy CO2 pressure | (Pa) |
| CI | Leafs internal CO2 pressure | (Pa) |
| fsens | {0.0; 0.2; 0.4; 0.6; 0.8; 1.0} | (1) |
| C* | Canopy-level photo-respiratory compensatory point | (mol m−3) |
| m | Plant functional types: broad leaf tree (BT); needle leaf tree (NT); C3 grass (C3); C4 grass (C4); shrub (S) | |

|
(0.875, 0.875, 0.900, 0.800, 0.900) | (1) |
| Q | Canopy level specific humidity deficit | (kg H2O/kg air) |

|
(0.090, 0.060, 0.100, 0.075, 0.100) | (kg H2O/kg air) |
| gc | Leaf conductance for CO2 | (m s−1) |
| gw | Leaf conductance for H2O | (m s−1) |
| P | Net leaf photosynthesis | (mol CO2 m−2 s−1) |
| α | Factor for converting mol m−3 into Pa | (J mol−1) |
| β | 1.6 | (1) |
2.3. Experimental set up and forcing
The UVic ESCM was spun up with seasonal, year 1800 forcing for over 10 000 years. Since the scaling is only applied to CO2 concentrations deviating from preindustrial, all sensitivity simulations started from the same initial preindustrial spin-up. All simulations were integrated for 500 years until 2300, using historical emissions followed by RCP8.5 and the extended concentration pathway 8.5 emissions scenario until 2250 [26]. Thereafter the atmospheric CO2 concentrations were held constant until 2300. For the following analyses yearly output was used. Continental ice sheets, volcanic forcing and astronomical boundary conditions were held constant to facilitate the experimental setting and analyses [14]. There was no land use forcing or burning applied, in order to investigate the systems' sensitivity in an unperturbed state.
Realizing that the UVic ESCM's sensitivity of transpiration to ambient CO2 is at the high end of current models [15] we decided to scale down its sensitivity. Hence, we implemented the scaling factor with values of  , allowing us to scale down the sensitivity of transpiration to increasing CO2 concentrations. This is expected to cause a relative increase in terrestrial evapotranspiration and precipitation compared to the default setting (
 ). In addition, for the comparison with the CMIP5 models three simulations following the CMIP5 forcing protocols were performed with values for
  . In the default simulations following the CMIP5 forcing protocols, terrestrial precipitation trends between 1961–1990 and 2071 and 2100 are higher by 20 mm yr−1 compared to the runs forced by CO2 only. This increase results in an overall positive global precipitation trend, and can be explained by the reduction in vegetation cover due to the implementation of land use changes.
3. Results
3.1. Simulated future precipitation patterns
The applied scaling has a strong impact on the spatial patterns of simulated future precipitation changes (figure 2). The default model ( ) simulates an increase in precipitation at higher latitudes between 50–80 °S and 50–80 °N, of about 50–200 mm yr−1 by the end of the century (figure 2(a)). At high latitudes, spatial patterns are relatively independent of the land-ocean distribution and hence zonally coherent. For the mid and low latitudes a distinction can be drawn between areas over land and ocean. Regions of strongly reduced future precipitation in the default simulation lie mainly over continental areas. The strongest simulated decrease occurs over Australia with end-of-the-century precipitation decreasing by up to 270 mm yr−1. In contrast, simulated precipitation increases by approximately 220 mm yr−1 over adjacent oceanic regions. Reducing the sensitivity of transpiration of plants towards higher CO2 concentrations by applying lower scaling factors, fsens, this pattern shifts to an increasing trend for precipitation values over tropical land areas, while oceanic and desert areas remain largely unchanged.

Figure 2. Maps of mean future precipitation changes. Changes in mm yr−1 are shown for the six scaling factors applied and were calculated between 1961–1990 and 2071–2100.
Download figure:
Standard image High-resolution imageAt high latitudes simulated future precipitation is independent of the applied scaling factor, fsens, indicating that these areas are less sensitive to variability in transpiration. In mid to low latitudes, the  model simulates increased future precipitation over all vegetated land areas relative to the default simulation. The largest increase in terrestrial precipitation of up to 500 mm yr−1 (increase by 60% relative to the
  simulation) is seen over the northern part of South America, Central Africa and Southeastern Asia. These areas are mainly covered by broad leaf trees in the UVic ESCM, corresponding to tropical rain forest or savannah.
3.2. Latitudinal and absolute trends of terrestrial future precipitation
When the scaled model simulations of the UVic ESCM are compared to the range of the CMIP5 simulations (figure 3(a), model details in supplementary table D), the general shape of the latitudinal changes in simulated precipitation is similar among the three sensitivity simulations in the extra-tropical regions. There is an increase of precipitation in the high latitudes and a decrease in the mid latitudes of both hemispheres. The latitude of transition between these two trends, however, depends on the applied scaling and varies between 45 °N for a scaling of  and 60 °N for the default simulation. The tropical latitudes reveal large differences between the differently scaled model simulations. Precipitation between 10 °N and 10 °S either increases by 400 mm yr−1 for the scenario, where transpiration is calculated with preindustrial CO2 levels, or it decreases by 90 mm yr−1 for the default sensitivity of transpiration to CO2 implemented in the UVic ESCM. Similar to the UVic ESCM, the CMIP5 models show consistent terrestrial precipitation trends in the extra-tropical latitudes, with a slightly more positive trend compared to the default UVic ESCM simulation. In the tropics, however, the different CMIP5 model results show an even wider range from −290 to 450 mm yr−1. This range of terrestrial tropical precipitation changes in the CMIP5 global warming simulations indicates the large uncertainty associated with this climate variable. It is remarkable that the range within the three scaled UVic ESCM model simulations covers almost the complete range of future tropical precipitation changes simulated by the CMIP5 models.

Figure 3. Comparison of precipitation trends to CMIP5. (a) Latitudinal dependency of mean annual accumulated terrestrial precipitation changes in mm yr−1 between 1961 and 1990 and 2071 and 2100 for three scaling factors implemented in the UVic ESCM (see legend). As a reference the grey lines show the results of the analyses from 18 CMIP5 models [29], the thick grey line gives the multi model mean (the same figure, but for the only CO2 forced simulations can be found in figure C1); (b) change in mean annual precipitation sums over land in mm yr−1 between 1961 and 1990 and 2071 and 2100 for the UVic ESCM depending on the different scaling factors applied (thick black line) and the 18 CMIP5 simulations (vertical lines, see legend and for details table 1) in [29].
Download figure:
Standard image High-resolution imageFor the global mean terrestrial precipitation changes (figure 3(b)) the UVic ESCM covers the complete range of the CMIP5 models by implementing different CO2-sensitivities of transpiration. Simulated changes in terrestrial precipitation range from −55 mm yr−1 for the default simulation to +128 mm yr−1 when the plants' transpiration is insensitive to increasing CO2 concentrations. In comparison all CMIP5 models show a positive trend in simulated terrestrial precipitation with a mean annual increase from 15 to 105 mm yr−1. The UVic ESCM's terrestrial precipitation trends seem to be more consistent with the CMIP5 models for the model configuration with applied low CO2-sensitivities of transpiration.
3.3. Transpirational cooling, terrestrial water availability, and carbon exchange
Latent heat flux is the flux of heat from the Earth's surface to the atmosphere, that is associated with evapotranspiration of water at the surface. An increase in transpiration, therefore would cool the land surface. Globally the land surface temperature is reduced by 0.3 K in 2100 in case of a higher transpiration in the  simulation relative to the
  simulation. This amounts to local cooling of the soil temperature in the tropical regions of up to 1.3 K (figure B1).
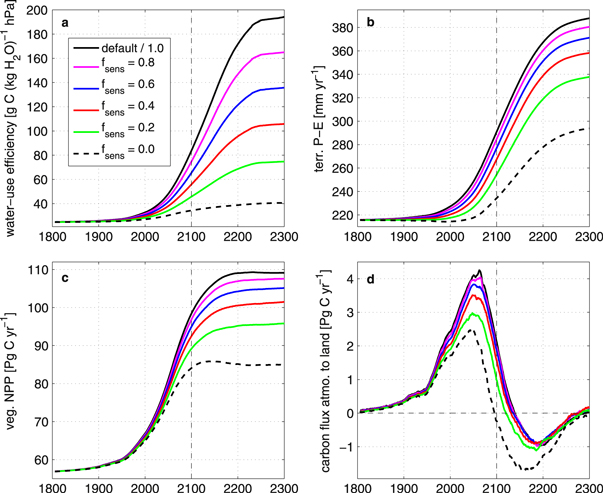
The scaling of the CO2-sensitivity of transpiration also influences the simulated vegetation and the corresponding carbon fluxes. The carbon response is driven by the photosynthetic response and the transpiration response. As plants become more water stressed, due to a higher rate of transpiration, they open their stomata less often. This affects how much carbon can be taken up. More carbon is taken up in simulations with less transpiration, because stomata can stay open longer, allowing for more photosynthesis for the same amount of water loss. This increases the plant's WUE (figure 4(a), calculation of the WUE in supplementary material A). In our analysis there is an increase of the WUE for all simulations, with the strongest increase evident for the default simulation, in which transpiration is strongly reduced and the NPP has the largest increase. However, as expected, the increase in the WUE for the  simulation is much lower compared to the default model and is mainly driven by increased carbon uptake, rather than by reduced transpiration.
Figure 4. Temporal development of parameters relevant to the vegetation system. Time series of water-use efficiency (a), terrestrial precipitation minus evapotranspiration (b), vegetation net primary production (c), and carbon flux from atmosphere to land (d), for the default simulation and the scaling factors applied.
Download figure:
Standard image High-resolution image
A lower WUE, as for the  simulation, makes it more likely for the plant to become water stressed. The reduced evapotranspiration also influences the terrestrial water availability, the residual of precipitation and evapotranspiration on land, P–E, (figure 4(b)). Under a high emission scenario, the default UVic ESCM simulates a decrease in terrestrial evapotranspiration of 8.7%
  , which is higher than the rate of decrease in precipitation over land, resulting in an overall increase in the terrestrial water availability. For all scaling factors the global average terrestrial water availability still increases with time. However for the simulation, in which transpiration is insensitive to CO2, P–E is reduced by 20% relative to the default simulation in 2100. This reduction in terrestrial water availability relative to the default simulation leads to a relatively higher plants' water stress level for the
  simulation. Correspondingly, the expected future increase in terrestrial net primary productivity, and hence total vegetation carbon, is reduced if transpiration is less sensitive to CO2 (figure 4(c)). The total terrestrial carbon pool consists of vegetation and soil carbon. An increase in net biological primary production causes an increase in the terrestrial pool, while an increase in soil respiration causes a decrease in terrestrial carbon storage. On longer time scales, soil respiration mainly depends on the soil carbon pool, which is decreased by the scaling relative to the default simulation.
The resulting carbon fluxes between atmosphere and land show that the terrestrial system remains a sink for atmospheric carbon until 2100 for all applied scaling factors (figure 4(d)). The simulated transition from a land carbon sink to a source, happens earlier for lower CO2 sensitivities than for higher ones. Simulated future carbon uptake by the terrestrial system varies from 1.68 to 3.44 Pg C yr−1 over this century, depending on the applied CO2-sensitivities, with a reduced uptake for lower CO2-sensitivities of transpiration.
4. Discussion and conclusion
In a series of sensitivity experiments, we scaled the CO2-sensitivity of transpiration under the RCP8.5 emission scenario in an Earth System Model, in order to investigate the relevance of dynamical changes in this process for climate change predictions. We found that, varying the strength of the CO2-sensitivity of transpiration caused simulated terrestrial precipitation to range from a decrease of 10% to an increase of 27% by the end of the century, compared to today's simulated precipitation. The scaling enables the UVic ESCM to cover the full range of CMIP5 models' precipitation changes over land. The range of global precipitation changes of the UVic ESCM with different scaling factors applied and following the CMIP5 RCP8.5 forcing varies from 0.6% to 7.4% increase in precipitation relative to 1988–2005, which is at the lower end of the CMIP5 models range of 5%–11.5% [9].
Locally, precipitation in the UVic ESCM in the tropics is more sensitive to differences in CO2-driven transpiration compared to higher latitudes. Observations of tropical tree growth rings suggest no growth stimulation from an increasing atmospheric CO2 concentration, but an increase in the ecosystem WUE by 30%–35% in the last 150 years [27], indicating a reduction in transpiration and an associated reduced recycling of precipitation. In the UVic ESCM the local differences amount to decreased global terrestrial precipitation by up to 60% in the  relative to the
  simulation in 2100. This is in line with a study investigating the strength of the CO2-physiological effect, i.e. the effect of stomata closing, with the National Centre for Atmospheric Research Community model [28]. Under high atmospheric CO2 concentrations, they found that the CO2-physiological effect reduced the precipitable water by 40% compared to the amount that would be available without this effect. The CMIP5 models display a larger inter-model variance in simulated future precipitation changes in the tropics [30]. Assessing the uncertainty in the transpiration fluxes might improve the models agreement and the overall performance in this region.
A reduction in transpiration due to an increase in WUE would act to warm the land surface due to a reduced evaporative cooling. In our simulations local temperature differences between the  and the default simulation, are as high as 1.3 K in the year 2100, where the default simulation has higher temperatures, due to reduced transpiration. A similar result was found in the study investigating the strength of the CO2-physiological effect with the National Centre for Atmospheric Research Community Model [28], where 11% of the simulated land surface warming was caused by closing stomata.
Transpiration couples the hydrological cycle with the carbon cycle. An increase in transpiration relative to the default simulation is likely to cause a higher water stress level, reducing terrestrial net primary production and hence terrestrial carbon uptake. Changes in the terrestrial carbon pool of the UVic ESCM with different scalings applied and following the CMIP5 forcing protocols, range between −86 and +43 Pg C until 2100, with the largest uptake found in the default simulation. The total change in the terrestrial carbon pool for nine CMIP5 Earth system models until 2100 varies between −120 and +500 Pg C [30]. These uncertainties in terrestrial carbon uptake influences predictions about atmospheric carbon content and hence climate forecasts.
Transpiration is not only sensitive to atmospheric CO2, but is also influenced by other environmental factors that were not specifically addressed in this study. To correctly model transpiration any vegetation model needs to be forced with either real data or realistically simulated factors such as the amount of incoming solar radiation at the leaf level, soil and air temperatures, relative humidity, water vapour deficit, soil moisture, nutrients, root extent, leaf area index, and other environmental factors such as weather fluctuations and extremes [1]. Factors such as the plants life history and health may also be important. Which of these factors is most important in determining the amount of transpiration, strongly depends on the environmental conditions. For example, a good representation of roots and soil moisture is important in tropical rain forests as well as in arid and semiarid regions, where the amount of transpiration at a forested site during a drought year has been found to be higher than the water available from precipitation because trees were able to access ground water reservoirs [29]. Also of importance in these regions are the frequency and strength of rain events, because they determine the water availability in the soils. In contrast to this, a good representation of roots and soil moisture becomes less important in wetlands or peatlands, where evapotranspiration is closely related to the potential evaporation estimate from the Penman equation [1]. Here factors such as the water vapour pressure deficit, incoming solar radiation, and temperature become more important in determining the transpiration rates.
The UVic ESCM has simplified representations of both the atmosphere and land surface. These simplifications affect transpiration rate estimates, due to the lack of weather fluctuations and corresponding dry or wet spells. The idealized prescribed seasonal cloud coverage in the UVic ESCM also prevents cloud feedbacks, which would affect the amount of incoming solar radiation, to occur during wet or dry events. The lack of weather fluctuations likely has a strong influence on terrestrial productivity. In addition, the UVic ESCM land surface scheme is a one-layer soil model, which integrates the energy and moisture balance at the surface. The lack of a vertical soil moisture profile, could lead to an over- or under-estimation of the surface water availability and thus also effect transpiration. Despite these simplifications the model does a reasonable job of simulating annual present-day vegetation distributions, surface temperatures, and precipitation and evapotranspiration [22].
Our results illustrate the substantial sensitivity of one intermediate-complexity Earth System Model, the UVic ESCM, towards the CO2-sensitivity of the plants' leaf conductance of water vapour. While there is disagreement on the future development of the terrestrial system among different CMIP5 models [30, 31], it is currently unknown how much of this disagreement arises from the uncertainty in stomatal behaviour.
As a previous model study pointed out [28], the strength of the stomata closing with increasing atmospheric CO2 will strongly influence the water available for precipitation in simulated future climates. An observation-based study [5] identified the need for a better understanding of the role of stomata in regulating land atmosphere interactions. These findings are in line with our model results showing that the future development of the simulated atmosphere-to-land carbon fluxes and the terrestrial part of the hydrological cycle are uncertain, even within the context of a single model, as long as the stomatal conductivity's CO2-sensitivity cannot be better constrained by observations. An assessment of the dynamical response of transpiration is needed, since it is a relevant process and needs to be considered in projections of future climate.
Acknowledgments
We thank A Ahlström for providing the CMIP5 model output used in figure 3, and our graphic designer Rita Erven for designing figure 1 from the draft of the authors. This work was funded by the DFG in the context of the Priority Program Climate Engineering: Risks, Challenges, Opportunities? (SPP 1689). The authors declare that they have no competing financial interests. AO, ME and DPK conceived and designed the experiments. NM implemented and performed the experiments and analysed the data. NM wrote the manuscript with contributions from DPK, ME and AO. We would like to thank our anonymous reviewers for the helpful and constructive comments, and the editorial staff for their efforts.