


Abstract
We present an updated version of the radiosonde dataset homogenized by Iterative Universal Kriging (IUKv2), now extended through February 2013, following the method used in the original version (Sherwood et al 2008 Robust tropospheric warming revealed by iteratively homogenized radiosonde data J. Clim. 21 5336–52). This method, in effect, performs a multiple linear regression of the data onto a structural model that includes both natural variability, trends, and time-changing instrument biases, thereby avoiding estimation biases inherent in traditional homogenization methods. One modification now enables homogenized winds to be provided for the first time. This, and several other small modifications made to the original method sometimes affect results at individual stations, but do not strongly affect broad-scale temperature trends. Temperature trends in the updated data show three noteworthy features. First, tropical warming is equally strong over both the 1959–2012 and 1979–2012 periods, increasing smoothly and almost moist-adiabatically from the surface (where it is roughly 0.14 K/decade) to 300 hPa (where it is about 0.25 K/decade over both periods), a pattern very close to that in climate model predictions. This contradicts suggestions that atmospheric warming has slowed in recent decades or that it has not kept up with that at the surface. Second, as shown in previous studies, tropospheric warming does not reach quite as high in the tropics and subtropics as predicted in typical models. Third, cooling has slackened in the stratosphere such that linear trends since 1979 are about half as strong as reported earlier for shorter periods. Wind trends over the period 1979–2012 confirm a strengthening, lifting and poleward shift of both subtropical westerly jets; the Northern one shows more displacement and the southern more intensification, but these details appear sensitive to the time period analysed. There is also a trend toward more easterly winds in the middle and upper troposphere of the deep tropics.
Export citation and abstract BibTeX RIS

Content from this work may be used under the terms of the Creative Commons Attribution 3.0 licence. Any further distribution of this work must maintain attribution to the author(s) and the title of the work, journal citation and DOI.
1. Introduction
Earth's surface warmed by nearly a degree over the last century (Hartmann and Coauthors 2013). Observational records of atmospheric temperature in recent decades, however, have often failed to show the atmospheric signature expected from this warming. In particular many have not shown the local maximum of warming rate in the tropical upper troposphere (near 11–13 km) predicted by climate models and indeed expected on the basis of thermodynamic arguments fundamental to tropical meteorology (Agudelo and Curry 2004, Santer et al 2005, Mitchell et al 2013).
The traditional platform for resolving vertical variations in atmospheric temperature change is the radiosonde. The vertical profile of warming from these varies significantly however, especially in the tropics, depending on how artificial changes are identified and removed from the record (Thorne et al 2010, Seidel et al 2012) and has been shown to suffer from artificial drifts due to solar heating of sensors (Sherwood et al 2005). Early analyses of such data generally showed too little upper-level warming (CCSP 2006), although a couple of more recent records have come closer to the expected amplification albeit with somewhat less than expected warming (Sherwood et al 2008, Haimberger et al 2012). An attempt to reconstruct tropical warming profiles indirectly from changes in wind also found a maximum in the tropical upper troposphere since the 1970s (Allen and Sherwood 2008). Thus the picture from radiosondes remains somewhat unclear, although there are signs that improved records are showing warming close to expectations.
Satellite sounders available since 1979 can provide some constraint on the vertical variation of warming, but only in the form of broad weighted averages that span much of the troposphere and/or stratosphere. These data have been interpreted as indicating too little warming trend in the upper compared to the lower troposphere (Fu et al 2011, Po-Chedley and Fu 2012) and one satellite product shows less warming in the atmosphere than at the surface (Christy et al 2010). Caution is warranted however because the satellites suffer from uncertain changes over time in calibration and other inhomogeneities, exacerbated by the manipulations of the data necessary to extract the signals of concern here (CCSP 2006). Another problem is that warming trends in the upper troposphere are easily corrupted by the much larger cooling trends in the lower stratosphere (Fu et al 2004), the profile of which varies significantly among different observational records (Sherwood et al 2008); indeed Fu et al (2004) and Fu and Johanson (2005) concluded that MSU-observed tropical warming was consistent with a moist-adiabatic change profile. Meanwhile MSU products targeting the lower troposphere are strongly affected by the surface, which may warm differently. Recent findings suggest that overall global warming rates in the troposphere have been too weak in some previous studies due to characterization of the diurnal cycle and imprecise corrections for calibration errors (Po-Chedley et al 2015). This suggests that the stronger warming in the upper troposphere shown by some recent radiosonde datasets may indeed be correct. More independently generated datasets are needed to verify whether the stronger warming shown by some is correct, and to extend these from 1959 through to recent times.
The original IUK dataset (Sherwood et al 2008) extended only through 2005. Here we present changes over time from an extension of this dataset through February 2013. These results confirm those of the other newer studies, suggesting that tropospheric warming has indeed proceeded as expected in spite of the problems that earlier studies have had in detecting it.
2. Data and approach
This new radiosonde dataset Iterative Universal Kriging (IUKv2) was produced via a process of IUKv2, using the same methodology as an earlier version (Sherwood et al 2008, hereafter S08) with a few modifications. The methodology statistically corrects for incomplete sampling and step changes in bias arising from changed instrumentation or observing practises. It does this by, in effect, performing a multiple regression of the available data onto a structural model that allows simultaneously for natural and artificial changes. This preserves trends and slow variations at individual stations in an unbiased way given the structural model, a property that is essential for obtaining global trends but not yet demonstrated for other approaches that have been used (Sherwood 2007). Raw data are from the Integrated Global Radiosonde Archive (IGRA), www.ncdc.noaa.gov/oa/climate/igra/.
2.1. Review of IUK method
The method first identifies change points from individual station data, then simultaneously imputes missing observations and calculates shift amplitudes in a large network of stations given the times of change points. The detection of change points at a station was done in three stages: first on the basis of day–night difference time series, then on the basis of diurnally homogeneous time series, then finally on the basis of residuals from the initial data fit. The last step was primarily to help with stations reporting only once per day, where the powerful technique of detecting change points via the impact on diurnal heating of the sensor could not be employed. Two different change-point detection algorithms were used and the final results using each of them were averaged, with the spread used as one measure of uncertainty.
Though data were subsequently averaged into monthly means for analysis, homogenization and imputation of missing values was carried out on twice-daily data. The IUK method used was based on the EM, or expectation-maximization algorithm, which iteratively imputes missing data and refits a structural model. Alternating between these two steps gradually converges toward the maximum-likelihood values of model parameters given the available data and the model structure. The model used can be written

where Z is one of the three target variables (temperature, zonal or meridional wind shear) at a given station and pressure level. P, F and H are basis functions of time, the same for all three target variables and all stations. a, b and c are loading coefficients determined independently for variable, station, and level via linear regression. The Pi are ith order polynomials, representing the trend in the data; only the first (linear, i = 1) component was retained in S08. The Fj(t) are the principle components of the jth empirical orthogonal functions of all station data at the given pressure level, representing the large-scale natural variability. H is the Heaviside step function with tk the time of the kth change point at the station, representing the effects of level shifts (tk vary by station and by variable). The final term  represents small-scale natural variability and noise, modelled as a Gaussian random process whose variance is minimized by the model fit. Missing observations are imputed by Kriging
  (in space and time) and evaluating the other terms at the missing times, after which the model is refitted, until convergence. Regression of data onto the above equation ensures that variations in the data will be interpreted either as natural variability, forced trends or artefacts depending on which they most closely resemble.
This procedure makes use of information on natural variability from neighbouring stations, but is designed to isolate systematic/trend errors; this is fully successful only if change point times are fully known, but even with partial knowledge, this approach improves on other tradiational ones which tend to spread systematic errors from one station to another (Sherwood 2007). Resulting trends have relatively large random errors at individual stations, but these errors are more independent, enabling the uncertainty of an average trend over many stations to be readily assessed by standard methods (e.g., standard error). Note also that wind data are used to better identify natural variations that could affect temperature (and vice versa) but are not used directly (e.g., via thermal-wind balance) to constrain temperature, thus trends obtained here are independent of those obtained by that approach. Readers are addressed to S08 and references therein for more details.
2.2. Modifications for this study
Several modifications have been made for IUKv2.
First, we found and corrected two minor bugs affecting how data were smoothed before computing EOFs. Fortunately this had very little impact on results.
Second, we include two pressure levels (700 and 400 hPa) that were omitted in the original dataset. The reason they were omitted before was to give equal weight to the troposphere and stratosphere in detecting change points; here, we omit these levels only during change-point detection, while still including them subsequently. Multi-level changes points detected from the other levels are also assumed to exist at these two levels.
Third, we no longer carry out the third step of change-point detection nor provide data for stations reporting only once per day. This is because the homogenization of these stations was judged to be unreliable, and they were typically not used. The original study found that the final step and associated round of homogenization did not have a significant effect on the results at twice-daily stations.
Fourth, we now include the vector wind  rather than the wind shear
  The choice by S08 to use shear was motivated by the local thermal-wind relationship between wind shear and horizontal temperature gradients. However the vector wind itself will statistically carry much of the same information, and should be less noisy; using this also has the significant advantage of producing a homogenized wind dataset (as opposed to a shear dataset which was not very useful). While one previous examination of wind data found no evidence of spurious trends due to instrument artefacts (Gruber and Haimberger 2008), the large amount of missing wind data means that our IUK approach will also add value by infilling missing data intelligently and allowing more stations to be utilized.
Fifth and finally, we have expanded the trend basis to include three terms (third-order polynomial) rather than one, since forced trends are not necessarily linear. This should ensure that the 2nd and 3rd order polynomial component amplitudes in the homogenized data will also be unbiased. S08 dealt with the issue crudely by performing separate homogenizations on two different time periods of interest, but here we perform only a single homogenization over the whole record.
The above modifications had only small effects on large-scale trends (see below), but sometimes produced noticeable effects at individual stations. The most important such effects came from adding nonlinear terms to the trend basis. In the linear-only version, station trends 1979–1998 were unexpectedly well correlated with those post-1998 (e.g., r = 0.90 at 300 hPa among Tropical stations), dominated by stations with poor temporal data coverage or many change points whose trends are poorly constrained. This suggests that records were artificially flattened by the fitting procedure. Using 3rd-order polynomials alleviated this problem, reducing the above correlation to r = 0.25. This gives us confidence in changes over periods of a decade or two, and not just those over the whole record.
Overall, the data show similar characteristics to those of the original version. The number of change points detected as a function of time was nearly the same pre-2005 as found by S08, as expected, in both cases peaking in the late 1980s and decreasing thereafter. Post-2005, we detect fewer change points, on average roughly half as many per year as detected pre-2005. This suggests that changes in observing practise have become less common in the last decade.
3. Updated trend results
3.1. Temperature
The chief value of such records is in the more accurate estimation of long-term changes, of which the simplest characterization is the linear trend. The estimated temperature trend versus latitude and height (figure 1) is somewhat noisy since each latitude band is based on a different and independent set of stations, but its features are clearer and somewhat stronger than those shown in S08. A maximum can be seen in the tropical upper troposphere in every latitude band from about 30S–20N, centred near 300 hPa. Because the trend reliability varies significantly among stations (with very scattered results in particular for stations in India), we follow S08 in taking the median of stations in latitude bands, although results are not highly sensitive to this choice.

Figure 1. Temperature trend 1960–2012 versus latitude and pressure. The value for each latitude and pressure is the medians of the trends at individual stations in that (10°) latitude bin. Units are °C per decade.
Download figure:
Standard image High-resolution imageThe vertical profile of tropical warming (figure 2) is not very sensitive to our design changes, especially in the troposphere, although in the stratosphere it appears more realistic using wind than using shear. It varies quite smoothly with height, more so than in S08 or other published trend results, and is slightly stronger than shown in the original study. The increase in warming with height is close to a moist adiabat up until 300 hPa but then begins to fall sharply below it, a pattern qualitatively similar to that predicted in models (Santer et al 2005). If confined to 20S–20N the trends appear somewhat weaker; however, warming trends measured by satellite and predicted by models are both very similar within the 20–30 band as equatorward of it (Sherwood et al 2008) so this difference is not real but reflects varying errors in the radiosonde network. The tropospheric warming distribution shown here for 20S–20N is close to that reported for this latitude range in the 'RICH' radiosonde dataset (Haimberger et al 2012) which uses reanalysis data to help locate change points.
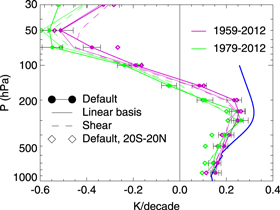
Figure 2. Tropical (30S–30N) temperature trend versus height and its sensitivity to method changes since S08. Colors show two time periods, and line types distinguish standard calculation, that with linear basis as in S08, that with wind shear as in S08, and that with a narrower definition of the tropics. Values are first obtained by latitude bin as in figure 1, then averaged across latitudes. Error bars are two-sigma, based on the spread among contributing stations. Blue curve shows pseudoadiabatic warming given a fixed 70% relative humidity at 1000 hPa (including the additional latent heat of freezing for  C).
C).
Download figure:
Standard image High-resolution imageAs seen in previous radiosonde analyses, there is strong cooling in the stratosphere, maximizing in the Antarctic and minimizing in the Arctic (figure 1), as expected from the effects of ozone depletion and carbon dioxide increase. The zero crossing from warming to cooling occurs near 150 hPa in the tropics and 300 hPa near the poles, which in both cases is near the (summertime) tropopause. The cooling rate shown here, roughly −0.55 K/decade at 50 hPa and in agreement with Haimberger et al (2012), is much less than shown in S08 for the 1979–2005 period (−1.1 K/decade). This is because stratospheric cooling leveled off in the tropics (and the Northern hemisphere) around 2000 (see figure 4); the tropical stratosphere warmed by roughly 0.5 K over 2005–2012. This may represent natural variability or a response to ozone recovery, and merits further investigation.
The ratio of warming at 300 hPa to that at 850 or 700 hPa in the tropics is 1.8 ± 0.4, consistent with the average value of 1.64 from climate models (Seidel et al 2012) if we use data from 30S–30N since 1979. In the model average this value is the same at 200 and 300 hPa, but most previous radiosonde datasets show no warming at 200 hPa (Seidel et al 2012). Our data do show warming at this higher level, but it is only 0.6 ± 0.5 times the 700 hPa value, stronger than in previous studies but significantly less than the model average 1.64x. Thus our data indicate that the upper-tropospheric warming since 1979 began transitioning to stratospheric cooling at a lower altitude (by about 1–2 km) in nature than in a typical climate model.
The time evolution of average temperature in the troposphere (from roughly 1.5–14 km) in each of three latitude bands agrees closely with those of the Hadley Centre-Climate Research Unit Temperature Version 4 (HadCRUT4) surface record (Morice et al 2012), both in terms of overall warming trend and year-to-year variation (figure 3) supporting the accuracy of the estimates at least on large scales. Atmospheric warming is slightly slower than surface warming in the extratropical bands, but faster in the tropics, as expected. The southern extratropics warmed rapidly from 1960 up until the late 1970s but more slowly after that, while the Northern extratropics warmed only after the mid−1970s; these features are similar in the troposphere and surface data. Interestingly, tropical warming appears steadier in the troposphere than at the surface, and did not slow after 1998 despite slower warming in the surface record. This is the main reason why the trends are now slightly stronger than those shown in S08.
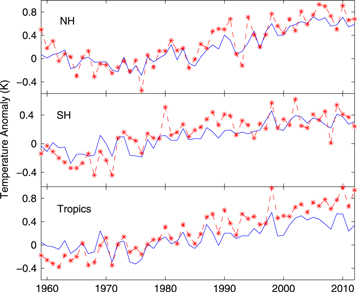
Figure 3. Time evolution of temperature in three latitude bands. (Symbols) troposphere (simple mean of mandatory levels from 850 to 300 hPa inclusive) averaged over 'good' stations in three latitude bands, separated by 30S and 30N latitude boundaries. (Line) mean surface temperature from the HadCRUT4 (Morice et al 2012) dataset. 'Good' stations are defined as those whose temperature trend (1958–2012) is no more than two standard deviations away from the median for stations in that latitude band.
Download figure:
Standard image High-resolution image
Figure 4. Time evolution of temperature in the lower stratosphere (50 hPa), averaged as in figure 3.
Download figure:
Standard image High-resolution image3.2. Wind
Wind data are relatively sparse prior to the 1970s (see Allen and Sherwood 2008), thus trends prior to this period from any radiosonde analysis will likely be unreliable. Also, changes in meridional wind vary substantially in the zonal direction such that changes in the residual circulation would be very hard to estimate with the available station network. Here we limit our presentation to trends in zonal wind since 1979, which are shown in zonal and annual average in figure 5.

Figure 5. Zonal wind mean and trend 1979–2012 versus latitude and pressure, computed as for figure 1. Coloring shows the trend (units m s−1 per decade); black contours show the mean (units m s−1). Regions where 1-sigma uncertainty exceeds 0.33 or 0.67 m s−1 per decade are marked by a small or large X, respectively.
Download figure:
Standard image High-resolution image
Results show acceleration of the Austral polar jet by up to 2.0 m s−1 though trends this far south should be treated with caution due to the small number of stations. Both subtropical jets have accelerated by ∼1 m s−1 and have lifted and shifted poleward, particularly the Northern jet. The equatorial middle and upper troposphere shows a shift toward more easterly winds, including at the equatorial flanks of both subtropical jets consistent with a poleward shift. The implied poleward expansion of the tropics is of order one or two degrees latitude in either hemisphere over the 33 year period, roughly consistent with estimates based on other types of data (Lucas et al 2014). Near the surface the only significant signal seen is a strengthening (with no evident shift) of the westerlies near 50S, in agreement with the reanalysis-based findings of Swart and Fyfe (2012), though sampling at these latitudes is poor.
These trend results resemble those of Allen and Sherwood (2008) for the period 1979–2005, but with some differences. In particular, the earlier study's subtropical-jet-related trends showed some extension down to the surface, and imply more tropical expansion than shown here. Trends computed from the IUKv2 data for the shorter period (see supplemental figure available at stacks.iop.org/erl/10/054007/mmedia) confirm that these differences are due to time period, implying that tropical expansion may have weakened in recent years. The earlier study also reported somewhat weaker intensification of the southern subtropical jet, but stronger intensification of tropospheric westerlies at 50S and stratospheric westerlies near 30N; these differences appear to be due to the analysis/homogenization method rather than the time period.
4. Conclusion
We have briefly described an update of the dataset published by Sherwood et al (2008), which brings the data to February 2013. Several modifications have been introduced, which have not had a large effect on estimated long-term trends in temperature but have enabled us to present a homogenized wind dataset in addition to that for temperature.
The warming patterns shown in the revised dataset are similar to those shown in the original study except that expected patterns now appear somewhat more clearly. These include a near-moist-adiabatic profile of tropical warming with a peak warming rate of 0.25–0.3 K/decade near 300 hPa since either 1959 or 1979. This is interesting given that (a) many studies have reported less-than-expected tropospheric warming, and (b) there has been a slowing of ocean surface warming in the last 15 years in the tropics. We support the findings of other recent studies (Po-Chedley et al 2015) that reports of weak tropospheric warming have likely been due to flaws in calibration and other problems and that warming patterns have proceeded in the way expected from models. Moreover our data do not show any slowdown of tropical atmospheric warming since 1998/99, an interesting finding that deserves further scrutiny using other datasets.
As with other efforts to homogenize radiosonde data, results here may be affected by sampling limitations and inhomogeneities not successfully removed. However, we argue that our approach is well suited for producing a dataset to examine trends. The approach has been shown (Sherwood 2007) to produce individual data records with larger random errors, but which are unique in avoiding some sources of systematic bias as a feature of the method design, and in avoiding some problems common to other methods that will introduce correlated errors in the trends at neighbouring stations. This feature makes the characterization of trend uncertainty in averages over large regions more reliable.
The data presented here (v2.01) may be freely downloaded from the lead author's website1 The authors hope to produce periodic updates to the dataset in the future, following the same procedure documented here.
Acknowledgments
We acknowledge the NOAA Satellite and Information Service and National Climate Data Center for providing the IGRA radiosonde data on which this study is based, as well as the UK Met Office, NASA, and The University of California for supplying surface data. This study was supported by a UNSW Goldstar grant. We thank Lisa Alexander for assistance with surface data and helpful discussions.