

Abstract
In this study, we examine a supply-chain approach to more effectively mitigate primary PM2.5 emissions in China from the perspectives of production, consumption and their linkages using structural path analysis. We identify the pattern of all supply chain paths using principal component analysis. To address the severe haze problems in China, it is important to understand how final demand purchase initiates production processes and ultimately leads to primary PM2.5 emission. We found that consumers' demands on power and transportation mainly induce direct emissions, quite different from the demands on construction, industry and service products which largely drive emissions in upstream activities. We also found that nearly 80% of the economic sectors in China follow a similar pattern in generating primary PM2.5 emissions in electricity, cement and the ferrous metal industries; but only the construction sector increases the release of PM2.5 due to the production of non-metallic mineral products. These findings indicate that further reduction of end-of-pipe emissions in the power and transportation sectors will facilitate cleaner production in almost all the economic sectors. However, for urbanization induced emissions, China should mitigate PM2.5 emissions through the supply chain of construction, either severely reducing its life-cycle intensity or carefully planning to avoid extensive, unnecessary building activity.
Export citation and abstract BibTeX RIS

Content from this work may be used under the terms of the Creative Commons Attribution 3.0 licence. Any further distribution of this work must maintain attribution to the author(s) and the title of the work, journal citation and DOI.
1. Introduction
Ambient particulate matter with an aerodynamic diameter of 2.5 μm or less (PM2.5) affects visibility (Menon et al 2002, Huang et al 2006), the climate (Huang et al 2007, Bond et al 2013) and human health (Delfino et al 2005, Timonen et al 2005), creating the need to better understand the sources of PM2.5 and to effectively mitigate them.
Ambient PM2.5 originates from the incomplete combustion of fossil fuel or biofuel, oxidation of precursor gases such as SO2 and VOCs, and natural emissions from biomass burning and dust mobilization (Stevens and Boucher 2012, Wang et al 2012, Bond et al 2013). Due to rapid industrialization, anthropogenic PM2.5 emissions in China have increased by nearly 40% during the past decade, and are mainly generated by power and cement production from the production perspective (Timonen et al 2005, Lei et al 2011). However, from the consumption point of view (i.e., the life cycle emissions of goods and services attributed to consumers), this rapid increase of PM2.5 emissions is mainly driven by the expansion of construction and metal/machinery industries (Guan et al 2014, Huo et al 2014, Lin et al 2014). Previous studies have quantifies the discrepancy between production-based and consumption-based air pollution inventories in China (Huo et al 2014, Zhao et al 2014, Jiang et al 2015). Thus, revealing the PM2.5 emissions along the supply chain path can facilitate understanding how PM2.5 emissions 'flow' from producers to consumers (Skelton et al 2011).
One way to trace the complex supply chain of the production process initiated by a given final demand is based on structural path analysis (SPA; Defourny and Thorbecke 1984, Skelton et al 2011). By using SPA, it is possible to follow the production network from final demand through the domestic production processes and, finally, extract the critical paths that drive dominant life-cycle emissions (Lenzen 2002, Peters and Hertwich 2006a, Peters and Hertwich 2006b, Lenzen et al 2012, Oshita 2012, Kanemoto et al 2014). Supply chain analysis has become an important tool in addressing these questions (Schmidt 2008a, 2008b, Skelton et al 2011). There is still a lag in relation to knowledge concerning the supply chain of PM2.5 emissions (Hoekstra and Wiedmann 2014, O'Rourke 2014), despite the merit and appeal of SPA.
In this study, we construct China's primary PM2.5 emission inventories in 2007 from both production and consumption perspectives and use SPA to identify the associated linkages. The SPA is applied using an input–output model for the Chinese economy. Furthermore, when performing the system input–output analysis (Chen et al 2007, Chen et al 2010, Zhang et al 2013), the embodied emission intensity, defined as total direct and indirect emissions released along the whole supply chain in order to generate unit monetary output, can be decomposed into a spectrum of embodied intensity contributions (EICs) from all sectors. Comparing the similarity of EIC spectrums between different sectors will help to understand the pattern of all supply chain paths that drive PM2.5 emissions. To address this issue, we adopt principal component analysis (PCA) to identify the major features of the composition and the underlying pattern of the embodied PM2.5 intensities.
2. Methods
2.1. Primary PM2.5 emissions
Primary PM2.5 emissions, also termed production-based emissions, denote the direct emissions from specific production activity. In this study, we construct China's primary PM2.5 emissions with sufficient sectoral detail for China in the year (2007) based on China's official energy use statistics. The sources of PM2.5 are classified into three categories according to the mechanisms that generate PM2.5, namely, stationary combustion, industrial processes and mobile sources (open field biomass burnings, such as wild fires and agricultural waste burning, are not included). The stationary combustion sources cover all economic sectors except transportation (i.e., the mobile source) and include nine types of fuel use (coal, coke, kerosene, diesel, crude oil, gasoline, fuel oil, natural gas and other petroleum products). Due to the lack of sectoral information on biofuel consumption (i.e., mostly used for residential cooking and heating, accounting for less than 25% of China's anthropogenic PM2.5 emission (Lei et al 2011), emissions from biofuel use are not included in this study. The industrial process sources cover 15 products/processes in metallurgical industries, chemical industries and non-metallic mineral production, among which cement production and steel production are most important contributors.
For sources from stationary combustion and industrial processes, PM2.5 emissions are calculated based on the activity rate (energy consumption or material production), technology distribution, unabated emission factor (EF) and the penetration of emission control technologies, as well as the removal efficiency of these technologies (Klimont et al 2002, Zhang et al 2007, Lei et al 2011). Therefore, the PM2.5 emission from Sector j (Ej) is estimated as:


where k is either fuel or product type; A is the activity rate; Xm is the share of fuel or production processed by a specific technology m ( in Sector j; F is the effective EF after adjustment by emission control devices, whereas f represents the mass fraction of PM2.5 relative to TSP; FTSP stands for the unabated EF of TSP before emission control; Cn represents the penetration of PM control technology n (i.e.,
 represents the removal efficiency of control technology n.
In this study, the energy consumption and industrial product data are acquired from the China Statistic Yearbook CSY (2009). The coverage of combustion and processing technology in each sector is collected from a variety of China's statistics compiled by various industrial associations and technology reports (SEPA 1996, Lei et al 2011, Zhang et al 2000, Zhang et al 2006). The EFs adopted for stationary combustion and industrial processes are described in table 1.
Table 1. Unabated EF for PM2.5 from stationary combustion and industrial processes.
| Category | Fuel/product | Technology | EF |
|---|---|---|---|
| Industry (g kg−1) | Coal | fluidized bed | 1.89–5.40 (Zhang 2006) |
| Diesel fuel | 0.50 (USEPA 1995) | ||
| Kerosene | 0.90 (USEPA 1995) | ||
| fuel oil | 0.67 (USEPA 1995) | ||
| Gas | 0.17 (USEPA 1995) | ||
| Power generation (g kg−1) | Coal | 5.25–12.00 (Zhang 2006) | |
| Diesel fuel | 0.50 (USEPA 1995) | ||
| Kerosene | 0.90 (USEPA 1995) | ||
| fuel oil | 0.62 (USEPA 1995) | ||
| Gas | 0.17 (USEPA 1995) | ||
| Residential (g kg−1) | Coal | 1.89–6.86 (Zhang 2006) | |
| Kerosene | 0.9 (USEPA 1995) | ||
| Diesel fuel | 0.5 (USEPA 1995) | ||
| fuel oil | 0.28 (USEPA 1995) | ||
| Gas | 0.17 (USEPA 1995) | ||
| Industrial process (g kg−1) | |||
| Metallurgical | Sinter | 2.62 (SEPA 1996) | |
| Pig iron | 6.00 (SEPA 1996) | ||
| Steel | Open hearth, furnace | 13.80 (SEPA 1996) | |
| Electric arc furnace | 6.02 (SEPA 1996) | ||
| Basic oxygen furnace | 10.45 (Klimont et al 2002) | ||
| Casting | 8.48 (SEPA 1996) | ||
| Aluminum | 5.20–18.28 (SEPA 1996) | ||
| Alumina | 297.13 (SEPA 1996) | ||
| Other non-ferrous | meta | 246.00 (SEPA 1996) | |
| Mineral products | Cement | 12.86–28.46 (Lei et al 2011a) | |
| Glass | 2.94–10.69 (SEPA 1996) | ||
| Bricks | 0.27 (SEPA 1996) | ||
| Lime | 1.40 (Klimont et al 2002) | ||
| Chemical | Coke | 5.22 (SEPA 1996) | |
| Refined oil | 0.10 (Klimont et al 2002) | ||
| Fertilizer | 0.86 (SEPA 1996) | ||
| Carbon black | 1.44 (Klimont et al 2002) | ||
For mobile sources (i.e., road vehicles, rail vehicles, shipping vessels, aircraft and agricultural and construction machinery), the PM2.5 emissions are calculated by multiplying the fuel consumption and EF. Fuel use data are acquired from CSY (2009) and the China Transportation Statistical Yearbook CTSY (2009). The EF for road vehicles, rail vehicles, shipping vessels and aircraft (see table 2) are adopted from Sugiyama et al (Sugiyama et al 2009). Generally, unregulated motor vehicles such as construction and agricultural machinery are likely to emit more particles than other ordinary vehicles, we followed earlier work and assumed freight and special-purpose vehicles have equal EFs (Sugiyama et al 2009).
Table 2. PM2.5 emission factors for mobile sources.
| Mobile sources | Fuel type | Emission factor (kg Tj−1) (Sugiyama et al 2009) |
|---|---|---|
| Passenger cars | Diesel | 35.5 |
| Buses | Diesel | 58.2 |
| Freight and special-purpose vehicles | Diesel | 63.1 |
| Trains | Diesel | 73.8 |
| Coal | 6.45 | |
| Shipping vessels | Diesel | 44.2 |
| Heavy oils | 79.3 | |
| Aircraft | Jet fuel | 16.2 |
2.2. Input–output model
An environmental input–output model is used to link the final consumption of goods and services to direct PM2.5 emissions through the intricate supply chain (Costello et al 2011, Erickson et al 2012). As initially described by Leontief (1970), the original input–output monetary flows among n sectors are balanced as:

where X represents a vector of total economic output in each sector; A is the normalized technology coefficients matrix or direct requirement coefficient matrix, whose element ai,j represents the required input from Sector i to produce unit output in Sector j; Y is a vector of domestic consumption, consisting of domestically-produced portion (Cd) and imported final consumption (Cm). E and M, respectively, represent the vectors of exports and imports; AX represents the intermediate use during the production phase, including products supplied domestically (AdX), and products supplied by foreign partners (AmX).
In this analysis, imports imbedded in the Chinese input–output table are removed to isolate the domestic supply chain. This method eliminates imports from the intermediate inputs and domestic demand (Y) and allows the estimation of local emission released due solely to domestic consumption. We follow the approach applied in previous studies (i.e., Weber et al 2008) and assume that each economic sector and domestic demand category utilize sectoral imports in the same proportions (Weber et al 2008, Guan et al 2009, Guan and Barker 2012, Guan et al 2014, Huo et al 2014, Lin, et al 2014). Thus equation (3) can be expressed as:
Imports M are used for final consumption (Cm) and intermediate consumption (AmX), namely:

Therefore, rearranging equation (4):

Local emissions in relation to domestic consumption (FC) (Peters and Hertwich 2008, Erickson et al 2012, Steen-Olsen et al 2012) and exports (Ec) are derived as:

where  d is direct emission intensity, representing the primary PM2.5 emission associated with one unit industry output. I is the identity matrix. (I-Ad)−1 here is the revised Leontief inverse matrix, whose element
  tracks the overall direct and indirect input along the domestic supply chain from Sector i while generating unit output in Sector j. The term d(I-Ad)−1, therefore, represents the embodied intensity (
 a row vector with each element (
 representing the embodied emission per domestic consumption from Sector j. In other words,
  denotes the total direct and indirect emissions generated through the whole supply chain to produce the unit product or service in Sector j. Therefore, the relationship between the embodied intensity
  and direct intensity d follows:

To match the classification of sectors from different data sources, the original input–output table for China in 2007 (CSY 2008) (with 135 sectors) is merged into 43 sectors. The abbreviations and descriptions of these aggregated sectors are presented in table 3.
Table 3. Sector code, abbreviation and description of the aggregated 43 sectors. The 43 sectors are subdivided into six categories: agriculture (Sector 1), industry (Sectors 2–36), power (Sectors 37–39), construction (Sector 40), transportation (Sector 41) and service (Sectors 42–43).
| Code | Abbreviation | Sector | Description |
|---|---|---|---|
| 1 | AGR | Agriculture | Agriculture, forestry, fishery and water conservancy |
| 2 | MWC | Coal | Mining and washing of coal |
| 3 | EPG | Petroleum and gas | Extraction of petroleum and natural gas |
| 4 | MPF | Ferrous metal | Mining and processing of ferrous metal ores |
| 5 | MPN | Non-ferrous metal | Mining and processing of non-ferrous metal ores |
| 6 | MPO | Non-metal ores | Mining and processing of non-metal ores and other ores |
| 7 | PFA | Agricultural products | Processing of food from Agricultural Products |
| 8 | MFI | Foods | Manufacture of foods |
| 9 | MFB | Beverages | Manufacture of beverages |
| 10 | MFT | Tobacco | Manufacture of tobacco |
| 11 | MFE | Textiles | Manufacture of textiles |
| 12 | MFW | Clothing products | Manufacture of clothing, footwear and caps |
| 13 | MFL | Leather products | Manufacture of leather, fur, feather and related products |
| 14 | PTM | Wood products | Processing of timber, manufacture of wood, bamboo, rattan, palm, and straw products |
| 15 | MFF | Furniture | Manufacture of furniture |
| 16 | MPP | Paper products | Manufacture of paper and paper products |
| 17 | PRM | Recording media | Printing, reproduction of recording media |
| 18 | MFA | Cultural articles | Manufacture of articles for culture, education and sport activities |
| 19 | PPC | Petroleum products | Processing of petroleum, coking, processing of nuclear fuel |
| 20 | MRC | Chemical products | Manufacture of raw chemical materials and products |
| 21 | MFM | Medicines | Manufacture of medicines |
| 22 | MCF | Chemical fibres | Manufacture of chemical fibres |
| 23 | MFR | Rubber | Manufacture of rubber |
| 24 | MFP | Plastics | Manufacture of plastics |
| 25 | MNM | Non-metallic mineral products | Manufacture of non-metallic mineral products |
| 26 | SPF | Ferrous metals products | Smelting and pressing of ferrous metals |
| 27 | SPN | Non-ferrous metals products | Smelting and pressing of non-ferrous metals |
| 28 | MMP | Metal products | Manufacture of metal products |
| 29 | MGP | General purpose machinery | Manufacture of general purpose machinery |
| 30 | MSP | Special purpose machinery | Manufacture of special purpose machinery |
| 31 | MTE | Transport equipment | Manufacture of transport equipment |
| 32 | MEM | Electrical machinery | Manufacture of electrical machinery and equipment |
| 33 | MCE | Electronic equipment | Manufacture of computers and other elect. equipment |
| 34 | MMI | Cultural machinery | Manufacture of measuring instruments and machinery for cultural activity and office work |
| 35 | MAM | Artwork | Manufacture of artwork and other manufacturing |
| 36 | RDW | Waste | Recycling and disposal of waste |
| 37 | PSE | Power generation | Production and supply of electric power and heat power |
| 38 | PSG | Gas | Production and supply of gas |
| 39 | PSW | Water | Production and supply of water |
| 40 | CSI | Construction | Construction industry |
| 41 | TSP | Transportation | Transport, storage and post |
| 42 | WRT | Trades and hotels service | Wholesale and retail trades, hotels and catering services |
| 43 | OSI | Other service industry | Other service industry |
2.3. Structural path analysis
SPA performed in this study is based on the matrix Ad discussed in section 2.2. The real power of SPA is to analyse the production network through inter-sector flows, and rank paths according to their generation of PM2.5 emissions, from which it is able to identify the key areas of the production network that require improvements (Defourny and Thorbecke 1984, Suh and Heijungs 2007, Skelton et al 2011). Recently, increasing studies have used SPA to identify important supply chains and their associated origins and destinations in a certain country or international trade flows (Peters and Hertwich 2006a, Peters and Hertwich 2006b, Lenzen et al 2007, Lenzen et al 2012, Kanemoto et al 2014).
In general SPA, the revised Leontief inverse in equation (7) is expanded using Taylor series approximation that is given by (Waugh 1950) as:
On the right-hand side of equation (9), each element in the expansion denotes a different production tier. In this study, we calculate the PM2.5 embodied in domestic demand and exports which drive local emissions (i.e., y = Cd + E) as:
where  represents the contribution of emissions from the tth production tier. For example, assuming the case where y is a demand for a laptop:
  Iy is the PM2.5 emitted in the production of the laptop by the laptop manufacturer. To produce the laptop, the laptop manufacturer needs to buy inputs from other industries (Ady) and these industries generate
  Ady of PM2.5. In turn, these industries also need inputs (i.e., Ad(Ady)) and meanwhile
  2y of PM2.5 is released. And so on and so forth, the infinite expansion of power series continues. Thus, PM2.5 emission in the zeroth tier is the emission during the assembly phase of the laptop. PM2.5 in the first tier is the PM2.5 emission associated with producing the parts needed by the laptop manufacturer. PM2.5 emission in the second or higher tier is the emission to produce the inputs for the components in the supply chain.
The quantity of nodes in the production network increases exponentially with each tier. There are nt+1 nodes in each tier where t is the tier and n is the number of sectors in the economy. For example, the n3 second-tier nodes are evaluated as  kAdkjAdjiyi and denote the path from i → j → k. The same pattern continues for all tiers.
In practice, it is time consuming and impossible to evaluate the infinite number of nodes in the tree. The value of input nodes decreases with path length; the tree is generally 'pruned' when the contribution from the sub-tree below the node is below a specified threshold. Using this tree-pruning concept a dynamic tree data structure is constructed and only the relevant production paths are included. This technique has proved invaluable in sorting the production paths according to the environmental impact (Lenzen 2007).
2.4. Principal component analysis
Equation (8) indicates that a sector's embodied emission intensity is composed of direct intensities from all sectors in an economic system. In principle, the embodied intensity is the sum of contributions from all sectors, but scaled by the Leontief inverse matrix (i.e., the transformed intermediate flows of input). Therefore, each term on the right hand side of equation (8) measures the magnitude of the EIC from itself and other sectors (Lin and Sun 2010). To compare the pattern of interdependence of EICs between sectors, we conduct a PCA on these decomposed sectoral PM2.5 emission intensities (i.e., EICs) and derive the empirical orthogonal functions (EOFs).
The EOFs (also termed 'principal component (PC) loadings') represent the eigenvectors of the correlation matrix (Wilks and Haman 1996) of the normalized EICs and denote the independent modes of sectors. The eigenvalues of each eigenvector is the amount of variance explained by the eigenvector. Generally, first few EOFs can represent much of the variance, making PCA a powerful tool to screen out the most representative variation patterns among variables for a data set. Projection of the sectoral intensity onto the EOFs defines the PCs (also referred to as PC scores; Wilks and Haman 1996). These PC scores show the sectors' most representative distribution of EICs associated with the EOF, and thereby depict the general feature of an economic system that generates PM2.5 emissions.
3. Production-based versus consumption-based PM2.5 emissions
The production-based emissions from industrial processes and energy related sectors, as well as the consumption-based emissions from capital formation, inventory growth, government consumption, urban consumption and rural consumption for China in 2007 (ignoring the emissions embodied in imports) are presented in figure 1 (illustrated by 13 representative sectors) and table S1 in the Supporting Information (SI). The resolved total PM2.5 emission from the industrial sectors (excluding biofuel source) in China in 2007 (9.68 Tg) corresponds closely with the previous estimation for 2005 (8.56 Tg) (Lei et al 2011). If taking into account the direct emissions from household commercial fuel use, total PM2.5 emission in China is 10.3 Tg in 2007.

Figure 1. Production-based (left) versus consumption-based (right) PM2.5 emissions (unit: Tg yr−1) of the selected 13 sectors for China in 2007. Production-based emissions include sources from industrial processes and energy-related emissions. Consumption-based emissions denote the local emission associated with domestic consumption, equal to the sum of rural consumption, urban consumption, government consumption, capital information and growing inventories (shown by different colours).
Download figure:
Standard image High-resolution imageFossil fuel combustion is the dominant source of PM2.5 (4.89 Tg) across nearly all economic sectors. Industrial processes generate equal amounts of PM2.5 emissions, but are spread across only a narrow range of sectors, such as the manufacture of non-metallic mineral products (MNM, 4.15 Tg). The MNM sector alone accounts for 43.3% of total PM2.5 emissions (4.48 Tg, figure 1), mainly because China is the world's largest producer of cement. Power generation with the responsibility to provide heat and electricity accounts for another quarter of the PM2.5 source. The manufacture of ferrous metals products ranks third and emits approximately 10% of anthropogenic PM2.5 in China. The abovementioned three sectors together contribute three quarters of the anthropogenic PM2.5 emissions in China. Direct emissions from the other 40 aggregated sectors are relatively small.
The consumption-based inventory here represents the domestic emissions instigated by final demand purchases of final products, traced through the domestic supply chain. The portion resulting from domestic demand of China in 2007 was 7.13 Tg from the consumption perspective, lower than the actual amount released (9.68 Tg) by 26%, mainly due to the export of goods and services (2.55 Tg). Different fundamentally from the production-based inventory, the dominant contributors of China's PM2.5 emissions, from the consumers' perspective, are the construction industry, other service industry, transport equipment and power generation sectors (figure 1).
To understand the discrepancies between the two inventories and the relevant interlinking paths that trace PM2.5 emissions embodied in final products, we conduct a SPA. The SPA actually derives an infinite number of pathways between sectors. To give a complete picture of the interdependence among sectors, we aggregate the original 43 sectors into six broad categories: power, transport, agriculture, industry, service and construction, and then merge the impact of each production layer (or tier). Figure 2 (and table 4) shows the components of embodied and direct emissions driven by the final consumption at Tier 0, Tier 1, and higher Tiers (Tier 2 and Tier 3 → ∞), which denote the emissions from the manufacture of the final products, emissions from producing the required inputs, and all other associated emissions from making the components for the required inputs, respectively. From the consumption point of view, PM2.5 emissions are relatively small from power, transportation and agriculture productions (altogether accounting for ∼6% of the total), and approximately 30–50% of the emissions occur directly (i.e., in the zeroth Tier, see table 4). Emissions attributed to Tier 1 and higher tiers account for another half for power and transportation. For power generation, substantial amounts of fossil fuels (e.g., coal, natural gas) are combusted, which release tremendous amounts of gaseous and particulate pollutants. Furthermore, the mining of fossil fuel as well as the building and maintenance of power plants demand additional power and equipment inputs. This drives additional PM2.5 release. For example, if one household consumes one kilowatt of electricity, there must be approximately two kilowatts of electricity generated to feed this consumption and to secure the associated production activities along the supply chain. Similarly, burning gasoline or diesel fuels for transportation activities directly releases substantial carbonaceous particles, while the preparation of vehicles and fuels drives even more PM2.5 release from power and industrial production.
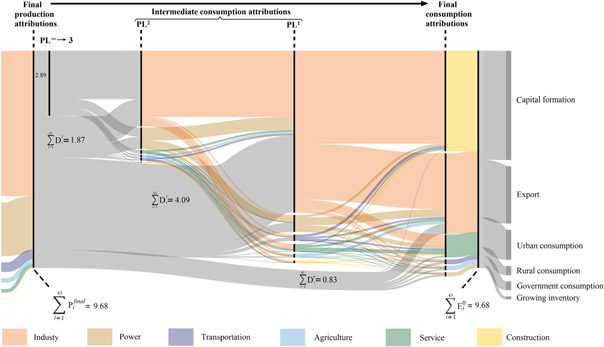
Figure 2. Sankey diagram of embodied PM2.5 flows for sectors in China. From left to right, the widths of indicated flows represent the magnitude of PM2.5 emissions (unit: Tg yr−1). The left-hand side of map shows the total final production of PM2.5 (9.68 Tg; if household PM2.5 emissions are considered, though out of the scope of this diagram, the total PM2.5 emissions in China should be 10.3 Tg in 2007). Colours indicate the six aggregated sectors. The central part of the diagram reveals the intermediate consumption attributions for each aggregated sector at PL0, PL1 and PL2, which are indicated by the dark grey 'flows' linking back to the final production attribution. An element  represents direct emissions released from sector s at PLt. An element (
 at PLt represents emissions embodied in the output of sector s at PLt. Flow from PLt to PLt-1 (
 measures emissions from all sectors embodied in the output of sector i at PLt purchased by sector j at PLt-1. The dark grey 'flows' on the right-hand side of map indicate the PM2.5 emissions attributed to final demand (rural consumption, urban consumption, government consumption, capital formation, growing inventories and export).
Download figure:
Standard image High-resolution imageTable 4. Distribution of induced direct PM2.5 emissions in the production tier along the supply chain from consuming power, transportation, agriculture, industry, service and construction products.
| Attribution of direct emissions | |||||
|---|---|---|---|---|---|
| Consumption-based emission (Tg) | GDP (Billion Yuan) | Tier 0 | Tier 1 | Tier 2 → ∞ | |
| Power | 0.18 | 184 | 51.95% | 24.16% | 23.89% |
| Transportation | 0.21 | 731 | 52.34% | 11.73% | 35.93% |
| Agriculture | 0.20 | 1455 | 33.32% | 19.45% | 47.23% |
| Industry | 3.60 | 9176 | 12.50% | 25.68% | 61.81% |
| Service | 1.01 | 8986 | 8.52% | 23.78% | 67.70% |
| Construction | 4.48 | 6072 | 0.49% | 63.02% | 36.49% |
Consumption of industry and service products drives about 40% of China's total primary PM2.5 emissions, but nearly 70% of which occur at the second and higher tiers (table 4) with an almost identical structure in sector contribution (figure 2 and table 4). This feature indicates that restructuring China's economy from industry to services is only a temporary solution in terms of air pollution control. It cannot fundamentally solve the problem, but only moderately slow down the pace of PM2.5 release (from figure 3, the embodied emission intensity of service products is only half of that of industrial products). In the long run, as demand for service products increases, PM2.5 emissions will rebound if the end-of-pipe emissions from power and industries are not sufficiently controlled.

Figure 3. Embodied PM2.5 emission intensities for the selected 13 sectors. Embodied intensity denotes the PM2.5 emission by unit production (104 Yuan), which includes the direct emissions on-site (blue) and indirect emissions (supply-chain-induced emissions (orange)).
Download figure:
Standard image High-resolution imageAs presented in figure 2 (and table 4), the structural path of attributed emissions for construction is distinct. Almost no emissions occur directly to meet final demand (Tier 0, table 4). However, production of building materials (e.g., cement, steel and glass) in the first tier as well as preparation of additional higher tiers' input account for 2.8 Tg and 1.6 Tg PM2.5 emissions, respectively. This indicates that to produce one unit of building material, nearly 60% more PM2.5 emissions must be released. Note that in figure 1, capital formation (especially in the construction sector) holds the highest share, up to 51% (4.9 Tg). This is due, primarily, to intensive investment in construction, which accounted for more than 50% of China's total investment in 2007 (CSY 2008). In many developing countries such as China, investments in infrastructure are an important driver for maintaining economic growth (Zhang et al 2013). For example, the length of highways has been extended by more than 90% from 187 million kilometres in 2002–358 million kilometres in 2007 (CSY 2008). This greatly increases the production of electricity, cement, non-ferrous metals, and products from steel industries. In contrast, in developed countries, such as Japan, the share of capital formation in driving PM2.5 emissions is much less. In 2000, only 20% of PM2.5 emissions in Japan were embodied in capital formation (Sugiyama et al 2009). Since the embodied emission intensity for construction is twice that of industry and quadruple that of service production (inferred from table 4), an expansion of construction activity in China will inevitably accelerate the degradation of air quality.
In addition, the ten top-ranking paths through which demand drives the production processes are presented in table 5. The supply chain involving the largest PM2.5 emissions (in China in 2007) was 'capital formation→construction→non-metallic mineral products' which accounted for 25.2% of the overall PM2.5 emissions. six of the top ten ranking paths are associated with construction related activities, and the non-metallic mineral products sector appears in four top ranking paths which involve approximately one third of the PM2.5 emissions. In addition, power generation is responsible for three of the high-ranking paths.
Table 5. The ten top-ranking paths for PM2.5 emissions starting from a final demand (i.e., rural consumption, urban consumption, government consumption, capital formation, growing inventories and export) and ending with a polluting sector.
| Rank | Tier | Contribution (%) | Path |
|---|---|---|---|
| 1 | 1 | 25.2 | Capital formation→ construction →non-metallic mineral products |
| 2 | 2 | 4.2 | Capital formation→ construction→ non-metallic mineral products→ non-metallic mineral products |
| 3 | 0 | 3.0 | Export→ non-metallic mineral products |
| 4 | 1 | 1.75 | Capital formation→ construction→ ferrous metals products |
| 5 | 0 | 1.48 | Urban consumption→ power generation |
| 6 | 3 | 0.9 | Capital formation→ construction→ non-metallic mineral products→ non-metallic mineral products→ non-metallic mineral products |
| 7 | 1 | 0.62 | Capital formation→ construction→ power generation |
| 8 | 0 | 0.55 | Export→ transport |
| 9 | 2 | 0.50 | Capital formation→ construction→ ferrous metals products→ ferrous metals products |
| 10 | 0 | 0.4 | Rural consumption→ power generation |
4. Embodied PM2.5 emission intensity
The pattern of the structure path in figure 2 indicates that most final consumption will ultimately produce PM2.5 emissions from power and industrial production in the higher tiers of the production chain. However, the efficiencies, in terms of emission per monetary output, are quite different between sectors. In this section, we focus on understanding the key sectors which solely contribute most to PM2.5 emissions, and investigate the importance of those sectors facilitating the rest of the economy. Figure 3 shows the embodied PM2.5 emission intensities of selected important sectors (selected from the 43 sectors in table 1) for China in 2007 (values are given in table S2), in conjunction with details of the source contribution. In 2007, the gross domestic production (GDP) in China was 26.6 trillion Yuan (CSY 2008). Therefore, the average PM2.5 intensity of GDP across all sectors was 3.6 Kg PM2.5 10−4 Yuan. However, sectors such as non-metallic mineral products (MNM, mainly contributed by cement production; 26.1 Kg 10−4 Yuan), power generation (13.4 Kg 10−4 Yuan), and construction (7.4 Kg 10−4 Yuan) have PM2.5 intensities significantly above the average level. The high emission intensities of MNM and power generation are mainly caused by the direct release of limestone or that generated during the combustion of fossil fuel. In contrast, the embodied PM2.5 emissions in the construction sector reflect the complex supply chain or requirement of materials creating intensive emissions from upstream industries.
As well as the construction sector, indirect emissions account for a larger proportion of the embodied emission intensity for most sectors except for coal, MNM and power generation. To separate the sectors with similar patterns that drive PM2.5 emissions in China, we conducted a PCA and extracted the EOFs and PCs from the matrix of PM2.5 emission intensity contributions (i.e., the EICs) as described in equation (8). According to figure 4, we found that the first three EOFs together account for approximately 90% of the total variance across the normalized matrix of EICs, indicating that most sectors typically follow two or three distinct supply patterns to drive PM2.5 emissions. Specifically, the loadings of EOF1 reveal that nearly 80% of the 43 sectors in China share a fairly similar pattern in driving PM2.5 emissions in electricity, coal, petroleum, cement, chemical products and ferrous metal industries, primarily because almost all sectors follow a similar manner in requiring the material or electricity input in their supply chain. Thus, these six sectors are identified as the key to where opportunities exist for reducing the emission intensities of the whole economy. Efforts to reduce PM2.5 intensities should focus on cleaner production technology and pollution abatement strategies in these six sectors.

Figure 4. The first three EOFs and associated PCs, derived from the decomposed embodied PM2.5 emission intensities (i.e., the EICs). The percentage of total variance explained by individual EOFs is also shown. The blue bars show the principle component scores derived from projecting the PM2.5 emission intensities onto the derived EOFs. The EOFs (i.e., the principal component loadings) are illustrated by '+'.
Download figure:
Standard image High-resolution image
The EOF2 highlights the construction and MNM sectors. As represented by the corresponding PC2, MNM is suggested as the dominant contributor to the emission intensity of the construction sector. Considering the rapid expansion of infrastructure building (∼2.0 billion square metres per year (Tu 2013)), of which cement is the essential building material, it is clear that the PM2.5 emissions are indirectly embodied in the final products through the supply chains. Thus, new and advanced technologies should be introduced to reduce the PM2.5 intensity of the MNM sector, which in turn will significantly cut down the embodied intensity of construction.
The EOF3 mainly represents the embodied emission intensities from the manufacture of equipment and machinery, which requires the supply of ferrous metals products. Therefore, the ferrous metals products sector is considered as the main contributor to the embodied intensities of metal products, general purpose machinery, special purpose machinery and transport equipment.
The above EOF analysis further indicates that these 43 sectors can be arranged into three independent groups, which separately drive PM2.5 emissions mainly from power, MNM, and the ferrous metal products sectors. Consequently, controlling PM2.5 emissions from power generation will significantly reduce the embodied intensity for almost all consumptions. In contrast, emissions reduction in the cement or ferrous metal industry will only lower the PM2.5 intensity for a few consumer industries (i.e., construction and the equipment and machinery industry, respectively). These origin patterns of PM2.5 emissions suggest that as well as further controlling end-of-pipe emissions from power plants, curbing the rapid expansion of construction or relying more on green building materials could be an alternative way to effectively control PM2.5 emissions in China, which will have little impact on other sectors of the economy.
5. Discussion and policy implications
The production perspective is better suited to identifying the PM2.5 emission of different production processes, while the consumption perspective identifies the consumer purchases that lead to PM2.5 emission. A comparison between the consumption and production perspectives highlights the difference in making policies for air pollution mitigation. For instance, the construction sector contributes just 0.2% of total direct PM2.5 emission, but it drives nearly 50% of industrial PM2.5 emissions from upstream sectors such as non-metallic mineral products and the steel industry. The SPA identifies that the industrial inputs are the main cause of PM2.5 emissions instigated by the construction sector (i.e., tier 1 in figure 2), while according to PCA, the high embodied emission intensity of the construction sector is solely contributed by non-metallic mineral products. Therefore, policymaking aimed at reducing primary PM2.5 could abate emissions from cement production (MNM sector) or choose materials with lower embodied PM2.5 intensities during the pre-construction phase. For example, our calculation indicates that substituting 50% of cement use by Celitement (Miles 2012), a cleaner alternative than the widely used ordinary portland cement, may avoid 1.12 Tg anthropogenic PM2.5 emissions in China.
For the other sectors (except construction), as indicated by the PCA results, most of the embodied PM2.5 emissions stem from power generation and the manufacture of products. The SPA also reveals that the impact of agriculture, industry and service occurs in the higher tiers and is due to the power and industrial supply. Therefore, ways to lower emissions should focus on the production process in the supply chain, including improving energy use efficiency and relying more on environmentally friendly energy sources (Li and Fan 2008, Tapiador 2009, Poizot and Dolhem 2011, Ward and Inderwildi 2013). Measures such as phasing out inefficient industrial boilers and optimizing the energy mix could cut down end-of-pipe emissions to some extent. Using these approaches, the low emission intensity goal of most economic sectors can be achieved.
Being a developing country, China is undergoing rapid urbanization. Efforts made to control existing pollution units could be quickly overtaken by a rapid increase in demand for new production activities. For instance, the urban population has risen by 148 million during 2000s, and the urbanization rate of the country has increased from 35.8% in 2000 to 44.9% in 2010 (CSY 2010). A large area of farmland on the urban fringe has been converted to provide housing, infrastructure and services for new migrants. However, the urban sprawl is low-density, compared to existing inner city development (Chen et al 2008). Good design of new cities could avoid huge amounts of air pollution released in both the building and subsequent operational phases. In general, there is a positive relationship between urban compactness and agglomerated environmental performance to a certain extent (Chen et al 2008). An appropriate compact level could be adopted in China's urban planning to maximize the environmental advantages.
As well as pursuing compact urban development, the Government could gradually impose a property tax for families with multiple houses, which could prevent the building of more vacant houses. According to a nationwide survey covering 262 counties in 29 provinces by researchers from China's Southwestern University of Finance and Economics (SRC 2014), the vacancy rate of sold urban residential homes reached approximately 20% in 2013. This is comparable to an area amounting to all the completed buildings from 2007 to 2008. Therefore, proper policies should be formulated to stimulate usage of unoccupied houses and avoid building more vacant units. Assuming that 20% of the investment in construction goes on vacant homes (i.e., equal to the vacancy rate) and another 20% can be avoided by reducing existing vacant units, our calculation based on the embodied emission intensity indicates that PM2.5 emissions in China could be reduced by 1.94 Tg (approximately one quarter of total emissions in 2007), primarily in MNM (1.7 Tg), ferrous metals products (0.11 Tg), and the transportation (0.04 Tg) sectors. There are even more health and climate co-benefits if the reduction of CO2 and other PM2.5 precursors (i.e., SO2 and NOx) are considered. This will fundamentally mitigate China's air pollution by relying less on emission-intensive industries.
6. Conclusion
Like other societies, China's economy is a complicated system involving many sectors, and each of them is interdependent and linked to PM2.5 emissions through the supply chain. We use SPA to identify the linkages between production and consumption and use PCA to examine the pattern of all supply chain paths, which enable policymaking more orientated towards efficient emission mitigation through the systematic supply-chain approach.
The results reveal that the direct PM2.5 emissions instigated from final demand are responsible for only 8%, and most emissions (92%) are triggered in the supply chains. Sectors drive PM2.5 emissions in different ways. In the power and transportation sectors, direct emissions (Tier 0) instigated from consumer products are relatively large, contributing nearly half of the consumption-based emissions. In contrast, PM2.5 emissions driven by construction, industry, and service products are mainly embedded in the higher tiers of the production activities. Based on PCA, we found that nearly 80% of the economic sectors in China follow a similar pattern in driving PM2.5 emissions in electricity, coal, petroleum, cement, chemical products and ferrous metal industries. An exception is the construction sector, which relies heavily on inputs from non-metallic mineral products.
The above inter-linkage pattern of the production chains indicates that as well as further reducing end-of-pipe emissions, there are several approaches available to China to reduce PM2.5 emissions. Substituting emission-intensive products (e.g., cement) in the supply chain with cleaner alternatives (e.g., Celitement) could effectively reduce PM2.5 emissions driven by construction. Phasing out inefficient industrial boilers and optimizing the energy mix could cut down the embodied emission intensities for almost all the supply chain. Importantly, in the demand-driven economy, measures taken to constrain construction (particularly the investment) may also be effective in reducing PM2.5 emissions. This study offers a more comprehensive and accurate picture of how consumers' demand for each industry contributes to emissions, as well as opportunities to reduce them by restructuring China's economy and blocking the paths that induce indirect emissions.
Acknowledgments
We thank two anonymous reviewers for their thoughtful comments and helpful suggestions. This work is supported by funding from the National Natural Science Foundation of China under awards 41222011, 41390240 and 41130754, the Research Project of the Chinese Ministry of Education No. 113001A, as well as the 111 Project (B14001). The authors thank Dr David Wilmshurst for language editing.