

Abstract
Earlier research that reports a correlational pattern between climate anomalies and violent conflict routinely refers to drought-induced agricultural shocks and adverse economic spillover effects as a key causal mechanism linking the two phenomena. Comparing half a century of statistics on climate variability, food production, and political violence across Sub-Saharan Africa, this study offers the most precise and theoretically consistent empirical assessment to date of the purported indirect relationship. The analysis reveals a robust link between weather patterns and food production where more rainfall generally is associated with higher yields. However, the second step in the causal model is not supported; agricultural output and violent conflict are only weakly and inconsistently connected, even in the specific contexts where production shocks are believed to have particularly devastating social consequences. Although this null result could, in theory, be fully compatible with recent reports of food price-related riots, it suggests that the wider socioeconomic and political context is much more important than drought and crop failures in explaining violent conflict in contemporary Africa.
Export citation and abstract BibTeX RIS

Content from this work may be used under the terms of the Creative Commons Attribution 3.0 licence. Any further distribution of this work must maintain attribution to the author(s) and the title of the work, journal citation and DOI.
1. Introduction
A large number of recent studies have attempted to establish an empirical link between climate variability and armed conflict. So far, this body of research has failed to converge on a consistent and robust climate effect (Bernauer et al 2012, Adger et al 2014, Buhaug et al 2014, Gemenne et al 2014, Salehyan 2014). However, extant research largely tests direct associations and remains elusive about possible intervening factors and facilitating conditions that could translate environmental hardships into collective violence, potentially obscuring more subtle associations. Perhaps the most widely accepted indirect pathway that has been proposed in the literature features weather-driven agricultural shocks as an important intermediate step (Homer-Dixon 1991, Miguel et al 2004, Koubi et al 2012, Wischnath and Buhaug 2014). This article presents the first true cross-country quantitative analysis of the proposed pathway by investigating how income fluctuations from climate-sensitive agriculture affect a spectrum of political violence, and to what extent socio-political factors moderate this relationship. We analyze post-colonial Sub-Saharan Africa (SSA), whose economies and livelihoods are especially vulnerable to fluctuations in weather patterns and where underlying drivers of conflict and instability thrive. Although we find a powerful effect of climate variability on food production, a comprehensive set of regression models reveal weak and inconsistent connections between agricultural output and violent conflict, also in the specific contexts where food-related economic shocks are believed to have devastating impacts. This null result by no means implies that local climate variability and agricultural deficit can never be causally related to societal instability, but it does question the general applicability of recent claims that contemporary African conflicts occur partly in response to weather-induced crop failures.
2. Climate variability and food production
On a global scale, fluctuations in season temperature and precipitation levels explain a substantial portion of the variation in major crop yields (Ray et al 2015). Despite uncertainty in climate change projections and the effects of carbon fertilization and crop-level adaptation, sustained warming over the next decades may lead to a decline in food production, notably in dry and tropical climates, shifting production to higher latitudes (Challinor et al 2014, Asseng et al 2015). Southern Africa and the Sahel, which host large populations dependent on cultivation of climate-sensitive crops, are generally regarded among the most vulnerable regions in the world, and popular African cereals are under particular pressure of future warming and extreme weather events (Thornton et al 2011, Knox et al 2012). The trajectory and strength of future rainfall patterns in the region are less well understood (Rowell 2012).
Rainfall variability is generally high in Africa, particularly in the continent's drylands. Greater variability affects biophysical resources such as crops directly and social conditions indirectly (Barnett and Adger 2007). African crop production systems are predominantly rain-fed, implying high interannual volatilities in output. Although income loss from low production in dry years may be offset partly by higher yields in wet years, increasingly erratic weather patterns and associated increases in droughts, wild fires, and floods threaten to cause a breakdown in agro-ecological systems across the continent in the absence of new investments and successful adaptation (Lobell et al 2011, Porter et al 2014).
Social effects of climate variability depend on the adaptive capacity of cultural, economic, and political systems. In general, less predictable rainfall increases production risks, deters investments, and exacerbates challenges related to capacity and employment, and may further accentuate livelihood insecurity as people struggle to recover from loss of key assets. Market price responses may cushion some of the adverse financial impacts of harvest loss for producers, but can have severe impacts on consumers (Dorward 2012).
3. Food insecurity and political violence
Human history offers abundant accounts of how rising food prices and reduced food access have served as fundamental drivers of war and revolution (Rudé 1964, Goldstone 1991, Diamond 2005, Tol and Wagner 2010, Zhang et al 2011). But this dynamic may not be unique to the pre-modern world. Indeed, several recent studies draw a causal arrow from food price shocks to urban social unrest in contemporary Africa (Berazneva and Lee 2013, Smith 2014, Bellemare 2015), and some also link the 2011 'Arab Spring' uprisings to peaks in international food prices (Johnstone and Mazo 2011, Sternberg 2012, for a different perspective, see Sneyd et al 2013).
The uncovered empirical association between food prices and social unrest is important in its own right, but the causal role of local weather patterns—and in the longer run, climate change—in these cases is unclear. Historically, the key drivers of consumer price fluctuations are fuel, fertilizer, and transportation costs, hoarding and market speculation, and, more recently, expansion of biofuel production (Tadesse et al 2014). Domestic food policies may dampen, delay or accentuate such fluctuations.
While African states are increasingly dependent on food imports to cover domestic needs (Rakotoarisoa et al 2011), agriculture remains the largest economic sector in terms of state revenues as well as labor opportunities and livelihood provision. African agriculture is also highly climate sensitive; only around 6% of the continent's food production is irrigated (NEPAD 2013). Accordingly, if we seek to understand how climatic variability and change may be indirectly related to violent conflict, investigating the political effects of domestic food production shocks is more relevant than studying social responses to food price changes.
A number of proposed causal pathways link climate-driven food production changes with political violence. Loss of income from agriculture and pastoralism may increase the motivation and lower the opportunity cost of joining a rebellion (Miguel et al 2004, Fjelde 2015). Similarly, agricultural deficit may add financial strains to weak regimes through loss of tax revenues and foreign exchange earnings and more costly food imports, draining funding away from other government sectors and rendering challenges to state governance, including coups d'état, more viable (Homer-Dixon 1999, Kim 2015). More generally, agricultural decline may cause livelihood contraction and famine and amplify existing social inequalities, leading to deprivation-related communal conflicts and rioting (Barnett and Adger 2007, Raleigh and Kniveton 2012, Kelley et al 2015). In the wake of acute food shortages, maldistribution or embezzlement of aid may further contribute to violent conflict (Benjaminsen 2008, Hendrix and Brinkman 2013, Nunn and Qian 2014). Alternatively, distress migration may lead to host-newcomer tensions or identity conflicts (Reuveny 2007, Raleigh 2010) and accentuate urban sprawl. Widespread corruption and authoritarian rule founded on narrow patronage coalitions—common features among many African regimes—foster public disloyalty and lack of trust in political institutions and may provide the breeding ground within which any of these social outcomes can play out (Le Billon 2003, Arriola 2009). A simplified rendering of the proposed linkages is portrayed in figure 1.

Figure 1. Suggested linkages between weather anomaly, food production, and political violence. Solid boxes represent conditions that are measured and tested. Dashed boxes represent unobserved possible causal mechanisms. See supplementary information (section H) for an overview of illustrative cases in support of these pathways.
Download figure:
Standard image High-resolution imageSocieties are not related to nature in a mechanistic manner, however; the proposed network of linkages may break down for a number of reasons. Warfare is often inefficient and costly and bargaining may provide solutions short of violent conflict (Fearon 1995); societies may possess sufficient capacity to cope with an economic shock and, in the longer run, adapt to changing ecological conditions, scarcity, and the tensions these may engender (Salehyan 2008); crises may promote cooperation rather than conflict (Böhmelt et al 2014); hunger and deprivation may produce ineffective fighters (Adano et al 2012); or the adversely affected population may lack the skills, resources and a shared identity required for mobilization and collective action (Tilly 2003). Fundamental socioeconomic and political conditions as well as geographical and cultural contexts are likely to influence the likelihood and type of societal outcome materializing through these pathways (Ide et al 2014).
4. Empirical analysis
In this study we investigate the empirical association between climate variability, food production, and political violence across SSA. Country-specific indicators of temperature and precipitation variability are constructed from high-resolution gridded climate statistics from the National Oceanic and Atmospheric Administration and University of Delaware and prepared for analysis via PRIO-GRID (Tollefsen et al 2012). We use both linear and squared terms to capture possible nonlinear climate effects on food production (see sections B and E in the supplementary information for details).
Annual estimates of national food production levels are based on the UN's Food and Agricultural Organization data bank (FAOSTAT 2012). Unlike food price statistics, which are affected by, e.g., international market forces, government-sponsored subsidies, domestic consumption patterns, and corruption, and are hard to compare across societies, output statistics in the study region are inherently related to agricultural performance and closely tied to local weather patterns4 . In models reported below, we use a country-level aggregate food production index, expressed in total value of annual food production per capita in constant 2000 international (Geary–Khamis) dollars, which best captures the loss of income for households and the state when harvest fails. We consider yearly production levels, interannual growth in production, and deviation from the long-term mean. In sensitivity tests we use indices that tap crops and cereals production separately.
Data on violent conflict are derived from a variety of sources to capture the diversity of violent outcomes suggested in figure 1. Outbreak of civil conflict, defined as the first year of fighting between state and rebel forces causing at least 25 battle-related deaths, is represented by the UCDP/PRIO Armed Conflict Dataset, v.4-2012 (Themnér and Wallensteen 2012). General social unrest, including public demonstrations and riots, are taken from the Social Conflict in Africa Database, SCAD (Salehyan et al 2012). In sensitivity tests, we run the models on a subset of SCAD events that are specifically related to food and subsistence resources (supplementary information, section C). Third, we include severe inter-communal violence from the UCDP Non-State Conflict dataset, v.2.3 (Sundberg et al 2012). Finally, we consider the occurrence of attempted coups (Powell and Thyne 2011). The SCAD and non-state conflict datasets are only available for the post-Cold War period; the remaining two conflict datasets cover the entire post-colonial (1960–) period.
We begin the empirical evaluation by inspecting aggregate climate variability and food production trends. The left panel of figure 2 visualizes the well-known drying across SSA over the past 50 years (dashed line). After the Sahelian drought of the mid-1980s, there has been a moderate increase in rainfall, although with notable interannual and intraregional variations. The solid line shows contemporaneous country mean food production per capita for SSA. The two phenomena exhibit similar trends (r = 0.59), but the decline in food production per capita is stronger than that of precipitation, in part because of substantial population growth in the period. The supporting information, section B, provides further evidence of the powerful effect of rainfall on food production. Panels 2(b) and (c) illustrate the historical sensitivity of food production to precipitation deviation across countries. There is considerable geographic variation in influence of rainfall variations on agricultural output; semi-arid countries in the Sahel and East Africa are especially responsive to rainfall where more rain means higher yield.

Figure 2. Precipitation and food production across Sub-Saharan Africa. Panel (a): continental mean annual food production per capita (solid line) and precipitation anomaly (dashed line); panels (b) and (c): country-specific estimated change in food production per capita with one standard deviation above 1961–90 mean rainfall (whiskers represent 95% confidence interval). See tables B3–B6 in supplementary information for details on the country-specific association between rainfall and food production.
Download figure:
Standard image High-resolution imageFigure 3 visualizes temporal patterns in the four forms of political violence considered here. Reflecting the global pattern, conventional state-based civil conflicts in SSA (a) increased during the Cold War period but have since declined in frequency. In contrast, the frequency of (typically) less severe social unrest events (b) appear to be on the rise, although some of this upward trend may be due to improvements in reporting over time. Aside from a notable peak in non-state conflict casualties (c) in the early 1990s, this form of conflict displays a weaker time trend. Finally, military coups (d) were a recurring phenomenon much of the Cold War but have since declined in frequency.

Figure 3. Trends in political violence across Sub-Saharan Africa. The plots show (a) the number of countries experiencing civil conflict onset and incidence since 1960; (b) frequency of social unrest events since 1990; (c) reported fatalities in non-state conflicts since 1989; and (d) the number of countries with recorded coup attempts since 1960.
Download figure:
Standard image High-resolution imageThe empirical validity of the first step in the causal model, the influence of weather patterns on crop yields, is well documented elsewhere so our results on this link are reported in the supplementary information (section B) only. Across all models, we find a strong but nonlinear positive effect of rainfall on food production whereas yearly mean temperature has a weaker effect. Next, in order to assess the second step, conflict sensitivity to short-term variations in agricultural output, we estimate a series of regression models on two alternative geographic samples. Table 1 presents results from eight models covering all countries in SSA, with the dependent variable operationalized as civil conflict outbreak (Models 1–2); the logged annual number of social unrest events (Models 3–4); the occurrence of non-state conflict (Models 5–6); and the occurrence of one or more attempted coup(s) d'état in the country year (Models 7–8). As an initial test, we are primarily interested in the temporal dynamics of the agriculture-conflict relationship regardless of the origin of food production fluctuations, so the main models are estimated through ordinary least squares (OLS) regression with country fixed-effects and controls for time trend and serial correlation (see below as well as supplementary information, section E, for alternative model specifications).
Table 1. Food production and political violence in Sub-Saharan Africa.
| Civil conflict onset 1962–2009 | Social unrest events 1991–2009 | Non-state conflict 1990–2009 | Coup attempt 1962–2009 | |||||
|---|---|---|---|---|---|---|---|---|
| 1 | 2 | 3 | 4 | 5 | 6 | 7 | 8 | |
| Food prod. t−1 | 0.143 | −2.639 | −0.468 | −0.526 | ||||
| (0.282) | (1.578) | (0.424) | (0.344) | |||||
| Food prod. Δ t−1 | > −0.001 | <0.001 | > −0.001 | > −0.001 | ||||
| (0.001) | (0.002) | (0.001) | (0.001) | |||||
| Time | 0.001 | <0.001 | 0.011 | 0.010 | −0.003 | −0.003 | −0.001* | −0.001* |
| (0.001) | (0.001) | (0.006) | (0.006) | (0.002) | (0.002) | (0.001) | (0.001) | |
| Conflict t−1 | −0.081** | −0.087** | 0.328** | 0.332** | 0.217** | 0.219** | 0.058 | 0.059 |
| (0.020) | (0.021) | (0.047) | (0.046) | (0.057) | (0.056) | (0.042) | (0.043) | |
| Constant | 0.024 | 0.049** | 0.869** | 0.612* | 0.320** | 0.271** | 0.168** | 0.101** |
| (0.044) | (0.014) | (0.290) | (0.240) | (0.091) | (0.086) | (0.055) | (0.017) | |
| R-squared | 0.017 | 0.017 | 0.136 | 0.132 | 0.052 | 0.052 | 0.010 | 0.009 |
| Observations | 1862 | 1820 | 795 | 793 | 835 | 833 | 1862 | 1820 |
| Countries | 42 | 42 | 42 | 42 | 42 | 42 | 42 | 42 |
Note: ordinary least squares (OLS) country fixed-effects regression coefficients with clustered standard errors in parentheses; ** p < 0.01, * p < 0.05. Odd-numbered models estimate the effect of food production levels whereas even-numbered models estimate the effect of year-on-year growth (Δ) in food production.
Across all models, we find relatively weak and insignificant effects for domestic food production and we also note that the sign of the coefficients shifts between outcome types. In this sense, table 1 implicitly contrasts both claims that political violence is more prevalent when basic needs are met (Salehyan and Hendrix 2014) and claims that agricultural income shocks increase civil conflict risk (von Uexkull 2014). The results are consistent with Koubi et al (2012) and van Weezel (2015), however, who conclude that rainfall—a significant determinant of yields in SSA—has little impact on conflict either directly or through economic performance.
The covariate that best and most consistently explains temporal variation in political violence is the time-lagged conflict incidence indicator. Models 1–2 show that a new civil conflict is unlikely to break out if another one is already ongoing in the same country whereas Models 3–6, which capture the occurrence of less organized conflict, demonstrate that violence begets violence. Coups d'état (Models 7–8) exhibit a comparatively weak temporal correlation pattern in our data and are generally regarded as a highly unpredictable phenomenon (Luttwak 1979).
Next, we estimate the same set of models on a subsample of 14 countries in SSA where rainfall has a large and significant positive effect on food production (figure 2(b); see supplementary information, section B for details). To better capture the influence of climate variability and reduce concerns with endogeneity, we further replace the standard OLS model with two-stage instrumental variable regression. The first stage in this model estimates the joint influence of annual rainfall (linear and squared terms) and temperature (linear) on contemporaneous food production. This effect then constitutes the exogenous instrument for food production in the second stage. The results are reported in table 2. Mirroring the results presented above, we fail to uncover a robust signal for agricultural performance, although the sign of the coefficient for food production now remains negative in seven of the eight specifications.
Table 2. Food production, instrumented by weather, and political violence; climate-sensitive subsample.
| Civil conflict onset 1962–2009 | Social unrest events 1991–2009 | Non-state conflict 1990–2009 | Coup attempt 1962–2009 | |||||
|---|---|---|---|---|---|---|---|---|
| 9 | 10 | 11 | 12 | 13 | 14 | 15 | 16 | |
| Food prod. t−1 | −0.695 | −2.389 | −0.816 | 0.808 | ||||
| (0.869) | (12.915) | (5.977) | (1.499) | |||||
| Food prod. Δ t−1 | > −0.001 | −0.003 | −0.003 | > −0.001 | ||||
| (0.002) | (0.012) | (0.006) | (0.003) | |||||
| Time | <0.001 | <0.001 | 0.028* | 0.027* | −0.006 | −0.006 | −0.001 | −0.002 |
| (0.001) | (0.001) | (0.013) | (0.013) | (0.004) | (0.004) | (0.001) | (0.001) | |
| Conflict t−1 | −0.095* | −0.098* | 0.395** | 0.397** | 0.232* | 0.231* | 0.003 | −0.001 |
| (0.041) | (0.040) | (0.068) | (0.067) | (0.117) | (0.116) | (0.043) | (0.044) | |
| Constant | 0.253 | 0.154** | 0.694 | 0.399 | 1.083 | 0.973** | 0.059 | 0.191** |
| (0.139) | (0.040) | (1.693) | (0.405) | (0.810) | (0.128) | (0.232) | (0.028) | |
| R-squared | 0.041 | 0.047 | 0.672 | 0.671 | 0.628 | 0.624 | 0.034 | 0.049 |
| Observations | 666 | 652 | 266 | 266 | 280 | 280 | 666 | 652 |
| Countries | 14 | 14 | 14 | 14 | 14 | 14 | 14 | 14 |
| Country FE | YES | YES | YES | YES | YES | YES | YES | YES |
| Precip. first stage | .163** | 83.9** | .080** | 85.9** | .096** | 90.8** | .163** | 83.8** |
| Precip. sq. first stage | −.058** | −29.6** | −.034** | −33.9** | −.039** | −35.2** | −.058** | −29.6** |
| Temp. first stage | .003 | −2.97 | −.004 | −5.48 | −.001 | −3.67 | .003 | −2.98 |
| Endogeneity test | .601/.45 | .046/.83 | .018/.90 | .115/.74 | .070/.80 | .337/.57 | 1.41/.26 | .005/.94 |
| P(Bassman overid.) | .60 | .52 | .84 | .85 | .03 | .04 | .51 | .50 |
| P(Sargan overid.) | .59 | .51 | .83 | .84 | .02 | .03 | .50 | .50 |
Note: two-stage least squares coefficients with standard errors clustered on country in parentheses; ** p < 0.01, * p < 0.05. Odd-numbered models estimate the effect of food production levels whereas even-numbered models estimate the effect of year-on-year growth (Δ) in food production. Contemporaneous effects and instrumented results for the full Sub-Saharan Africa sample are documented in supplementary information, section E.
Food production shocks may have different consequences depending on the socioeconomic context, so next we consider a series of interactive relationships. Specifically, we investigate the joint effect of food production and (i) low level of development, (ii) extent of discriminatory political system, and (iii) economic dependence on agriculture; three conditions whereby loss of income from agriculture might constitute a particular challenge to society. To model these interactions, we include time-varying regressors instead of country-fixed effects where (i) is represented by infant mortality rate (IMR; World Bank 2014), (ii) is captured using the Ethnic Power Relations v.1.1 data (Cederman et al 2010), while (iii) uses an index of agricultural contribution to GDP (World Bank 2014). Moreover, to preserve focus on temporal dynamics, food production is now operationalized as yearly deviation from the country mean, 1961–2009. We use additive inverse deviation values to ensure theoretical consistency among the components in the interaction terms. All models control for (ln) population size, conflict history, and a common time trend, and models without IMR and agricultural dependence additionally control for (ln) GDP per capita. The results are presented in table 3.
Table 3. Interaction models.
| Civil conflict onset 1962–2009 | Social unrest events 1991–2009 | Non-state conflict 1990–2009 | Coup attempt 1962–2009 | |||||||||
|---|---|---|---|---|---|---|---|---|---|---|---|---|
| 17 | 18 | 19 | 20 | 21 | 22 | 23 | 24 | 25 | 26 | 27 | 28 | |
| Food prod. dev. t−1 | −0.029 | −0.002 | −0.013 | 0.002 | 0.001 | 0.004 | −0.020 | 0.004 | −0.031 | −0.015 | 0.012 | −0.009 |
| (0.023) | (0.008) | (0.019) | (0.006) | (0.002) | (0.003) | (0.022) | (0.009) | (0.037) | (0.019) | (0.008) | (0.018) | |
| IMR t−1 | 0.007 | 0.001 | 0.004 | 0.003 | ||||||||
| (0.004) | (0.002) | (0.006) | (0.004) | |||||||||
| Food t−1 × IMR t−1 | <0.001 | > −0.001 | <0.001 | <0.001 | ||||||||
| (<0.001) | (<0.001) | (<0.001) | (<0.001) | |||||||||
| Discrimination t−1 | 1.531** | 1.303* | 1.499** | −0.034 | 0.296 | 0.060 | 0.421 | 1.332 | 0.846 | −0.178 | −0.335 | −0.328 |
| (0.527) | (0.551) | (0.503) | (0.262) | (0.371) | (0.267) | (0.892) | (0.911) | (0.771) | (0.478) | (0.496) | (0.491) | |
| Foodt−1 × Discrimination t−1 | −0.004 | −0.033 | −0.101* | <0.001 | ||||||||
| (0.025) | (0.027) | (0.044) | (0.021) | |||||||||
| Agriculture dependence t−1 | 0.011 | <0.001 | 0.013 | 0.019** | ||||||||
| (0.009) | (0.003) | (0.014) | (0.007) | |||||||||
| Food t−1 × Agric. dep. t−1 | <0.001 | > −0.001 | 0.001 | 0.001 | ||||||||
| (<0.001) | (<0.001) | (0.001) | (<0.001) | |||||||||
| GDP p.c. (ln) t−1 | −0.220 | −0.008 | −0.273 | −0.368* | ||||||||
| (0.182) | (0.053) | (0.184) | (0.160) | |||||||||
| Population (ln) | 0.279* | 0.287** | 0.207 | 0.183** | 0.179** | 0.190** | 0.867** | 0.826** | 1.017** | −0.023 | −0.058 | −0.106 |
| (0.115) | (0.110) | (0.126) | (0.037) | (0.041) | (0.039) | (0.153) | (0.172) | (0.178) | (0.103) | (0.113) | (0.128) | |
| Time | 0.028 | 0.011 | 0.021 | −0.002 | −0.003 | −0.005 | −0.063** | −0.070** | −0.066* | −0.023 | −0.026* | −0.024 |
| (0.019) | (0.013) | (0.015) | (0.006) | (0.005) | (0.006) | (0.023) | (0.019) | (0.027) | (0.016) | (0.012) | (0.013) | |
| Conflict t−1 | −0.615 | −0.646* | −0.830* | 0.614** | 0.607** | 0.594** | 2.631** | 2.631** | 2.246** | 1.052** | 0.956** | 0.751* |
| (0.370) | (0.308) | (0.382) | (0.044) | (0.044) | (0.044) | (0.404) | (0.408) | (0.390) | (0.366) | (0.349) | (0.376) | |
| Constant | −7.258** | −4.480** | −5.948** | −1.045** | −0.843 | −0.926** | −8.486** | −5.625* | −9.914** | −2.266* | 0.982 | −1.753 |
| (1.202) | (1.233) | (1.121) | (0.348) | (0.561) | (0.333) | (1.530) | (2.667) | (2.292) | (0.972) | (1.651) | (0.961) | |
| Observations | 1766 | 1862 | 1609 | 795 | 795 | 757 | 835 | 835 | 795 | 1766 | 1862 | 1609 |
| Model fit | −297.75 | −321.42 | −274.96 | 0.555 | 0.557 | 0.536 | −230.99 | −230.04 | −207.83 | −420.52 | −442.98 | −388.25 |
Note: OLS (Models 20–22) and logit (all other models) coefficients with clustered standard errors in parentheses; ** p < 0.01, * p < 0.05. Model fit denotes log likelihood (logit models) or R-squared (OLS models).
Again, we are unsuccessful in establishing a consistent covariation pattern between agricultural performance and political violence. Interpreting the combined effect of interaction terms with continuous parameters is inherently difficult but figure 4 shows that food production is insignificantly related to all conflict outcomes across levels of socioeconomic development for all three interaction terms. The sole exception is the result in Model 24, where lower food production in highly discriminatory societies is negatively associated with non-state conflict. This result would seem to contradict the standard scarcity thesis (Homer-Dixon 1999) although it is consistent with observations that conflict is more prevalent during surplus years (Witsenburg and Adano 2009, Salehyan and Hendrix 2014).
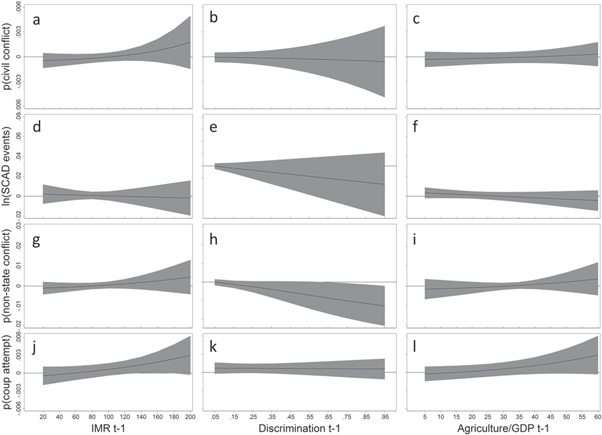
Figure 4. Marginal effect of food production on political violence by socioeconomic context. The plots show predicted change in the risk of four types of political violence (rows) for each unit (%) increase in food production as a function of alternative socioeconomic and political conditions (columns). Shaded areas represent 95% confidence intervals around the estimated interaction effects.
Download figure:
Standard image High-resolution imageMirroring earlier research, ethnopolitical exclusion is strongly related to higher civil conflict risk, but not necessarily to other forms of political violence. Infant mortality rate and economic dependence on agriculture appear largely irrelevant. While this may come as a surprise, recall that most countries in SSA are characterized by underdevelopment and a large agricultural sector, implying that the variation in values on these indicators is modest.
Large parameter uncertainties and p-values above the conventional significance threshold (5%) may disguise substantively important effects (Ward et al 2010). Accordingly, as a final assessment, we conduct a set of out-of-sample simulations and compare predictions for models with and without food production. The models are estimated on a subset of the full sample, in this case all years before 2000, and the estimated effects are then used to predict conflict outcomes out of sample, i.e., the 2000–09 period. Figure 5 shows the predicted values from four pairs of models that are specified similarly to Models 17, 20, 23, and 26, except for the shorter time period and the fact that one model in each pair drops the food production deviation variable. For civil conflict and social unrest, the models generate very similar predictions, signaling that agricultural performance adds little to the models' predictive power. There is more spread in the predictions for the remaining two outcome categories. Puzzlingly, the model without food production performs better in both cases—i.e., the Receiver Operating Characteristics curves have higher 'Area Under the Curve' scores. We hesitate to put too much emphasis on the ROC tests, given the rareness of the outcomes (notably Models 17 and 26) and the relatively small training samples (Models 20 and 23), but nonetheless the patterns observed in the out-of-sample simulations substantiate the regression results reported above; fluctuations in agricultural output explain little of the observed variation in political violence in post-colonial Sub-Saharan Africa.

Figure 5. Out-of-sample predictions of political violence. The plots show (a) predicted risk of civil conflict onset, (b) predicted number of (log) social unrest events, (c) predicted risk of non-state conflict, and (d) predicted risk of coup attempt for models with and without food production. All predictions refer to the period 2000–09. Each dot represents a country; symbols in panels (a), (c), and (d) denote true outcomes in the period.
Download figure:
Standard image High-resolution image
5. Concluding remarks
Emerging evidence suggests that food price shocks are associated with an increase in social unrest (Smith 2014, Bellemare 2015, Hendrix and Haggard 2015, Weinberg and Bakker 2015). Yet, the robust 'non-finding' presented here implies that so-called 'food riots' play out largely isolated from climate-sensitive production dynamics in the affected countries. Likewise, claims that adverse weather and harvest failure drive contemporary violence in Africa (e.g., Hsiang et al 2013, IFPRI 2015) are not supported by our analysis. Instead, social protest and rebellion during times of food price spikes may be better understood as reactions to poor and unjust government policies, corruption, repression, and market failure (e.g., Bush 2010, Buhaug and Urdal 2013, Sneyd et al 2013, Chenoweth and Ulfelder 2015).
While this study has gone further than earlier research in seeking to uncover an indirect and conditional effect of climate variability on collective political violence via food production shocks, a few caveats are in order. First, lack of significant results should not be interpreted as a de facto dismissal of any possible link between food insecurity and social unrest. Importantly, we do not account for how agricultural deficit among major global food exporters as well as international food price volatilities translate into domestic food insecurity in vulnerable societies, and to what extent political leaders are able and willing to implement effective countermeasures.
Second, our country-averaged study also is unable to capture highly localized dynamics and events in the same manner as geographically disaggregated studies that explore the more direct association between climate variability and civil conflict (e.g., Theisen et al 2011, 2012). Unfortunately, lack of crop yield statistics below the scale of countries hinders such an analytical approach here, although we find it reasonable to assume that socioeconomic shocks capable of triggering large-scale conflict are likely to be of a magnitude sufficiently severe to be detectable even in the aggregated data. Besides, it is not given that climatic or agricultural shocks and social responses necessarily play out within the same subnational units of observation (provinces or grid cells), which complicates the causal identification strategy.
Moreover, one should not ignore the reverse relationship between food insecurity and conflict. Armed conflict is development in reverse, and civil war is perhaps the most important driver of malnourishment and hunger in Africa today (FAO, IFAD and WFP 2015). Likewise, chronic violence and political instability undermine human security, make populations more vulnerable to harsh environmental conditions (Busby et al 2013, Ide et al 2014), and sometimes engender massive refugee flows5 .
Future climate change, coupled with demographic and socioeconomic development, is projected to worsen environmental and ecological conditions and hamper agricultural productivity improvements across large parts of the African continent. Inferring from recent historical patterns, there is little reason to fear that this development by itself should result in higher rates of social disturbances. Instead, African stability and peace are likely to be influenced by the trajectories of social, political, and economic contexts within which food security threats emerge and are dealt with. As the IPCC's Fifth Assessment Report concludes, 'it is likely that socioeconomic and technological trends, including changes in institutions and policies, will remain a relatively stronger driver of food security over the next few decades than climate change' (Porter et al 2014, p 513). Although we should not underestimate conceivably adverse social effects of climate change-induced droughts and crop failures outside of violent conflict, a number of instruments exist in the policy maker's toolbox to minimize such risks, including trade, subsidies, substitution, diversification, insurance schemes, and strategic storage policies, and—in the longer run—technological development, innovation (including genetic engineering), and improved early warning systems (e.g., Godfray et al 2010, UNEP 2015, Wiebe et al 2015).
Acknowledgments
This research has been carried out with financial support from the Research Council of Norway, grant no. 240315/F10. The authors declare no conflict of interest.
Footnotes
- 4
Local productivity might also be affected by increasing energy and transportation costs and subsequent spikes in the cost of inorganic fertilizers.
- 5
A powerful reverse relationship also raises concerns about endogeneity bias in the statistical analysis. This is handled by specifying time lags on time-varying regressors and using exogenous instruments for food production in some models (table 2 as well as section E in the supplementary information).