

Abstract
Spatial variability and temporal trends of the shallow ground thermal regime and permafrost active-layer thickness (ALT) were estimated over 1963–2013 using daily soil temperature data available from stations of the Russian Hydrometeorological Service. Correlation analysis was used to evaluate the role of changing climatic conditions on the ground thermal regime. ALT data collected by the Circumpolar Active Layer Monitoring program in Russia were used to expand the geography of ALT observations over 1999–2013, and to identify 'hot spots' of soil temperature and ALT change. Results indicate that a substantially higher rate of change in the thermal regime of permafrost-affected soils prevailed during 1999–2013, relative to the last fifty years. Results indicate that the thermal regime of the upper permafrost in western Russia is strongly associated with air temperature, with much weaker relationships in central and eastern Russia. The thermal regime of permafrost-affected soils shows stronger dependence on climatic conditions over the last fifteen years relative to the historical 50-year period. Geostatistical analysis revealed that the cities of Norilsk and Susuman are hot spots of permafrost degradation. Of six settlements selected for detailed analysis in various parts of the permafrost regions, all but one (Chukotka), show substantial changes in the shallow ground thermal regime. Northern locations in the continuous permafrost region show thickening of the active layer, while those farther south experienced development of residual thaw layers above the permafrost and decreases in the duration of the freezing period.
Export citation and abstract BibTeX RIS

Content from this work may be used under the terms of the Creative Commons Attribution 3.0 licence. Any further distribution of this work must maintain attribution to the author(s) and the title of the work, journal citation and DOI.
Introduction
Permafrost is among the most extensive components of the terrestrial cryosphere, occupying more than a tenth of the global land area, including about 16.7 million km2 in Eurasia (Zhang et al 2008, IPCC 2013). Permafrost plays important roles in global climate change, in the balance of greenhouse gases, Arctic environments, ecosystems, and human activities in the polar regions (Shakhova et al 2010, Romanovsky et al 2010b, AMAP 2011). Permafrost degradation can have significant impacts on the environment including local changes in topographic and hydrologic conditions, changes to vegetation and wildlife dynamics, and changes in global greenhouse gas emissions (Nelson et al 2001, Zimov et al 2006, Tarnocai et al 2009, Anisimov et al 2010, Streletskiy et al 2014). Anthropogenic effects related to construction and disturbance of the land surface by human activities can exacerbate the effects of climate change on permafrost conditions, leading to negative impacts on infrastructure and the sustainability of northern communities (Anisimov et al 2010, Grebenets et al 2012, Streletskiy et al 2012).
Permafrost temperatures in the Russian Arctic have typically increased between 0.5 °C and 2.0 °C since the late 1970s, with warming rates being much smaller for warm ice-rich permafrost at temperatures close to 0 °C than for colder permafrost or bedrock (Romanovsky et al 2010a, Romanovsky et al 2010b, Romanovsky et al 2014). Active layer thickness (ALT) has also increased in many parts of the Eurasian Arctic, especially in the European sector (Shiklomanov et al 2012, Romanovsky et al 2015). These results, however, are based on limited observational data (Biskaborn et al 2015).
The shallow ground thermal regime is historically monitored by the weather station network operated by Roshydromet, providing a valuable resource to complement observations compiled through the global terrestrial network for permafrost (GTN-P) over substantial areas of the Russian Arctic. Monthly soil temperature records available for approximately 430 stations of the former Soviet Union up to 2000 have been used in numerous studies concerned with soil temperature, thawing and freezing indices, and as validation for permafrost models (Gilichinsky et al 1998, Frauenfeld et al 2004, Zhang et al 2005, Chudinova et al 2006, Frauenfeld and Zhang 2011). Comprehensive analysis of the soil thermal regime over the entire Russian territory based on all of the available daily soil temperature data was originally developed in the late 2000s (Sherstyukov 2008, Sherstiukov 2009) and later extended for a subset of long-term stations (Park et al 2013, Park et al 2014).
In this paper we combine soil temperature data collected at Roshydromet weather stations and observational active-layer data compiled through the Circumpolar Active Layer Monitoring (CALM) program to evaluate spatiotemporal changes in the ALT and near-surface permafrost conditions across the Russian Arctic over the last 50 years. We use the most recent version of the daily soil temperature archive available for 458 stations in Russia for 1963–2013, and 64 Russian CALM sites for 1999–2013 to: (1) quantify the spatial variability and long-term trends in ALT and near-surface permafrost temperature; (2) identify hot spots of permafrost degradation and assess the sensitivity of the upper permafrost to changing climatic conditions; and (3) document changes in the ground thermal regime in population centers located in various permafrost regions of Russia.
Data and methods
Daily soil temperature data under natural conditions are available for 458 stations of the Roshydromet network in Russia (Sherstiukov 2012a). The depth of soil temperature measurements varies from station to station. For the most complete set of measurements, daily soil temperature data are available for depths of 0.02, 0.05, 0.10, 0.15, 0.20, 0.40, 0.60, 0.80, 1.20, 1.60, 2.40, and 3.20 m. Although several stations in Russia have a long record of soil temperature measurements, changes in methodology limit their historical analysis; therefore the daily dataset is available only from 1963 to 2013. During this period mercury thermometers TM10 with a precision of 0.1 °C were used for soil temperature measurements at the majority of the Roshydromet stations (Manual 1985). Measurements were conducted in undisturbed vegetation (grass) and snow. The mercury thermometer was put in a metal case filled with brass, which was attached to a wooden stick of specified length. The observer lifted the thermometer from the tube, read the soil temperature and then lowered the thermometer back to a specified depth. The brass-filled case allowed some thermal inertia while the ebonite tube provided good thermal insulation, lowering the thermal influence of higher soil layers (Bykhovets et al 2007). The archived daily soil temperature dataset was run through four independent methods of quality control (Sherstiukov 2012b) and is available at www.meteo.ru/data/164-soil-temperature.
Selection of stations in permafrost regions for this study was based on the 51-year average temperature profile for each station. If maximum soil temperature was found to decrease with depth, while minimum temperature was consistently below 0 °C throughout the soil profile, the station was considered to be located on permafrost. Of the total 458 Roshydromet weather stations in Russia, 86 were selected for analysis by virtue of being located in permafrost regions and having daily soil temperature data available during 1963–2013. Comparison with the permafrost map by Brown et al (1997) confirmed that all of the selected stations were located in permafrost regions and were further used to characterize the shallow ground thermal regime and ALT (figure 1).

Figure 1. Map showing the geographic locations of the 86 Russian weather stations on permafrost with available daily soil temperature records during 1963–2013. The blue shading shows permafrost areas, after Brown et al (1997). Red dots show the location of the Russian CALM sites with at least ten years of measurements. Green stars show locations of the selected settlements on permafrost where detailed analysis of the ground thermal regime was conducted.
Download figure:
Standard image High-resolution imageALT was estimated for each of the 86 stations by determining the maximum daily temperature at each measurement depth, and using these values to construct a simple polynomial fit. The intercept of the fit with 0.0 °C was used to determine the ALT for each year of observation. Many stations, however, have limited soil temperature measurements, so the minimum number of soil temperature observations used to construct the fit was set at four: 0.4, 0.8, 1.6, and 3.2 m depth, with the majority of stations having five measurement depths. Although some previous studies have used linear interpolation (Frauenfeld et al 2004), the polynomial interpolation provides a better fit due to exponential attenuation of temperature with depth (Sherstiukov 2009), as previously shown using high-resolution temperature datasets (Streletskiy et al 2008). If the estimated depth of maximum thaw penetration was found to be below the maximum measurement depth of 3.20 m, the extrapolation was made to a greater depth. If thaw depth was found to be below 4 m, a 'no data' value was assigned and the measurement was excluded from further analysis. The interpolation error was 5–25 cm with an average of 11 cm, and depends on the distance between measurement depths and measurement interval (Riseborough 2008). While the interpolation error may be discouraging for assessment of interpolated ALT values in any particular year, the use of consistent interpolation over the entire observation period permits evaluation of temporal trends.
A best fit line was determined by regression analysis to find any significant trend in ALT over the 1963–2013 period, for the 38 stations that satisfied the following three criteria: (1) at least eleven years with estimated ALT data are available during the entire period; (2) at least one ALT value is available during the 1963–1986 period; and (3) at least one ALT value is available during the 2005–2013 period. Linear ALT trends for 1999–2013 were estimated for the total of 37 stations that met three criteria: (1) at least six years with estimated ALT data are available during the entire period; (2) at least one ALT value is available during 1999–2003; (3) at least one ALT value is available during the 2011–2013 period. A t-test for the regression slope was used to test for significance of the linear trends.
ALT was also determined by mechanical probing at the Russian CALM sites (www.gwu.edu/~calm). Of 64 sites operating in Russia in various years, only the 25 sites with records for 1999–2013 were used in this study (figure 1). In all of the locations, ALT is determined over spatially distributed georeferenced grids ranging from 100 × 100 m (1 ha) to 1000 × 1000 m (1 km2) using a systematic sampling strategy. All ALT measurements are made at the end of the thawing period, which varies depending on the site location from late August to late September. Owing to logistical constraints, however, the exact site-specific measurement day may vary from year to year (Brown et al 2000). The measurements in all but two sites are made by mechanical probing. The probe rod is inserted into the ground to the point of resistance, interpreted as the permafrost table. At sites R42 and R43, located near Yakutsk, the measurements are made with thaw tubes (Mackay 1973). The measurement error associated with mechanical probing is within 1–2 cm, and is generally also less than 2 cm for thaw tubes. In some cases, such as saline ground, the top of the ice-bearing soil does not coincide with the position of the frost table as defined by the 0 °C; however, the two methods generally show similar results in fine-grained non-saline soils (Brown et al 2000). Unlike many thaw tubes, mechanical probing does not account for changes in the original ground surface elevation (Nelson and Hinkel 2003).
Soil temperature trends at 1.6 and 3.2 m depth were estimated for the 1963–2013 and 1999–2013 periods. To evaluate the dependence of the soil temperature regime on air temperature, the correlation coefficients of annual soil temperature at 1.6 and 3.2 m depth were calculated for 1963–2013 and 1999–2013. The Getis–Ord general Gi* geostatistical method (Getis and Ord 1996) with inverse-distance weighting was used to find statistically significant ALT trends for the 1999–2013 period using the combined CALM-Roshydromet dataset. Hot and cold spots were selected based on the 90%-significance level, and are given in corresponding z-scores or standard deviations from the mean ALT trend. The same methodology was used to locate hot spots of soil temperature change at 3.2 m depth for the 1963–2013 and 1999–2013 periods.
A detailed analysis was applied to selected sites in distinct regions of the Russian Arctic to examine changes in the 0 °C isotherm progression for three time periods (figure 1). The selection of sites was made based on proximity to large settlements on permafrost and on historical data availability. To demonstrate changes in the ground thermal regime in these locations, thaw progression curves were constructed for (1) the first decade of the observations; (2) the last decade of the observations; and (3) the entire period of observations at each of the stations (table 1). The goal was to demonstrate long-term changes between the historic and modern periods, rather than comparing changes between the settlements themselves. Therefore the first decade varies depending on the location. The thawing/freezing was assumed to correspond to the 0 °C isotherm, which was estimated using universal kriging interpolation between the measurement depths, with weekly time intervals.
Table 1. Location of selected settlements on permafrost and data availability.
| City | Location | Total period | First decade | Last decade |
|---|---|---|---|---|
| Petrun' | 66.43°N, 60.77°E | 1977–2013 | 1977–1987 | 2003–2013 |
| Tarko-Sale | 64.92°N, 77.82°E | 1978–2013 | 1978–1988 | 2003–2013 |
| Igarka | 67.47°N, 86.57°E | 1977–2013 | 1977–1987 | 2003–2013 |
| Norilsk | 69.33°N, 88.30°E | 1977–2013 | 1977–1987 | 2003–2013 |
| Yakutsk | 62.02°N, 129.72°E | 1964–2013 | 1964–1974 | 2003–2013 |
| Markovo | 64.68°N, 170.42°E | 1967–2013 | 1967–1977 | 2003–2013 |
Results and discussion
Spatial variability of ALT
At small geographical scales the broad spatial pattern of ALT varies systematically along the climatic gradient. ALT, estimated from the weather stations, generally increases from the Arctic Ocean coast to the southern permafrost regions, following the summer bioclimatic gradient. ALT is generally less than 1.0 m at the most northern locations above 72°N and increases to more than 3.5 m at the southern locations just above 50°N. These general geographic trends are modified significantly by the influence of more localized factors such as vegetation, soil type, soil moisture, and snow distribution. While vegetation type is similar between the weather stations, variations in the degree of climatic continentality, snow accumulation and duration, and soil conditions make ALT highly variable within similar latitudinal locations.
Unlike the weather stations, the majority of which are located in or near the southern permafrost regions (figure 1), most of the Russian CALM sites lie north of the Arctic Circle, in more continental parts of the continuous permafrost zone from 64 to 72°N, with ALT from 1.5 m to 0.3 m respectively. In comparison, ALT in northern North America shows a less pronounced variation along a bioclimatic gradient, with ALT ranging from 0.3 to 0.8 m. Only five Russian CALM sites are in close proximity (0.5°) to the weather stations: R32 Talnakh (Norilsk), R40 Igraka, R46 and R47 (Chara), and R46 and R47 (Yakutsk). All of these stations have relatively short observational records of less than ten years. Direct comparison of point observations from weather stations with spatial averages from mechanical probing and thaw tubes is a difficult task, owing to methodological and sampling differences (Nelson and Hinkel 2003). Although direct comparison of ALT is therefore not possible, we compare generalized geographic trends from both observational networks. The comparison of latitudinal trends of ALT shows that CALM sites located at the same latitude are characterized by lower ALT, compared to the weather stations. This likely reflects (1) the presence of thicker organic layers (moss and peat) rather than the grasses characteristic of weather stations, and (2) logistical constraints that dictated sampling campaigns on dates at which the active layer was not yet fully developed. While the majority of weather stations are located in or near settlements, the majority of the CALM sites are in remote areas not represented by the regular weather station network. This makes CALM sites a valuable complement to the regular network of soil temperature observations in Russia. Comparison of general geographic trends in ALT estimated for the 1999–2013 period for CALM sites and from weather stations show similar slope of about 6 cm change in ALT per degree of latitude, with no apparent longitudinal trend.
Temporal trends in soil temperature and ALT
Although interpolated ALT from each weather station is essentially a point measurement and may not be representative of larger areas, the consistent methodology provides an opportunity to evaluate temporal trends. Analysis of soil temperature at 3.2 m depth indicates increases in temperature at almost all locations in the permafrost regions during the 1963–2013 period (figure 2(a)). The highest rates of change occurred in the southern permafrost regions. Increases in soil temperature are greatest in the Central Siberian Plateau (although observations are sparse) and in the southern mountainous regions (Altay, Sayan Mountains, Stanovoy Range), where increases are greater than 0.4 °C/decade. Regions of northeastern Siberia, such as Chukotka and Kolyma, show no significant trends. During 1963–2013, the northward retreat of permafrost is 30–40 km in the Pechora lowland and up to 70–100 km in foothills of the Ural Mountains (Oberman and Shesler 2009). However, this is less than observed for other regions such as northern Quebec, Canada where the southern limit of permafrost has retreated 130 km northward over the last 50 years (Thibault and Payette 2009).
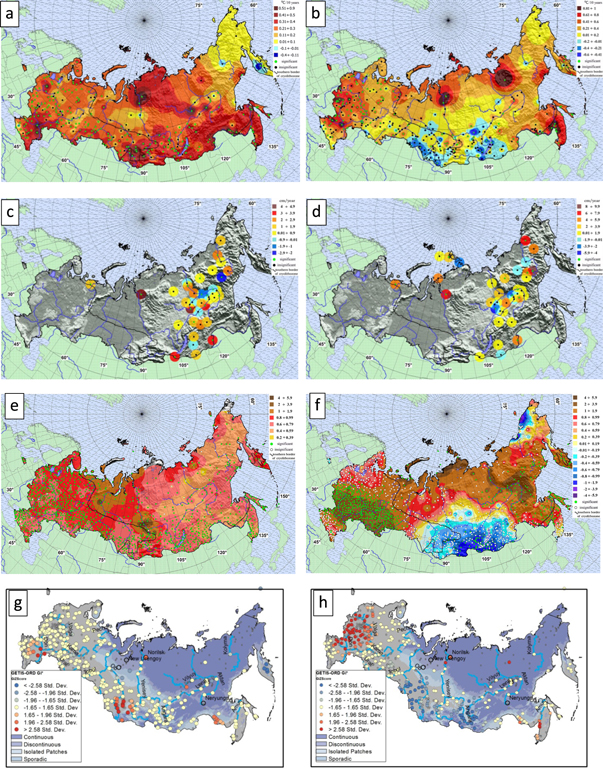
Figure 2. Linear soil temperature trends at 3.2 m depth (°C/decade) for 1963–2013 (a) and 1999–2013 (b) with the corresponding ALT trends (cm yr–1) for 1963–2013 (c) and 1999–2013 (d), and trends in DDT1/2 (°C*day/decade) for 1963–2013 (e) and 1999–2013 (f). Also shown are hot spots of soil temperature trends at 3.2 m for 1963–2013 (g) and 1999–2013 (h). The soil temperature maps were produced using inverse distance weighting interpolation and are presented only for general visualization of results. Calculated soil temperature is available at the stations shown on the maps as green dots.
Download figure:
Standard image High-resolution imageOver the last fifteen years, changes in soil temperature have been quite different. Substantial spatial variability is apparent in, for example, the southern regions of West and East Siberia, which experienced cooling trends of 0.2–0.6 °C/decade (figure 2(b)). The Russian European North, Yenisey North, Yakutia, Khabarovskiy, Kray, and Kamchatka experienced positive trends, reaching up to 1.0 °C/decade during 1999–2013. While permafrost temperature is commonly measured at 10 m or lower, at the depth of zero annual temperature amplitude, regional trends from 3.2 m are similar in magnitude and direction to the ones obtained in temperature boreholes in permafrost regions of Russia (Romanovsky et al 2010a, Drozdov et al 2015) and other Arctic regions. For example, temperature at 20 m depth increased by 0.2–0.6 °C/decade on the Alaskan North Slope. Even higher rates were observed in the Scandinavian Arctic and Canadian High Arctic regions, where some of the locations experienced warming rates of more than 1 °C/decade since 2000 (Romanovsky et al 2015).
Comparison of long-term ALT averages for 1963–2013 and 1999–2013 reveals greater ALT in modern times relative to the historic period. ALT in the last 15 years is, on average, 6% higher than the 1963–2013 average. The largest increases in ALT are at stations located along the coastal areas of the Arctic Ocean. During the last fifty years ALT has generally increased in eastern Siberia and the Far East, at a rate of 1 cm yr–1, with several locations such as Isit', Sanaga, Norils'k, and Suntar experiencing up to 3–4 cm yr–1 increases. Only a few stations in Yakutia experienced significant decreases in ALT of 1–2 cm yr–1, particularly Oymakon, Sangri, and Namtsi (figure 2(c)). During the last 15 years the rate of ALT increase was higher than during the last 50 year period, and, on average, was greater than 2 cm yr–1, with much higher trends of up to 5–6 cm yr–1 found in Norilsk, Delankyr, Omolon, and Ostrovnoe. Regions of Central Yakutia showed negative trends of 3–4 cm yr–1 over 1999–2013 (figure 2(d)). CALM sites generally show smaller, but comparable trends (Shiklomanov et al 2012). Increases in ALT over 1999–2013 were, on average, 1–2 cm yr–1 in the European Arctic (including Greenland, Norway, and Svalbard), 2–4 cm yr–1 in the European part of Russia, and less than 1 cm yr–1 for sites located in Siberia, Kamchatka, and Chukotka. For comparison, sites on the North Slope of Alaska experience an average 0.5 cm yr–1 increase (Romanovsky et al 2015). The smaller change in ALT over time at CALM sites relative to those at weather stations is attributed to thicker vegetation and the presence of organic cover, which insulates the ground from changes in air temperature. Grass cutting and removal of organic materials at weather stations may potentially increase the warming of soil (Frauenfeld et al 2004).
Degree-days of thaw (DDT), the sum of mean daily air temperature for days on which this quantity is greater than 0 °C, is an indicator of the summer heat flux. Numerous studies have confirmed that seasonal variations of ALT in permafrost regions are controlled by the duration of the warm period, analogous fluctuations in DDT, and by landscape features, as reviewed by (Brown et al 2000). Direct correlations between ALT and DDT are relatively strong in typical tundra landscapes, but generally weaker in boreal landscapes (Smith et al 2009). Regional trends in DDT estimated for the Roshydromet weather stations generally agree with the observed changes in ALT over the two study periods. However, the role of non-climatic factors, such as difference in substrate conditions, is important as not all of the locations follow the trends in DDT (figures 2(e) and (f)). Discontinuous permafrost regions of Central and Eastern Siberia, as well as Northern Chukotka, experienced negative trends in DDT over the last 15 years, while coastal regions of European Arctic, Western and Central Siberia, Central Yakutia and Kamchatka Peninsula experienced significant increases in DDT.
Linear trends of soil temperature were used to reveal areas of significant positive (hot spots) and negative (cold spots) trends in soil temperature at 3.2 m depth for 1963–2013 (figure 2(g)) and 1999–2013 (figure 2(h)). In addition to hot spots based on soil temperature, we used geostatistical analysis to reveal two hot spots of permafrost degradation based on ALT. Following trends in DDT, stations on continuous permafrost generally show hot spots, while stations in discontinuous permafrost show cold spots over the last 15 years. One is located in the Russian Far East, near Susuman (+8.5 cm yr–1, p < 0.01). Another is near Norilsk, in central Siberia (+6.2 cm yr–1, p < 0.01).
Correlation of soil and air temperature
To evaluate the dependence of soil temperature on air temperature, correlation analysis was used. A relatively strong association is evident between air and soil temperature at 1.6 m depth, which is characteristic for permafrost regions west of the Urals and in Irkutsk Oblast' north of Baikal Lake over the 1963–2013 period (figure 3(a)). Regions of East Siberia are dominated by low association between soil and air temperature. Soil temperature at 3.2 m depth is associated with that of the air to a much lesser degree, owing to strong attenuation of the climatic signal with depth. However, correlations are still above 0.4 west of the Urals and north of Baikal Lake (figure 3(c)). The correlations between soil and air temperature in East Siberia and the Russian Far East (Kamchatka, Chukotka, Amur region, and northern parts of Yakutia Republic) are close to zero. Previous research suggests that the low correlations between air and soil temperatures in these regions are attributed to snow cover (Pavlov et al 2004, Sherstyukov 2008) as interannual variability of the snow cover period and thickness significantly modulates the climatic effects (Park et al 2014). Non-climatic factors such as substrate characteristics, soil moisture content, and amount of unfrozen water may have an additional influence on decoupling air and soil temperatures in permafrost regions (Throop et al 2012).

Figure 3. Correlation of air and soil temperature at 1.6 m for 1963–2013 (a) and 1999–2013 (b), and at 3.2 m for 1963–2013 (c) and 1999–2013 (d). Note that the correlation coefficients are calculated at the stations shown on the maps as green dots. This surface was constructed using inverse distance weighting interpolation, and is intended only for general visualization of results.
Download figure:
Standard image High-resolution imageCorrelation coefficients reveal a stronger association between air and soil temperature over the most recent 15 years, as compared to the last 50 years (figures 3(b) and (d)). Soil temperature at 1.6 m depth shows correlation coefficients of 0.4 and higher for the majority of permafrost regions. Soil temperature at 3.2 m shows a stronger association with air temperature in the western and southern permafrost regions. Soil temperatures at both depths show strong association with air temperatures along the southern permafrost fringes, such as Nenets Autonomous Okrug (AO), Hanty-Mansiysky AO, and the southern part of the Krasnoyarsk Region.
Changes in thermal regime in Russian Arctic settlements
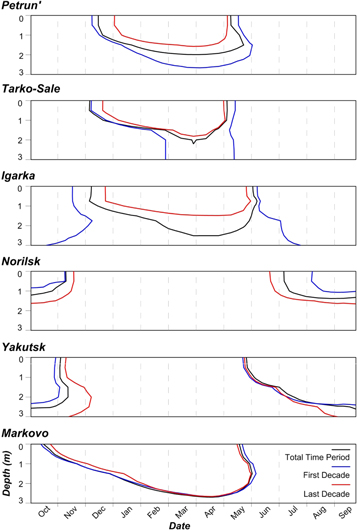
The selected locations were chosen to illustrate changes in the ground thermal regime and associated changes in progression of freezing and thawing fronts at six settlements in various parts of the Russian Arctic and in various permafrost zones. Petrun' is the most western of the selected sites, situated within isolated permafrost (Brown et al 1997). However, the station record does not reveal the presence of near-surface permafrost even during the first decade of the observations, as the layer of seasonal freezing was less than 3 m. Comparison of the historic and modern decades shows a decrease in the length of the seasonal freezing period by one month, and a corresponding decrease in the seasonal freezing depth from 2.5 to 1.5 m (figure 4). In nearby locations on permafrost, two CALM sites (R23 Talnik and R2 Vorkuta) report some of the largest increases in ALT in Russia since 1996 (Kaverin et al 2012).
Figure 4. Progression of the 0 °C isotherm during the three referenced periods: the entire observational record (black line), the first decade of observations (blue line) and the last decade of observations constructed for six selected locations across the Russian Arctic. Note that at locations with no permafrost (Petrun' and Markovo), the position of 0 °C isotherm shows the progression of seasonal freezing; in location with contemporary permafrost (Norisk and Yakutsk), it shows the progression of seasonal thawing; and in locations where permafrost was present during the first decade of observations, but is below the observational depth during the last decade (Tarko-Salle and Igarka), it shows the development of residual taliks, as the layer of seasonal freezing does not reach the permafrost table. All graphs were constructed using a kriging universal interpolation with a weekly time step and 0.5 m vertical resolution.
Download figure:
Standard image High-resolution image
Tarko-Sale is in the discontinuous permafrost zone between two large oil and gas cities, Noyabrsk and Novyy Urengoy (figure 1). The station has climatic characteristics similar to those of the R1 Nadym CALM grid (Moskalenko 2012). An increase of soil temperature at this location resulted in thickening of the active layer and possibly the development of a residual thaw layer above the permafrost over the last decade, although this could be an artifact of interpolation. The R1 CALM site did not experience significant changes in ALT during 1997–2010, but then began to thicken. A similar situation is found in Igarka, a town north of the Arctic Circle on the right bank of the Yenisei River. The weather station, originally established on permafrost, currently indicates that no permafrost is present above 3.2 m. The ALT record of R40 Igarka CALM site (Sergievskaya et al 2012) shows a 0.9 cm yr–1 increase in ALT over the 2008–2013 period. The contemporary permafrost table is located lower than the layer of seasonal freezing, allowing more water storage and migration during cold periods (Streletskiy et al 2015). Out of 86 stations located on permafrost, in four other stations (Indiga, Suntar, Strelka Chunya, and Hoseda Hard) the permafrost table was found below the contemporary layer of seasonal freezing, promoting the development of residual taliks.
Norilsk, located in Central Siberia, is the largest city on permafrost north of the Arctic Circle. It is a hot spot of change in the permafrost thermal regime, the result of both climatic and anthropogenic factors (Grebenets et al 2012). Unlike the three previously described locations, Norilsk is located in the continuous permafrost zone, so significant increases in soil temperature have not resulted in the development of a residual thaw layer above permafrost under natural conditions. The increase in the duration of the thawing period, primarily due to earlier snowmelt and increase in ALT from 1 to 1.5 m, is evident from the station record (figure 4). The R32 Talnakh CALM site, located 10 km from the station (Grebenets et al 2009), shows an increase of ALT by 1.0 cm yr–1 since 2005. Yakutsk is the largest and one of the oldest settlements built on permafrost. Soil temperature warming and a longer thawing season, primarily due to later freeze up, have resulted in thickening of the active layer at this location. The R42 Neleger CALM site, established in 2007, has also experienced a 0.7 cm yr–1 increase in ALT.
Markovo is the easternmost location of the six considered here. This Chukotkan village has one of the longest observational records available for the Far East region of Russia. It is located on the lowland of the Anadyr River about 300 km from Anadyr city. Although the village is surrounded by permafrost, permafrost is largely absent near the village itself due to topographic effects. Of the six locations considered here, this station has shown the least change in the ground thermal regime. The R9 Cape Rogozhny and R11 Mt. Dionisy CALM sites, located more than 300 km away near the coast, also show no change in ALT over the 2003–2013 period (figure 4).
Substantial changes in the timing and duration of seasonal freezing/thawing periods and depth occurred between historic and contemporary decadal periods in all but one of the stations, which are characteristic of various parts of the Russian Arctic. All stations show a decrease in the freezing period during cold months and consequently longer thawing periods. The decrease in freezing period was on average 35 days between the early and most recent decade of observations. With the exception of Norilsk's record, these changes appear to be more significant during autumn. Changes in the ground thermal regime may affect the food security of indigenous communities, geotechnical properties of infrastructure built in areas of deep seasonal frost and permafrost, and affect the accessibility of the settlements in the remote areas of the Russian Arctic (Streletskiy et al 2014).
Conclusions
Data from the GTN-P CALM and Roshydromet weather station networks were used to evaluate changes in ALT and soil temperature for sites in the permafrost regions of Russia. A general increase of soil temperature was observed over the last fifty years, with the highest rates of change in the central and southern regions of Siberia. Following increases in summer heat flux, most stations experienced a general increase in ALT over the same period, but the increase is not uniform. Several locations experienced lowering of the permafrost table below the contemporary layer of seasonal freezing, promoting the development of residual taliks (e.g., Igarka). During the last fifteen years a similar spatial pattern was evident in the continuous permafrost regions, but with much higher warming trends of soil temperature (up to 0.1 °C yr–1) and larger increases in ALT (up to 3 cm yr–1), with the maximum in central Siberia and the minimum in eastern Yakutia. Discontinuous permafrost regions generally experienced a decrease in ALT of 1–2 cm yr–1 over the same period. Locations near Norilsk and Susuman showed the largest rates of change, and can be considered to be hot spots of changes in ALT. Correlation analysis indicates a higher degree of dependence of the soil thermal regime on air temperature in the western part of Russia than in Siberia, where there is less association likely due to the reported increases in snow cover east of the Urals (AMAP 2011). All but one of the six selected settlements in the Russian Arctic have experienced substantial changes in the ground thermal regime. Increases in the length of the thawing period and higher ALT occurred in the continuous permafrost zone, while lowering of the permafrost table in the discontinuous zone below the contemporary layer of seasonal freezing leads to development of residual thaw layers above permafrost. These results can be used in environmental and geotechnical applications, and as validation of climate models in the permafrost regions of Russia.
Acknowledgments
This publication was supported by the Russian Science Foundation, project 14-17-00037 NSF grants PLR-1204110, PLR-1304555, and ICER-1558389. We thank Kelsey Nyland for help with constructing the graphs, and two anonymous reviewers for their constructive comments which helped to improve the quality of the manuscript.