

Abstract
Climate change is projected to negatively impact biophysical agricultural productivity in much of the world. Actions taken to reduce greenhouse gas emissions and mitigate future climate changes, are thus of central importance for agricultural production. Climate impacts are, however, not unidirectional; some crops in some regions (primarily higher latitudes) are projected to benefit, particularly if increased atmospheric carbon dioxide is assumed to strongly increase crop productivity at large spatial and temporal scales. Climate mitigation measures that are implemented by reducing atmospheric carbon dioxide concentrations lead to reductions both in the strength of climate change and in the benefits of carbon dioxide fertilization. Consequently, analysis of the effects of climate mitigation on agricultural productivity must address not only regions for which mitigation is likely to reduce or even reverse climate damages. There are also regions that are likely to see increased crop yields due to climate change, which may lose these added potentials under mitigation action. Comparing data from the most comprehensive archive of crop yield projections publicly available, we find that climate mitigation leads to overall benefits from avoided damages at the global scale and especially in many regions that are already at risk of food insecurity today. Ignoring controversial carbon dioxide fertilization effects on crop productivity, we find that for the median projection aggressive mitigation could eliminate ∼81% of the negative impacts of climate change on biophysical agricultural productivity globally by the end of the century. In this case, the benefits of mitigation typically extend well into temperate regions, but vary by crop and underlying climate model projections. Should large benefits to crop yields from carbon dioxide fertilization be realized, the effects of mitigation become much more mixed, though still positive globally and beneficial in many food insecure countries.
Export citation and abstract BibTeX RIS

Content from this work may be used under the terms of the Creative Commons Attribution 3.0 licence. Any further distribution of this work must maintain attribution to the author(s) and the title of the work, journal citation and DOI.
Introduction
The discussion and debate around climate mitigation is generally focused on energy mix options, technical and economic feasibility, and associated losses in economic performance measured in percentage of gross domestic product (Kriegler et al 2014). Much less attention has been paid to avoided damages through reduced climate change impacts if global warming is constrained to low levels, such as the 2° target (but see e.g. Warren et al 2013).
Recent model intercomparison projects such as the Agricultural Model Intercomparison and Improvement Project (AgMIP) (Rosenzweig et al 2013) and the Inter-Sectoral Impact Model Intercomparison Project (ISI-MIP) (Warszawski et al 2014) have coordinated simulations of climate change impacts under different future climate projections and highlighted the significant uncertainty in agricultural impact models, mainly focusing on the high-end emission scenario under the Representative Concentration Pathway (RCP) 8.5 (Moss et al 2010, Riahi et al 2011). However, the participating crop models also covered a broader set of climate scenarios, including the low-end representative concentration pathway (RCP2.6), representing a potential future world with strong climate mitigation policies (van Vuuren et al 2011a).
The objective of this study is to analyze the effects of such strong climate mitigation on biophysical agricultural productivity, which includes both reduced potential benefits from climate change in currently temperature-limited areas (e.g. in higher latitudes) as well as avoided damages in regions that are negatively affected by climate change (e.g. tropics). Hence, we assess the effect of climate mitigation on biophysical agricultural productivity by comparing simulations of the global gridded crop models (GGCMs) as submitted to the ISI-MIP archive (http://esg.pik-potsdam.de/esgf-web-fe/) for the end of the 21st century.
While moderate climate change is often found to have positive effects on agricultural productivity in higher latitudes, where agricultural production is often constrained by low temperatures, the tropics are typically projected to experience detrimental effects of climate change on agricultural productivity even at low levels of warming (Rosenzweig and Parry 1994, Funk et al 2008, Rosenzweig et al 2014). Carbon dioxide (CO2) fertilization, i.e. the stimulation of photosynthesis in C3 crops (such as wheat, rice and soy) and reduced water requirements in all crops, has been shown to be able to compensate for some part of the detrimental effects of climate change on agricultural productivity, especially if assumed to not to be constrained by down-regulating mechanisms or nutrient limitation (Zavala et al 2008, Leakey et al 2009, Ribeiro et al 2012). The effectiveness of CO2 fertilization has been assessed in various modeling and experimental studies but still constitutes a major uncertainty in future crop yield projections (Long et al 2006, Tubiello et al 2007, Ainsworth et al 2008) and biosphere modeling in general (Schimel et al 2015). This is not only because of the uncertainty in the implementation in the models, but also because experimental studies have identified several mechanisms that respond negatively to CO2 fertilization and may prevent that CO2 benefits on photosynthesis can be exploited in the form of higher crop yields (e.g. Ribeiro et al 2012). As anthropogenic climate change is mainly driven by increasing atmospheric concentrations of carbon dioxide (abbreviated as [CO2] in the following), along with other greenhouse gases (Myhre et al 2013), climate mitigation does not only cause a decrease in global warming and associated changes in atmospheric circulation and precipitation patterns, but also reductions in the potential benefits of CO2 fertilization.
We address uncertainty in patterns of climate change and climate sensitivity as well as in crop models and parameterizations by analyzing an ensemble of five General Circulation Models (GCMs) and six GGCMs for RCPs 8.5 and 2.6. Owing to the given data availability, we focus our analysis on simulations where CO2 fertilization is assumed to be fully effective, for which all 30 GCM × GGCM combinations are available. Simulations with the assumption of ineffective CO2 fertilization are only available for one GCM (HadGEM2-ES) and all six GGCMs, which we analyze as well to ensure the robustness of our conclusions to the on-going uncertainty regarding the effectiveness of CO2 fertilization in enhancing crop yields.
Methods
Simulation ensembles
We here consider the broadest set of consistent future crop yield simulations available to date, which is publicly available in the ISI-MIP fast-track data archive (Warszawski et al 2014) as described by Rosenzweig et al (2014). While Rosenzweig et al (2014) focused on the high-end emission scenario (RCP8.5), we here compare these results against a low emission scenario (RCP2.6), which represents strong climate mitigation efforts (van Vuuren et al 2011a). This data set covers various sources of uncertainty: (a) the uncertainty in climate change amplitude and patterns as represented by five different GCM implementations of each RCP emission scenario from the CMIP5 data archive (Taylor et al 2012); (b) the uncertainty from crop model response to climate change and CO2 fertilization as represented by six different GGCMs (Rosenzweig et al 2014); and (c) the uncertainty from the effectiveness of CO2 fertilization on agricultural productivity as represented by two contrasting simulations with static and dynamic [CO2]. The ten future climate change projections have been supplied to crop modelers as global daily fields of bias-corrected weather variables, including daily minimum and maximum temperature, precipitation, shortwave radiation, vapor pressure deficit and others (Hempel et al 2013).
The five GCMs considered and bias-corrected in ISI-MIP are: HadGEM2-ES (Jones et al 2011), IPSL-CM5A-LR (Dufresne et al 2013), MIROC-ESM-CHEM (Watanabe et al 2011), GFDL-ESM2M (Dunne et al 2013a, 2013b), and NorESM1-M (Bentsen et al 2013, Iversen et al 2013), and were selected by earliest availability in the CMIP5 data archive (Taylor et al 2012). The GCMs translate the greenhouse gas emission pathways (RCP 2.6 and 8.5) into spatial and temporal fields of temperatures, precipitation and other atmospheric variables. These climate scenarios were supplied to crop modelers in bias-corrected form (Hempel et al 2013).
Crops and crop models
We consider maize, wheat, rice, and soy for this comparison. These four major staple foods were selected as the top priority crops in the ISI-MIP fast-track, and together account for 57% of all vegetable food calories, 53% of all animal feed calorie supply and 50% of harvested area in 2010 worldwide (FAO 2015). The six GGCMs include site-based models (EPIC (Williams 1995, Izaurralde et al 2006), GEPIC (Williams et al 1990, Liu et al 2007), pDSSAT (Jones et al 2003, Elliott et al 2014b)) and agro-ecosystem models (LPJ-GUESS (Smith et al 2001, Bondeau et al 2007, Lindeskog et al 2013), LPJmL (Bondeau et al 2007, Fader et al 2010, Waha et al 2012, Schaphoff et al 2013), PEGASUS (Deryng et al 2011, Deryng et al 2014)), see table S1 and Rosenzweig et al (2014) for a comprehensive description of models, setups and simulation protocols as well as tables S1 and S2 in the appendix of this paper. The IMAGE-AEZ model, which also contributed data to the ISI-MIP archive, was excluded as not all scenarios considered here are available from that model.
These six crop models differ in the parameters and mechanisms assumed to represent agricultural management, as well as in how plant processes are implemented. pDSSAT, for example, implements CO2 effects in form of a scaling factor on the radiation use efficiency factor (RUE) that is used to compute net primary productivity as a function of intercepted light energy. PEGASUS, EPIC and GEPIC also scale RUE and additionally scale transpiration efficiency with increasing [CO2], while LPJ-GUESS and LPJmL explicitly compute stomata conductance (for the exchange of water and CO2 with the atmosphere) and photosynthesis as constrained by CO2 availability, light energy and Rubisco activity (see table S2). Management systems are represented by each model's default setting, ranging from a uniform assumption of crops grown under stress-free automatic fertilization everywhere (EPIC) to pixel-specific calibration of reference period yields (PEGASUS). Similarly, sowing dates and crop varieties follow model-specific parameterizations, and can differ substantially. This diversity, however, also reflects the great variability in production systems within regions that is typically simplified to representative systems in simulations.
CO2 fertilization
We analyze the full set of 30 GGCM × GCM combinations here under the assumption that CO2 fertilization is fully effective. The central response is reported in terms of the ensemble median. The effectiveness of CO2 fertilization in the long run and at the scale of agricultural production systems is highly uncertain (Zavala et al 2008, Leakey et al 2009, Ribeiro et al 2012). For this reason, we also consider simulations with fixed [CO2] (table S2), representing the assumption that CO2 fertilization is ineffective at these scales. According to the given data availability in the ISI-MIP data archive for GGCM simulations (Rosenzweig et al 2014), we focus on the HadGEM2-ES climate model (Jones et al 2011) implementation of the different RCPs for the case of ineffective CO2 fertilization.
Aggregation
We present results aggregated to FPUs as well as globally. For the spatial aggregation we assume static current crop-specific and irrigation system specific harvested areas per simulated half-degree grid cell based on MIRCA2000 (Portmann et al 2010). Crop production (prod) is measured in peta calories (Pcal = 1015 cal) per FPU (or globally) which is computed as the sum over all grid cells p in that spatial unit, multiplying area (area), the fractional use (frac) per crop c and irrigation system i (rainfed, irrigated), the caloric density (cal) per crop and simulated changes in productivity (y) for each time step t, according to equation (1)
Ensemble corrections
In order to make absolute changes comparable between model simulations, we bias-correct simulated crop production of maize, wheat, rice and soy with gridded crop yields from Iizumi et al (2014). For that, we interpolate the Iizumi data from their original 1.125° resolution to the GGCM resolution of 0.5° and aggregate these to the level of Food Production Units (an intersection of major river basins and national boundaries; FPUs, see figure S1) (Cai and Rosegrant 2002, Kummu et al 2010) and global levels. A model-specific correction factor is then derived per FPU to scale GGCM simulations so that simulated FPU-level production averaged over the reference period matches the observed levels. This approach is analogous to the bias-correction commonly applied to GCM results.
The PEGASUS model does not simulate rice. Therefore, when analyzing changes in total calorie production of the four crops, we use the ensemble median of rice simulations from the other five models in place of the missing PEGASUS rice results. In this way, total calorie projections of PEGASUS are not biased compared to the other GGCMs that include rice as a third C3 crop. For more details of this approach see Elliott et al (2014a). PEGASUS was omitted in the rice-only analyses presented here.
Metrics
All changes in agricultural production are represented as absolute changes of the bias-corrected 30-year period at the end of the 21st century (2070–2099) with respect to the baseline period (1980–2009), see equation (2)

Here  depicts the median of all
  (as computed in equation (2)) from all GGCM × GCM combinations considered. Even under strong climate change impact scenarios (here represented by the five RCP8.5 scenarios), climate change impacts on agriculture are not uniformly negative and do not necessarily scale unidirectionally with climate change. The high latitudes, which currently experience strong low-temperature limitations, typically profit from climate change, especially if full effectiveness of CO2 fertilization is assumed (Rosenzweig et al 2014). Under climate mitigation, both the impacts of climate change alone, and the combined impacts of climate change and CO2 fertilization effects, can be not only dampened or fortified versions of the impact under non-mitigated climate change, but they can also differ in sign. That is, crop-region combinations that see positive impacts from climate change (or from the combined climate change and CO2 fertilization effects) under non-mitigated climate change may see negative impacts under climate mitigation scenarios (or vice versa).
To quantify the effects of climate mitigation on agricultural productivity, we thus need to consider both cases: (a) avoided damage due to mitigation ( and (b) lost potentials due to mitigation (
 Avoided damage metrics (
 are computed for all crop-region combinations, which are projected to see net declining productivity under non-mitigated climate change (RCP8.5 scenarios). Lost potentials metrics (
 are computed for all crop-region combinations which are projected to see net increasing productivity under non-mitigated climate change (RCP8.5 scenarios). These two cases are mutually exclusive and can thus be presented in maps. We represent the metrics in relative form, i.e. percentage of damages avoided and percentage of potentials lost to allow for a direct comparison between FPUs. At the global aggregation, this is, however, weighted by the total production per FPU to avoid overly emphasizing regions with little contribution to overall crop production in the figures shown. We show maps of absolute changes in production per FPU in the appendix (figure S2). The metrics are defined as follows

and

As such, the avoided damages of mitigation ( range from
  and
and  with positive values indicating benefits of mitigation from avoided damages and negative values indicating that mitigation would make negative impacts more negative. Similarly, the lost potentials from mitigation (
 range from
  and
and  with positive values indicating that the benefit of climate change is greater after mitigation and negative values indicating that the benefit of climate change is reduced by mitigation.
Quantifying uncertainties
In the presentation of results, we focus on the ensemble median of the 30 simulation sets (5GCMs × 6GGCMs) available for RCP8.5 and for RCP2.6. We dissect the uncertainties in the global climate change impact assessment induced from GGCMs and CO2 fertilization by conducting an ANOVA analysis using the aov function in R (R Development Core Team 2014). To understand the role of CO2 fertilization, we focus on the HadGEM2-ES scenarios, as data is not available for the other GCMs for the assumption of ineffective CO2 fertilization.
Results
Impacts of climate change and CO2 fertilization
Unmitigated climate change, as e.g. represented by the RCP8.5 emission scenario (Riahi et al 2011, van Vuuren et al 2011b) poses a significant threat to agricultural production, especially in lower latitudes even if CO2 fertilization is assumed to be fully effective in enhancing yields (figure 1). Of the four individual crops analyzed here, maize (figure 1(B)) shows the strongest negative impact of climate change. As for all C4 crops, the photosynthesis of maize is not directly stimulated by elevated [CO2]. Higher latitudes are projected to respond positively to climate change and CO2 fertilization. At the global scale, unmitigated climate change under the RCP8.5 scenario leads to a median reduction in crop production of the four major crops wheat, maize, rice and soy by 94 Pcal, or just less than 2% of total production. Among the full set of GCM × GGCM combinations with fully effective CO2 fertilization, the global RCP8.5 impact ranges from a caloric increase by 2565 Pcal to a decrease by 1047 Pcal (blue bars in figure S3).
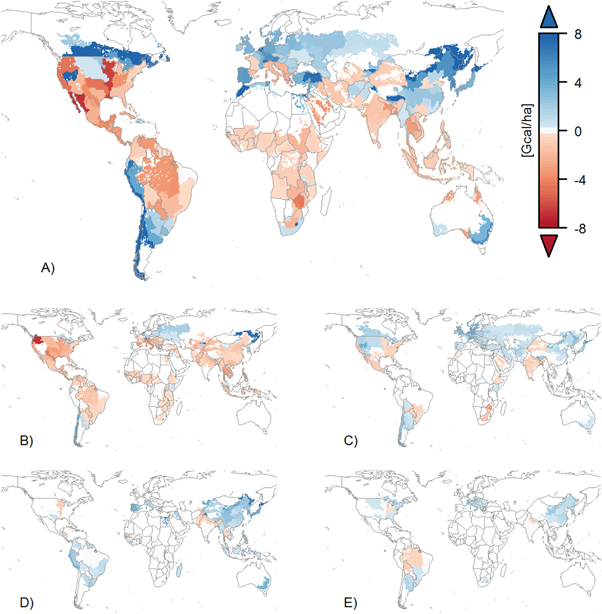
Figure 1. Simulated climate change impacts on agricultural productivity (Gcal/ha) in each FPU for the four major crops maize, wheat, rice and soy for RCP8.5 assuming full effectiveness of CO2 fertilization depicted as the median change of all GGCM × GCM combinations (n = 30). The top panel (A) shows the combined climate change and CO2 fertilization effect for the combined agricultural productivity of all four crops combined; panels (B) (maize), (C) (wheat), (D) (rice) and (E) (soy) show the changes in agricultural productivity for individual crops. Changes in productivity are computed at the FPU level but are displayed only for regions currently cropped for maize, wheat, rice and soy (Portmann et al 2010), i.e. white areas do not grow these crops.
Download figure:
Standard image High-resolution imageClimate change mitigation, i.e. substantially lower [CO2] and other greenhouse gases by 2100, is represented by the RCP2.6 scenario (van Vuuren et al 2011a), which peaks in around 2050 at 443 ppmv [CO2] and declines to 421 ppmv by 2100. Under climate mitigation, agricultural production is not only subject to less severe increases in temperature, but also to less CO2 fertilization (if assumed to be effective) and circulation patterns and associated changes in precipitation can be different from both current day and RCP8.5 patterns.
Nonetheless, climate change impacts on agricultural production display similar large-scale patterns, with stronger impacts in the lower latitudes and beneficial effects in the higher latitudes, where crop growth is often temperature limited in at least parts of the year. However, impacts on agricultural productivity are generally less pronounced (figure 2), and may also change sign in some FPUs, both for individual crops (e.g maize in eastern USA) and for overall agricultural productivity (e.g in Europe).

Figure 2. As figure 1 but for RCP 2.6, representing a strong climate mitigation scenario.
Download figure:
Standard image High-resolution imageUnder strong mitigation efforts (RCP2.6), combined climate change and CO2 fertilization effects lead to a small median increase in agricultural production at the global scale of 73 Pcal (1%, blue in figure S4), while climate change alone (assuming no CO2 fertilization) leads to a slight reduction of global agricultural production (red bars in figure S4).
Impacts of GHG mitigation on agricultural productivity
There are many regions that profit from climate mitigation (i.e. lower [CO2] and less climate change) either because projected damages from climate change on agricultural productivity can be (partially) avoided (green areas in figure 3) or because yield increases under climate mitigation (RCP2.6) are projected to exceed the projected increases in the unmitigated climate change scenarios (RCP8.5, blue in figure 3). These regions often coincide with regions that are under high or extreme risk of food insecurity (Rosen et al 2015), such as many African countries and India, but also cover main producer areas, such as the United States of America (figure 2). Other regions see detrimental effects of climate mitigation on agricultural productivity, mainly because yields are projected to increase more strongly under unmitigated climate change (RCP8.5) than under climate mitigation (RCP2.6, red areas in figure 2(a)).

Figure 3. Effects of climate mitigation on agricultural productivity for the four crops combined (A) or individually for maize (B), wheat (C), rice (D) or soy (E). Green and purple areas show regions where unmitigated climate change (RCP8.5) is projected to reduce agricultural productivity. In green areas, this damage can be reduced by climate mitigation. Amplified damage (purple) through mitigation is very rare and only occurs in regions with very small damages under unmitigated climate change (compare figure 1). Red and blue areas show regions where unmitigated climate change is projected to increase agricultural productivity. In red areas this additional potential is (partially) lost under climate mitigation, while it is further increased in blue areas. Mitigation effects are depicted in percent, relative to the projected changes in agricultural productivity under unmitigated climate change and [CO2]. The metrics λ and β are mutually exclusive and can thus be displayed in combination without loss of information. See main text for definitions.
Download figure:
Standard image High-resolution imageCrop models indicate that climate mitigation can alleviate all negative impacts on agriculture at the global scale and even supply a small bonus of 2% if CO2 effects can be fully realized (table 1). There are also substantial regional differences between the individual crops (figures 3(B)–(E)). Maize, a C4 crop that sees no direct stimulation of photosynthesis under elevated [CO2], displays the strongest overall response to climate change and has the largest potential to profit from climate mitigation, while the other three crops display mixed responses.
Table 1. ANOVA results for HadGEM2-ES, assuming no CO2 fertilization, describing the shares of overall variance explained by the GGCMs, the RCPs and their interaction in percent. The standard deviation (Pcal) indicates how variable projections are across RCPs and GGCMs.
| All crops | Maize | Wheat | Rice | Soy | |
|---|---|---|---|---|---|
| GGCM share (%) | 29.6 | 56.3 | 15.5 | 17.5 | 21.9 |
| RCP share (%) | 66.9 | 36.4 | 71.8 | 80.9 | 74.8 |
| GGCM × RCP interaction share (%) | 3.5 | 7.3 | 12.8 | 1.6 | 3.2 |
| Standard deviation (Pcal) | 751 | 393 | 192 | 158 | 85 |
Climate mitigation efforts do not only reduce the median damage projections for agricultural productivity, but the sign of changes is also uncertain in projections of crop productivity under climate change and CO2 fertilization. As such, climate mitigation (i.e. RCP2.6 versus RCP8.5) also makes changes to lower agricultural productivity ( less likely (figure 4 (A) versus (B)).

Figure 4. Likelihood of changes to reduced productivity under climate change and full effectiveness of CO2 fertilization for total production of maize, wheat, rice and soy in percent of scenarios studied. As climate impact projections on agricultural productivity can also differ in sign, we define the likelihood of change as the percentage of scenarios that lead to reduced agricultural productivity compared to the baseline productivity (1980–2009), assuming that all projections are equally likely. Panel (A) is for 5 GCMs under RCP8.5 (n = 30), panel (B) for 5 GCMs under RCP2.6 (n = 30). Changes are computed at FPU level but displayed only for regions currently cropped for maize, wheat, rice or soy (Portmann et al 2010).
Download figure:
Standard image High-resolution image
Uncertainty in future projections of agricultural productivity
At the global level, positive and negative impacts in the different regions compensate each other and global change impacts are thus projected to be relatively small for the median case. However, the simulation results of changes in global agricultural productivity are subject to large uncertainties from differences in RCPs, GCMs and GGCMs. With assumed full effectiveness in CO2 fertilization, total agricultural productivity on currently cultivated areas increases by 112 Pcal from 1980–2009 to 2070–2099 under climate mitigation (RCP 2.6, figure S4) and decreases by about 37 Pcal under unmitigated climate change (RCP 8.5, figure S3).
If CO2 fertilization is assumed to be ineffective, crop production in almost all regions profits from climate mitigation (figure S5).
If CO2 fertilization is assumed to be ineffective, projections of global crop productivity are subject to uncertainties from the emission pathway (RCP2.6 versus RCP8.5) and the GGCM used. The role of different GCMs cannot be investigated here, so for this analysis is based on HadGEM2-ES only. In this setting, the RCP determines the amplitude of climate change while CO2 concentrations are assumed to be constant. We find that the GGCMs contribute relatively little to overall uncertainty, except for maize (56% of overall variance), whereas the emission pathway (RCP) and thus the strength of climate change strongly affects the projected changes in agricultural productivity (table 1).
If CO2 fertilization is assumed to be fully effective (table 2), the relative shares are reversed (except for maize). The RCP-induced variance becomes significantly smaller across all crops and the GGCM-induced variance becomes dominant. Also the GGCM × RCP interaction contributes larger shares to the overall variance, which is higher when CO2 fertilization is included for the combination of all four crops, and rice and soy separately, but lower for maize and wheat.
Table 2. As table 1, but assuming full effectiveness of CO2 fertilization.
| All crops | Maize | Wheat | Rice | Soy | |
|---|---|---|---|---|---|
| GGCM share (%) | 80.9 | 72.1 | 79.3 | 75.1 | 82.3 |
| RCP share (%) | 1.5 | 15.1 | 0.6 | 1.6 | 0.1 |
| GGCM × RCP interaction share (%) | 17.6 | 12.8 | 20.0 | 23.4 | 17.6 |
| Standard Deviation (Pcal) | 822 | 357 | 143 | 303 | 105 |
If considering the three sources of uncertainty CO2 fertilization, RCP and GGCM in the HadGEM2-ES scenario ensemble (n = 24), the attribution of variance to the different drivers becomes more mixed. Interaction of the different sources of uncertainty can make up to 38% of overall uncertainty (rice, table S3). Across the different FPUs, this pattern is largely consistent, although shares vary across FPUs, but not necessarily in clear patterns (figure S6).
Without CO2 effects, climate change impacts are more severe but can be alleviated significantly (avoiding damage of ∼1200 Pcal or 81%) by climate mitigation at the global scale. While the largest uncertainty is clearly the magnitude of CO2 fertilization, which often changes the sign of climate change impacts in many regions (figure S7). GCMs also contribute to overall uncertainty despite the use of bias correction (table S4), but their contribution is relatively small compared to the contribution of GGCMs. The effect of GCM uncertainty cannot be directly compared to the effect of CO2 uncertainty, as the two assumptions on CO2 fertilization are only available for one GCM (HadGEM2-ES). Across the different FPUs, the GGCM uncertainty is typically dominant (compared to the GCM- and RCP-induced uncertainty), but there are various FPUs, where the GGCM-induced uncertainty contributes a third or less to overall uncertainty, especially for many wheat areas (figure S8).
Discussion
Data caveats
We use data of the ISI-MIP fast-track data archive, which is, because of its comprehensiveness and global coverage, the best data base available for studying the effects climate mitigation on agricultural productivity. However, the available data is not as comprehensive as desirable and is subject to some constrictions that need to be considered in the interpretation.
The general assumption in the ISI-MIP fast-track data is that agricultural systems do not adapt to climate change, often implemented in the GGCMs as static sowing dates and static parameters for crop varieties and management, although GEPIC, PEGASUS and LPJ-GUESS allow adaptation of some of these variables (Rosenzweig et al 2014). As such, the adaptive capacity in the flexibility of agricultural production (e.g. cropping seasons, soil management, varieties) and the continuous efforts to develop better technological means (e.g. breeding new varieties) are likely substantially underestimated in the analyzed data set.
Many aspects that were found to significantly affect agricultural production are currently not considered in these simulations, such as direct heat stress (Teixeira et al 2013, Deryng et al 2014, Siebert et al 2014), ozone damage (Fuhrer 2003, Hatfield et al 2011, Pleijel and Uddling 2012), altered pressure from weeds, pests and diseases (Dermody et al 2008, Zavala et al 2008, Hatfield et al 2011). A notable exception is the PEGASUS model (Deryng et al 2011, Deryng et al 2014), which explicitly accounts for heat stress and which typically projects more significant reductions in agricultural productivity than the rest of the model ensemble (Rosenzweig et al 2014).
Also, we assume static current day cropping patterns (Portmann et al 2010) in the analysis, while also adjustments in land-use patterns would lead to reduced climate change impacts (Nelson et al 2014a, 2014b). The present analysis thus represents a comparison of the climate change pressure on the adaptive capacity of the agricultural sector rather than a projection of how well agricultural production systems will perform under climate change. The effects of climate mitigation as analyzed here are thus also indicative of how production challenges can be reduced through reduced GHG emissions and subsequent reduced climate change.
Drivers of uncertainty
There is large variance across the different projections of climate change impacts on agricultural production, constituting the uncertainty in these projections. The attribution of this uncertainty to the different drivers is complicated by incomplete data coverage as the assumption on ineffective CO2 fertilization was only simulated for one GCM (HadGEM2-ES). The overall variance (shown as the standard deviation in tables 1, 2 and S3, which is the square root of the variance but is expressed in the same unit as the data, Pcal) increases once CO2 fertilization effects are included, except for maize and wheat. However, the attribution is mostly reversed under the opposite assumptions on the effectiveness of CO2 fertilization. The importance of the emission path (RCP) for agricultural productivity is high if no CO2 fertilization is assumed, because climate change is the only driver and the 2 RCPs compared are very different. However, once CO2 fertilization is included, it compensates or even overcompensates much of the climate change impacts, so that the two RCPs are not that different. The strong climate change scenario (RPC8.5) is combined with strong CO2 fertilization, whereas the moderate climate change scenario (RPC2.6) is combined with moderate CO2 fertilization. Whereas the variance over the RCPs declines, variance over the GGCMs increases as new processes (stimulation of photosynthesis in C3 plants, reduced water consumption in all plants) and feedbacks (e.g. soil moisture) come into play. This increase in GGCM-induced variance is stronger than the reduction in RCP-induced variance for rice, soy and the combination of the four crops, but not for maize and wheat. The increasing contribution of the interaction of RCP and GGCM to overall variance (ranging from 12% for maize to 23% for rice, table 2) compared to the assumption of ineffective CO2 fertilization (ranging from 2% for rice to 13% for wheat, table 1) indicates that the CO2 effects are implemented differently in the GGCMs and substantial parts of the overall variance can be attributed to the RCP × GGCM combination. The uncertainty from GCMs in the data sample used here (five bias-corrected GCMs, selected by first availability, see Hempel et al 2013) is relatively small (2% for rice, 13% for wheat) if CO2 effects are considered (appendix table S4). This, however, includes the compensation of climate effects with CO2 fertilization effects so that the RCP-induced variance is mostly important in the interaction of RCP × GGCM. This indicates that the individual GGCMs respond differently to the strength of climate change and the (partially) compensating effects of CO2 fertilization. These patterns are variable in space, as there are some regions with greater disagreement between GCM projections and others with very similar projections. Overall, however, the GGCM-induced uncertainty outweighs the other sources of uncertainty.
The strong positive effect of high [CO2] on simulated crop yields does not only constitute a strong source of uncertainty in the GGCM projections. The assumption on no effectiveness in increasing agricultural yields is justified as there is also substantial uncertainty in the overall effects of CO2 fertilization. This includes co-limitations from water and nutrients, altered competition with weeds and susceptibility to pests and diseases (Dermody et al 2008, Zavala et al 2008) and the uncertainty of how well stimulated photosynthesis can actually be translated into higher yields. This includes downregulation of photosynthesis (Ainsworth et al 2002, 2008, Long et al 2006, Tubiello et al 2007), co-limitation through environment-controlled limitations to growth (Fatichi et al 2014) or altered chemical composition and subsequent partitioning of plant biomass (Ribeiro et al 2012). All these factors are currently not included in crop model simulations other than in aggregate parameters (e.g. scaling factors for RUE, see table S2) and thus render the CO2 effect estimated here as optimistic. However, as some of these effects can be managed (e.g. pest control) or addressed in breeding strategies (e.g. partitioning) it is impossible to assess the magnitude of these effects. From a nutritional perspective, elevated [CO2] could also lead to reduced micro-nutrient concentration, possibly posing a threat to nutrition security, especially in less developed regions (Müller et al 2014, Myers et al 2014).
All six GGCMs have been applied and evaluated in climate change impact studies before (table S1), but the models' performance has not been tested in a consistent evaluation framework. The three ecosystem-type models (LPJ-GUESS, LPJmL, PEGASUS) typically show more pronounced responses than the site-based models (EPIC, GEPIC, pDSSAT). LPJ-GUESS and LPJmL, which often show considerably stronger responses to CO2 fertilization than the other models, also do not account for changing levels of nutrient limitations under evolving climate and [CO2]. As such, these two models assume an adaptation to changed conditions through increased fertilizer supply and are therefore not directly comparable to the other models. LPJ-GUESS and PEGASUS also assume adaptation in varieties (growing season length), and PEGASUS and GEPIC also assume adaptation in sowing dates not only within a fixed planting window as EPIC, pDSSAT and LPJ-GUESS do. As such, assumptions on management and on the flexibility of agricultural production systems also constitute a significant source of differences between models' projections. PEGASUS, despite allowing for adaptation in sowing dates and varieties, is typically the most pessimistic (Rosenzweig et al 2014).
The diversity in model setups in the ISI-MIP model ensemble employed here with respect to growing seasons or management systems (e.g. potential versus actual yields, explicit nutrient stress, calibrated productivity levels, see table S1) reflects part of the diversity in actual production systems. However, it may also introduce confounding dynamics such as additional water stress if intensity levels are overestimated or if the growing season is not well parameterized. As such, the assumption that model biases can be corrected by a linear correction factor may not hold, but will have to be addressed by improved and harmonized data on management in future simulations (e.g. Elliott et al 2015). A global crop model benchmark system is currently under development in AgMIP GGCMI (Elliott et al 2015) and will facilitate structured model evaluation and subsequent improvements. We thus focus on the model ensemble median here, which has been shown to be a robust estimate for crop model projections (Bassu et al 2014, Martre et al 2014, Asseng et al 2015).
Despite these important qualifiers, GGCM simulations are the best tool available to assess climate change impacts and the role of mitigation efforts for agricultural production systems. The large model uncertainty is largely a product of the multiple complex interactions in soils and plants as well as uncertainties in the parameterization of management practices and crop varieties. This highlights the value of such complex models and the diversity of these in the present modeling ensemble. The GGCM Intercomparison (Elliott et al 2015) of the AgMIP (Rosenzweig et al 2013) has set out to better assess current model skills, identify deficiencies and to improve on these, where data availability and process understanding allow for it.
Implications of climate mitigation for agricultural productivity
Agricultural productivity under given management is driven by various aspects of climate change. This includes changes in temperatures (min, max, mean), precipitation (amount and temporal distribution), and in cloudiness, which subsequently affects the available energy from radiation and the corresponding evaporative demand of the atmosphere. Atmospheric CO2 concentrations do not only drive this climate change and but also stimulate photosynthesis in C3 plants (such as wheat, rice and soy) and decrease water requirements. These climate-change driven alterations of growing conditions can thus lead to diverse changes, depending on their direction (e.g. dryer or wetter), amplitude, and the starting conditions (e.g. cold- or heat-limited growing season).
As such, climate mitigation efforts, which lead to lower greenhouse gas concentrations in the atmosphere (largely realized through lower [CO2]), have mixed effects on agricultural productivity. In summary, climate change and CO2 fertilization lead to damages to agricultural productivity in the lower latitudes and to new production potentials through higher yields in higher latitudes as well as in water-limited regions where water is used more efficiently by plants (Deryng et al under review). Consequently, climate mitigation measures through reduction of [CO2] typically reduce the damages in warmer regions and leads to losses of new production potentials in cooler regions. Even if impacts are relatively small at the global aggregation, climate mitigation would strongly benefit many less developed and food insecure countries, as e.g. in Africa and Asia (Rosen et al 2015), which would counteract the growing asymmetries between developed and developing countries (Fischer et al 2005).
Conclusions
Climate change impacts on agricultural production can be greatly reduced by climate mitigation at the global scale and also in most regions for maize, wheat, rice and soy. However, associated reductions in [CO2] also lead to reduced positive effects in CO2 fertilization if these can be materialized by farmers in the fields. Based on the ensemble median of five climate models and six GGCMs, we find that climate mitigation has case-specific effects on agricultural productivity. While overall slightly positive at the global aggregation level, individual regions display very different responses to climate mitigation. Agricultural productivity in many regions shows a positive response to climate mitigation, either through avoided damages or through higher yield increases than under the unmitigated climate change scenarios. These regions include many regions that are currently food insecure (Rosen et al 2015) or are major food producers (e.g. USA). Increased agricultural productivity in other regions, partly through warmer temperatures in cold-limited regions but mainly through the projected positive effects of CO2 fertilization, cannot directly compensate the overall reduction and would also require substantial changes in production patterns globally in order to exploit their potential. The diversity in response across regions and crops to climate mitigation reflects the diversity in climate change impacts. This analysis of biophysical benefits and losses in agricultural productivity through climate mitigation demonstrates the potential and importance of climate mitigation, especially for many less-developed countries. Developing a comprehensive assessment of climate mitigation effects on the agricultural sector will not only require accounting for changes in production and consumption patterns (Nelson et al 2014a, 2014b) but also to better understand and project how agricultural productivity can be secured or enhanced through changes in agricultural management, including assessments of the associated economic costs. This task remains a significant challenge and will have to be addressed by global crop modelers also in cooperation agricultural economists, as e.g., in AgMIP.
Acknowledgments
CM acknowledges financial support from the MACMIT project (01LN1317A) funded through the German Federal Ministry of Education and Research (BMBF). The contribution by TP was funded by the European Commission's 7th Framework Programme, under Grant Agreement numbers 282672 (EMBRACE) and 603542 (LUC4C) and was supported, in part, by the German Federal Ministry of Education and Research (BMBF), through the Helmholtz Association and its research program ATMO.