

Abstract
Efforts to mitigate and adapt to long-term climate change could benefit greatly from probabilistic estimates of cumulative carbon emissions due to fossil fuel burning and resulting CO2-induced planetary warming. Here we demonstrate the use of a reduced-form model to project these variables. We performed simulations using a large-ensemble framework with parametric uncertainty sampled to produce distributions of future cumulative emissions and consequent planetary warming. A hind-cast ensemble of simulations captured 1980–2012 historical CO2 emissions trends and an ensemble of future projection simulations generated a distribution of emission scenarios that qualitatively resembled the suite of Representative and Extended Concentration Pathways. The resulting cumulative carbon emission and temperature change distributions are characterized by 5–95th percentile ranges of 0.96–4.9 teratonnes C (Tt C) and 1.4 °C–8.5 °C, respectively, with 50th percentiles at 3.1 Tt C and 4.7 °C. Within the wide range of policy-related parameter combinations that produced these distributions, we found that low-emission simulations were characterized by both high carbon prices and low costs of non-fossil fuel energy sources, suggesting the importance of these two policy levers in particular for avoiding dangerous levels of climate warming. With this analysis we demonstrate a probabilistic approach to the challenge of identifying strategies for limiting cumulative carbon emissions and assessing likelihoods of surpassing dangerous temperature thresholds.
Export citation and abstract BibTeX RIS

Content from this work may be used under the terms of the Creative Commons Attribution 3.0 licence. Any further distribution of this work must maintain attribution to the author(s) and the title of the work, journal citation and DOI.
Changes were made to this article on 12 February 2016. The acknowledgments were updated.
1. Introduction
A growing body of climate research has established a strong relationship between cumulative anthropogenic carbon emissions and subsequent planetary warming (Matthews et al 2009, Meinshausen et al 2009, Myles et al 2009). This direct and time-insensitive relationship is increasingly recognized as a powerful mechanism to inform policy decisions related to allocating carbon emissions between countries and assessing what fraction of proven fossil energy reserves must be left unexploited to stay below a given climate threshold (e.g. Zickfeld et al 2009, Matthews et al 2012, Frame et al 2014, Matthews 2014, Raupach et al 2014, Gignac and Matthews 2015).
At the same time, a parallel and extensive body of literature has focused on modeling emissions as a function of social, technical or economic (hereafter 'human system') trends (e.g. Edmonds and Reilly 1983, Dowlatabadi 1998, Tol 2005, Kim et al 2006, Nordhaus 2008, Mastrandrea 2010, Clarke et al 2014) using integrated assessment models (IAMs). Among other applications, IAMs form the basis for calculating emission curves consistent with the representative concentration pathways (RCPs) used by the Intergovernmental Panel on Climate Change (IPCC) (van Vuuren et al 2011). In some cases, IAM studies attempt to identify optimal social and economic pathways consistent with achieving specific climate mitigation targets, emissions constraints or carbon price trajectories (Clarke et al 2014), while in others they are used to explore the time-evolution of the impact of policy scenarios without seeking optimality (Butler et al 2014).
These two efforts are contributing to growing understanding of coupled human/climate system dynamics during the Anthropocene (Zalasiewicz et al 2011) in which human activities are increasingly dominating many aspects of Earth's functional systems. Both approaches provide context for recent and ongoing policy efforts to decrease global emissions to acceptable levels (European Commission 2014, Stern et al 2014) as well as policy efforts supporting ongoing fossil energy development (e.g. Government of Australia Bureau of Resources and Energy Economics 2014, Government of Canada Major Projects Management Office 2014). However, gaps remain between long-term human system projections and climate projections. For example, model frameworks that link human system factors to total historical-to-future cumulative carbon emissions and related fully realized planetary warming remain scarce. Furthermore, as noted in e.g. Webster et al (2012), existing studies relating human system trends to climate evolution are typically either deterministic or do not sufficiently explore parameteric uncertainty in model inputs or model parameters. Consequently, substantial challenges remain in assessing the sensitivity of long-term climate warming to uncertain human system and physical constraints (e.g. Schwanitz 2013, Butler et al 2014), generating probabilistic information for climate mitigation and adaptation policymaking (e.g. Rogelj et al 2013) and managing the risk of passing dangerous climate thresholds (e.g. Schneider and Mastrandrea 2005, McJeon et al 2011, Webster et al 2012). All of these efforts would benefit greatly from probabilistic modeling of future cumulative emissions to support robust decision-making.
Motivated by these challenges, here we develop and use a large ensemble of reduced-form numerical model simulations to generate a distribution of historical-to-future cumulative CO2 emissions and planetary warming resulting from fossil fuel burning. We adopted a sensitivity analysis approach which relies on latin hypercube sampling to comprehensively assess the model response to specified ranges of uncertain model parameters. The dynamical model uses conservation of carbon between the geological carbon reservoir (primarily sedimentary rocks) and the exogenic carbon cycle (primarily atmosphere, ocean and biosphere) as the fundamental governing equation. Using the model, we are able to successfully: (a) replicate recent historical emissions trends and bracket future RCP and Extended Concentration Pathway (ECP) emission scenarios (van Vuuren et al 2011, Meinshausen et al 2011); (b) probabilistically assess total cumulative emissions and planetary warming due to past and future fossil fuel emissions; (c) assess the likelihood of crossing dangerous climate thresholds; (d) identify human system factors most responsible for affecting cumulative carbon emissions; and (e) interpret model sensitivities in the context of long-term climate mitigation policies. These results are described in the following sections.
2. Model description
Like many IAMs, the present model framework (described in greater detail in the supplemental information, including full equations, flowcharts and a link to the source code repository) generates time-evolving projections of CO2 emissions due to fossil fuel combustion. However, whereas IAMs are typically predicated around prognostic simulation of socioeconomic variables, here we adopt a reduced-form physically based approach built around an ordinary differential equation describing the global geological carbon reserve response to changing fossil energy discovery and extraction/consumption rates. Fossil energy discovery is regulated by changing demand for energy (itself dependent on population growth and per-capita energy use), resource depletion and the fraction of global energy demand supplied by fossil energy-based energy. Consumption is similarly regulated by the fraction of global energy demand that is supplied by fossil energy. This fraction is determined by a relative comparison of fossil versus non-fossil prices where non-fossil energy prices are defined to decrease over time. When the two prices reach near-parity due to opposing cost trajectories a smooth transfer to non-fossil energy sources occurs via a logistic equation that contains parameters reflecting social, technological and infrastructure controls on the diffusion of new non-fossil energy technologies into the global energy system. We adopt units of $/J to represent our unit of analysis for energy prices: this measure degrades in an absolute sense in the future but remains an accurate relative unit for comparing energy prices at a given time. At the point where fossil energy provides <5% of total energy demand (representative of a near-complete transfer to non-fossil-based energy system) cumulative carbon emissions are tallied and converted to global temperature changes values using the transient carbon response to cumulative carbon emissions (TCREs). This relationship approximates the near-linear response of global temperatures to cumulative emissions (Collins et al 2013, Gillett et al 2013) up to 3 Tt C after which the response in our model progressively saturates (Leduc et al 2015). This saturation combined with the lack of potentially large carbon-climate feedbacks (i.e. permafrost carbon and marine methane hydrates) in the original TCRE-estimating models likely makes our planetary warming estimates conservative. The overall model design approximates the relevant dynamics of the modern energy/climate system barring unforeseen shocks or discontinuities, while still allowing for sensitivity analyzes of simulated emission scenarios, cumulative emissions and planetary warming.
We made no attempt to constrain future scenarios to target particular climate adaptation or mitigation targets (as in the case of so-called 'policy optimization models', Nordhaus 2011). Instead, we generated a large ensemble of emissions scenarios and the resulting cumulative emissions and warming using latin hypercube sampling (see supplementary material; Helton and Davis 2003) of uncertain parameter values (e.g. Webster et al 2012, Schwanitz 2013, Butler et al 2014). Practically, each ensemble member represents a 'policy evaluation' (in the parlance of (Nordhaus 2011)) where the policy level in each simulation is determined by latin hypercube sampling of policy-relevant parameters. By this approach we consider the human system to evolve within a parameter space that operates under the assumption of no planned coordination across multiple policy fronts (for any given ensemble member). Output from this Monte Carlo-like approach allows for probabilistic exploration of the system response to parametric uncertainty in both an integrated and parameter-by-parameter sense. A result of this methodology is that interpretation of the results differs significantly from interpretation of (for example) RCP scenarios, which reflect specific policy choices that are engineered to arrive via specified pathways at predetermined year 2100 radiative forcings.
Of 28 relevant model parameters, we identified 17 with significant parametric uncertainty and assessed the spread in model response resulting from the variation of these parameters (highlighted in bold in section 1 of the supplementary material and listed in table 1; non-varied parameters listed in supplementary material table 1). We defined probability distributions for each uncertain model parameter to reflect most-likely and marginal expected values. Given a lack of published robust parametric distributions for most input parameters, we assumed normal distributions with ±2-standard deviation (∼95 percentile) ranges from each parameter based on minimum and maximum estimates from published estimates (details in supplementary material) or where necessary our own expert judgement3 . The approach was chosen to bracket either expert or author-assessed bounds but also retain small samples of extreme parameter values; for policy-relevant parameters this approach resulted in parameterized policies ranging from essentially non-existent to very robust. Importantly and as discussed further below, we do not preclude future changes to the parameter distributions utilized here: in fact, change is likely in response to updated parameter estimates.
Table 1. Uncertain parameters, and parameter mean/standard deviation values, varied in the course of the ensemble of simulations. Sources for parameter ranges are as follows: (1) Rogner et al (2012); (2) BP (2014); (3) Author parameter estimate (2015); (4) International Energy Agency (2014); (5) Lontzek et al (2015); (6) Gerland et al (2014); (7) World bank data (2014); (8) International energy agency statistics (2014); (9) Collins et al (2013).
| Symbol | Units | Mean/σ | |
|---|---|---|---|
| Initial fossil fuel reservoir reserves |

| Tt C | 1.5/0.231 |
| Maximum fossil fuel resources |

| Tt C | 5.1/1.31 |
| Initial fossil fuel cost |

| $/brl oil | 75/122 |
| Fossil energy emission factor trend |

| g C/J/yr | 8.0×10⁻⁸/1.0×10−8 3 |
| Final fossil energy emission factor |

| g C/J | 2.1×10⁻⁵/2.6×10−6 3 |
| Initial non-fossil energy unit cost |

| $/MWh | 400/504 |
| Minimum non-fossil energy unit cost |

| Fraction of initial cost | 0.2/0.053 |
| Maximum carbon price |

| $/tonne C | 300/1805 |
| Carbon tax price |

| $/tonne C/yr | 7.5/1.25 |
| E-folding time of non-fossil energy cost decline |

| Yr | 15/2.54 |
| Maximum population |

| Billion people | 11/0.686 |
| Population increase rate |

| %/yr | 0.019/0.0027 |
| Maximum per-capita energy consumption |

| GJ/yr | 200/328 |
| Per- capita energy consumption increase |

| %/yr | 0.01/0.00228 |
| Fossil to non-fossil energy transfer delay |

| Unitless | 0.6/0.23 |
| Fossil to non-fossil energy transfer fade strength |

| Unitless | −5/0.53 |
| Transient climate response to emissions | TCRE | °C/Tt C | 1.6/0.429 |
Parameter ranges and source citations are summarized in table 1. For some parameters, following latin hypercube sampling, ranges were limited to avoid physically or numerically unrealistic model edge-case behaviors4 . 17-dimensional parameter space requires at least ∼170 simulations in order to minimally determine model output distributions (Loeppky et al 2009). Here we generated an ensemble of 100000 simulations to ensure a converged estimate of cumulative emissions and planetary warming distributions.
3. Results
3.1. Model calibration and assessment
Prior to carrying out an ensemble of future projections initialized from recent data, we performed an ensemble of hind-cast simulations to assess the model's ability to reproduce historical CO2 emission trends. We performed this hind-cast ensemble over the period 1980–2012 which corresponded to the period of time over which the necessary input and validation datasets were consistently available. Given the parameter ranges described in table 1, the model generated a spread of global energy consumption and emissions trends which compared well to historical observed trends (figure 1(a)). Initial consumption values were set based on observed consumption estimates (supplemental table 1). Subsequently, over the 1980–2012 period simulated consumption trends displayed a linear best-fit value of 8.1 EJ/yr2 and ±1 standard deviation spread of 6.8-9.5 EJ/yr2 which bracketed the observed best-fit linear trend of 7.7 EJ/yr2.
Given high observed variability in fossil energy prices (due to political events such as oil embargoes, step-function technological changes such as fracking, or economic events such as the 2008 economic recession) we chose to make the initial fossil energy price an uncertain ensemble parameter. Consequently, it is difficult to validate simulated aggregate fossil energy prices against observed historical trends. However, we do note that our ensemble-mean linear best-fit increase of 0.75%/year in the price of fossil energy (relative to the mean 1980–2012 price) is a plausible secular trend in fossil energy prices underlying the large observed price variability. The ensemble-mean historical linear best fit fossil carbon discovery rate increase (1.6 ± 0.03/0.02%/yr) overestimated the observed trend of 1.0%/year (estimated via aggregation of data in BP 2014). We note that this small bias (in absolute value) drives a corresponding positive bias in cumulative fossil energy reserve growth. However, it also hastens the approach of higher energy prices due to fossil energy resource depletion (via equation (2) of the supplementary material), with the latter effect dampening the former in terms of long-term model evolution. Thus we are are confident that this discrepancy does not significantly impact our primary results concerning cumulative emissions and net warming.
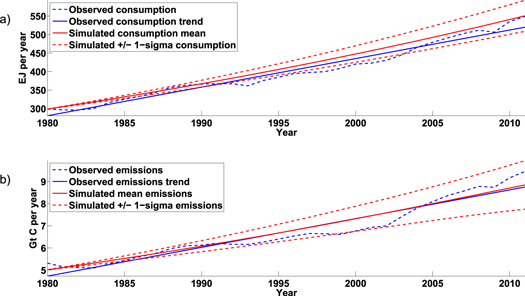
Figure 1. 1980–2012 hind-cast simulation ensemble relative to observed trends. (a) Global energy consumption; (b) global carbon emissions.
Download figure:
Standard image High-resolution imageCO2 emissions (the primary model output diagnostic, quantified in this study as mass fluxes of carbon) simulated in response to historical global consumption trends (figure 1(b)) display an ensemble-mean linear best-fit trend of 0.12 Gt C/yr2 and a ± 1 standard deviation spread of 0.09–0.16 Gt C/yr2 (figure 1(b)). This range bracketed the best-fit linear trend in observed emissions (0.13 Gt C/yr2), indicating that over the recent historical period the model generated plausible emissions trends. Given satisfactory validation of model dynamics over the available recent historical period, the model was re-initialized at the year 2012 and integrated forward in ensemble projection mode.
3.2. Emission projections
Ensemble-wide, future emissions (figure 2(a)) predominantly followed continued growth trends, during which increasing demand for energy was supplied by fossil fuels in the absence of a cheaper non-fossil energy option. Simulations typically then produced an emissions peak in conjunction with the transfer of energy supply to non-fossil sources. This peak was followed by a decline to lower emission values over a period ranging from a decade to about a century, followed in many cases by a secondary slower decline spanning several centuries. The spread in emission rates increased with time, particularly as early peaking ensemble members began rapid emissions declines over the same period time that late-peaking ensemble members exhibited continued positive emissions trends. The overall emissions distribution showed two high-probability regions, one in the near future and another during the final stage as increasing numbers of simulations reached final low-emission states.
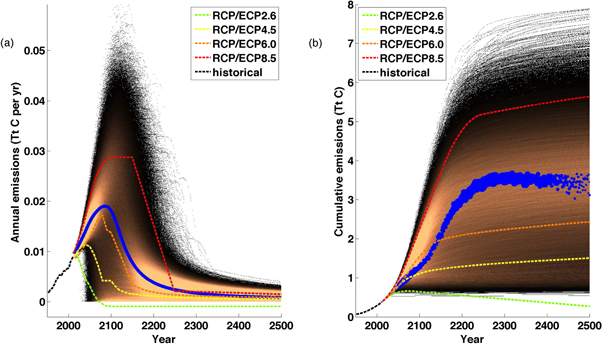
Figure 2. (a) Ensemble-wide emission projection distribution. Copper color scheme reflects relative ensemble density. Blue line: median emission projection. Colored dashed lines: RCP/ECP emission scenarios. Black dashed line: historical emissions. (b) Ensemble-wide cumulative emission projection distribution. Color scheme and lines as for (a). Blue circles: mean cumulative emissions of all simulations reaching the <5% fossil energy supply threshold at each year (one dot per year). Circle size represents the number of simulations ending in that year.
Download figure:
Standard image High-resolution imageA comparison to the established RCP/ECP emission scenarios indicated that the emission time series fell largely within the RCP4.5 and RCP8.5 scenario bounds over the 21st century. The ensemble median trend was qualitatively most similar to RCP6.0. Median emissions only began to level out at ∼2100, in contrast to RCP4.5 which demonstrated decreasing emissions earlier in the 21st century. However, it is notable that a significant number of individual simulations did indeed follow 21st century trends similar to RCP4.5. Conversely, it is also notable that a similar number of simulations displayed peak emissions well above RCP8.5 peak emissions. In contrast, the RCP2.6 scenario fell almost entirely outside of the distribution of emissions trends simulated here. This is consistent with its ambitious mitigation goals (van Vuuren et al 2011) up to and including constant negative emissions after the mid-21st century.
After peaking at ∼2100, the median emissions trend declined along a pathway roughly equidistant between the ECP4.5/ECP8.5 scenarios and most similar to RCP6.0. Similar to these scenarios (and ECP 6.0), a flattening of ensemble-wide emissions trends occurred after ∼2200. The character of the initial drop and subsequent flattening of carbon emissions trends depended upon competition between changing fossil and non-fossil energy costs. For example, in cases of rapid non-fossil energy cost declines/low initial non-fossil energy pricing, price crossover occurred before the occurrence of minimum non-fossil energy prices. Conversely, slow non-fossil energy cost declines/high initial non-fossil energy pricing allowed minimum non-fossil energy costs to be reached in which case crossover occurred due to longer term gradually increasing fossil energy prices.
Overall, given the reduced-form model design and independence between the present model and the RCP/ECP scenario progenitor models, the qualitative similarity between the distribution of future emissions simulated here and the RCP/ECP emission scenarios lends support to the ability of the model to project long-term emissions trends. We thus turn to a probabilistic evaluation of cumulative carbon emissions resulting from these long-term emission pathways.
3.3. Cumulative emission projections
As integrators of simulated emissions pathways, ensemble cumulative emission curves (figure 2(b)) initially increased rapidly, with growing ensemble spread over time. Then, following a transition to non-fossil energy sources, cumulative emission curves shallowed but still often continued to rise slowly. The range of simulated cumulative emissions at the point where fossil energy supplied <5% of global energy demand (figure 3(a)) exhibited a bimodal distribution, with a 50th percentile at 3.1 Tt C, a 5th percentile at 0.96 Tt C and a 95th percentile at 4.9 Tt C. The distribution included a smaller peak ∼1.0 Tt C and a larger peak at ∼3.4 Tt C. Sensitivity simulations indicated that the early peak is largely associated with ensemble members exhibiting early occurrences of high carbon pricing and/or low non-fossil energy pricing. Such pricing efficiently accelerates the transition to non-fossil energy sources; the relative importance of these mechanisms is discussed further in section 3.4.
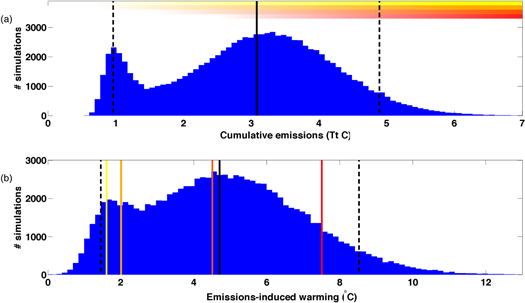
Figure 3. (a) Ensemble-wide probability distribution function of cumulative emissions at the point where the fraction of total energy demand reaches the <5% fossil energy supply threshold. (b) Corresponding ensemble-wide distribution of long-term warming. Thick solid/dashed black lines: 50th and 5/95th percentiles. Yellow line: temperature threshold (1.6 °C) on long-term Greenland Ice Sheet stability (Robinson et al 2012). Yellow-orange line: 2 °C warming threshold. Orange line: temperature threshold (4.5 °C) on terrestrial carbon sink viability (Friend et al 2014). Red line: temperature threshold (7.5 °C) on emergence of terrestrial regions with wet-bulb temperatures in excess of mammalian physiological limits (Sherwood and Huber 2010). In the warming panel (b), thresholds are expressed as single values which are projected in panel (a) as growing likelihoods of threshold crossing with increasing emissions.
Download figure:
Standard image High-resolution imageWithin given cumulative emissions percentile ranges a large diversity of emission scenarios existed, reflecting the impact of counteracting model dynamics. For example, between the 49th and 51st percentiles of cumulative emissions, peak annual emissions ranged from 11–46 Gt/yr. This highlights the potential for divergent future human system trajectories to converge to similar final cumulative carbon emission values. The 5th percentile of cumulative emissions suggests that barring an ideal combination of future human system trends (including coordinated policy trends), cumulative carbon emissions are likely to exceed 1 Tt C. Conversely, the 95th percentile suggests that there is a non-trivial chance that cumulative emissions could approach estimates of the 4–7 Gt C carbon release responsible for the Paleocene Eocene Thermal Maximum (Dunkley Jones et al 2010).
The year at which fossil energy supplied <5% of global energy demand related strongly to cumulative emissions (figure 2(b), blue circles), with simulations exhibiting early 5% threshold passing also exhibiting low cumulative emissions. The trend in annual-mean cumulative emissions (taken as the mean cumulative emissions of all simulations reaching the 5% threshold in each year) increased with time before flattening at ∼3.5 Tt C and even declining slightly after year ∼2300. Despite the potential for large cumulative emissions, simulations still predominantly ended well before complete depletion of fossil energy resources, highlighted by a median ratio of cumulative emissions to total combined reserve plus resource volumes of 49%. This qualitatively agrees with other studies (e.g. Murray and Hansen 2013) which suggest that abandonment of fossil fuels may be driven by economic factors (namely the relative cost competitiveness of fossil versus non-fossil energies) and that a significant in-ground fossil resource fraction could become stranded due to evolving economic conditions (Stern et al 2014). This stranding has implications for fossil fuel extraction corporations and governments reliant on fossil-fuel-derived revenue at time of abandonment.
3.4. Planetary warming projections
The bimodal distribution of long-term planetary warming resulting from cumulative emissions due to fossil fuel burning (figure 3(b)) incorporated both human system and physical TCRE uncertainties, with the 50th percentile of warming occurring at 4.7 °C and 5th/95th percentiles occurring at 1.4/8.5 °C above preindustrial temperatures. The two peaks in this distribution mirrored the bimodal cumulative emissions distribution but with a muted expression due to additional TCRE uncertainty; these peaks occurred at ∼1.9 °C and ∼4.7 °C. Figure 4 and supplementary figure 2 visualize the estimated influence of each parameter in determining warming, conditional on uncertainty ranges presented in table 1. Physical uncertainty related to the TCRE was the largest single control on warming with a relative contribution of 23% (with this single parameter reflecting the aggregate uncertainty associated with many individual uncertain physical processes (e.g. Gillett et al 2013). However, it is notable that the remaining human system parameter uncertainties accounted for 77% of the ensemble-wide spread, suggesting a dominance of human societal, technological and economic factors in determining future planetary warming.
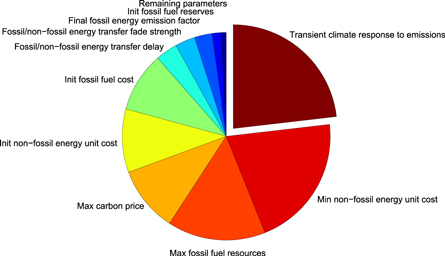
Figure 4. Relative sensitivity of planetary warming to individual parameter distributions. Larger pie slices indicate a larger parameter sensitivity. Fractions were determined via multiple linear regression of normalized input parameters on warming followed by ranking of absolute-valued linear regression coefficient magnitudes. Sensitivity to physical TCRE uncertainty is graphically separated from remaining human system uncertainties for clarity.
Download figure:
Standard image High-resolution imageAssuming that the parameter ranges capture the plausible spread of future human system dynamics, the parametric sensitivity to each parameter provides a means to assess the long-term effectiveness of different climate mitigation policy approaches. For example, the most important socio-economic parameter control on planetary warming was the minimum future non-fossil energy cost; uncertainty in this parameter accounted for 21% of the total range of net warming. The second most influential anthropogenic parameter was the maximum size of potential fossil energy resources (15%), and the third most influential was the maximum potential carbon pricing (10%). Of course, uncertainty in the input parameter ranges play a role in determining the largest parameter sensitivities. Our model results therefore suggest that reducing uncertainty in minimum non-fossil energy cost estimates, maximum potential fossil energy resources and maximum potential carbon price are the three most effective means of reducing overall human system-based uncertainty in future planetary warming uncertainty.
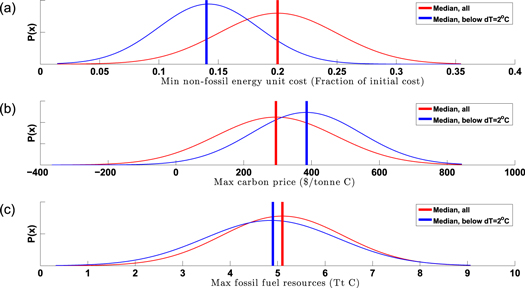
To estimate a priority for application of these policy efforts if low final cumulative emissions are to be realized, in figure 5 we isolated the subset of simulations which produced warming below 2 °C and compared the distribution of parameter values within this subset to the parameter distributions from the full model ensemble for each of the three aforementioned parameters. The maximum carbon price and minimum non-fossil energy cost distributions differ most dramatically between the full ensemble and the <2 °C subset, implying that these two parameters in particular are effective policy levers for maintaining cumulative emissions at a level consistent with 2 °C of planetary warming. This result motivates efforts to mitigate long term warming by focusing on development of low-cost non-fossil energy resources (e.g. Stern et al 2014, Wagner et al 2015) in combination with rapid increases to high carbon pricing (e.g. Rogelj et al 2013). In contrast, while reducing support for fossil energy exploration activities is also clearly an important policy tool to limit warming in general (e.g. McGlade and Ekins 2015), close similarity between the subset and full distributions for this policy lever suggest that its effectiveness is concentrated in large cumulative emissions regimes above the 2 °C threshold.
Figure 5. Distribution of top three parameters for all simulations (blue) and simulations exhibiting less than 2 °C of warming (red). Increasing offset between median locations indicates increasing parametric sensitivity below the 2 °C threshold.
Download figure:
Standard image High-resolution image
4. Discussion
In this study we have demonstrated a method for quantifying uncertainty associated with human system and climate system processes, so as to generate probabilistic projections of cumulative carbon emissions and planetary warming. These results represent a link between human behavior and long-term climate change that is not captured by studies that either focus on a limited time horizon (e.g. to 2100) or that neglect uncertainties in the climate response to particular emissions scenarios. A probabilistic perspective on long-term future CO2-induced warming is both novel and (we suggest) critical for fully understanding the climate response to CO2-producing anthropogenic activities.
Importantly, output from probabilistic cumulative carbon emission and net warming estimates is in principle directly applicable to climate risk assessment exercises. In addition, relating climate thresholds to total cumulative emissions circumvents inherent limitations in fixed-time-interval assessments that stem from the inability of these assessments to capture emissions and warming outside the interval of interest. We demonstrate these points by evaluating the probability of crossing four dangerous climate thresholds (figure 3), with likelihood terminology adopted from IPCC guidelines (Stocker et al 2013).
- (1)Robinson et al (2012) found a most-likely global temperature threshold on long-term complete Greenland Ice Sheet deglaciation of 1.6 °C above above preindustrial climate. This temperature lies within the 6th percentile of ensemble-wide simulated warming, suggesting that (to the extent that this temperature anomaly can be sustained for timescales reflective of ice sheet disintegration) 7 m of global sea level rise and resulting inundation of multiple major present-day population centers is very likely.
- (2)2 °C above preindustrial is broadly cited as a dangerous climate threshold (e.g. Sanford et al 2014). This temperature lies within the 12th percentile of ensemble-wide simulated warming, suggesting that it is likely that this this temperature threshold will be exceeded.
- (3)Friend et al (2014) estimated a likely saturation of the terrestrial carbon sink (such that this sink will not continue to absorb additional anthropogenic carbon) above ∼4 °C relative to 1971–1999 temperatures or ∼4.5 °C above preindustrial. 4.5 °C lies within the 6th percentile of simulated warming, suggesting that this threshold will as likely as not be crossed.
- (4)Sherwood and Huber (2010) highlight the emergence of land areas with wet-bulb temperatures in excess of mammalian physiological limits with ∼7 °C of warming above present-day (∼7.5 °C above preindustrial). This lies within the 88th percentile of simulated warming, indicating that crossing of this threshold is unlikely.
Importantly, we do not imply that these quantitative likelihoods be taken as final and absolute, nor that they be considered invariant with time and further policy development. In particular, there is considerable potential for intelligent policy decisions to shift the potential distribution of future warming and thereby decrease the likelihoods of these thresholds being crossed. While we have sampled here a broad range of potential future policy options, there is little 'intelligence' in the way our model selects combinations of policy-related parameters, and that there is certainly no overarching policy target or framework that guides the model's selection of particular parameter values. Our results should therefore be interpreted as a random sampling of future policy space, given the specified likelihood distributions for individual model parameters. In this context there is potential to use this modeling approach demonstrated here to identify policy combinations that maximise the chance of remaining below potentially dangerous warming levels.
In addition, there are a number of avenues for refinements to input parameter distributions and additional structural model improvements which deserve noting for their potential to change our quantitative results. For example, a disaggregation of both fossil and non-fossil energy sources (e.g. Edmonds and Reilly 1983) would allow for a more realistic form of energy competition that would (for example) prognostically shift to coal-based energy usage as oil resources diminished. A temperature-based feedback on model dynamics could parameterize climate damages and the subsequent policy response. One could also incorporate simulation of non-CO2 emissions from fossil fuel combustion in order to expand temperature change estimates beyond those caused by fossil fuel burning.
5. Conclusions
We have used a reduced-form model that simulates the transfer of carbon from the geologic to exogenic carbon reservoirs to demonstrate probabilistic projections of future cumulative carbon emissions and CO2-induced planetary warming. The model-generated emissions trends compared well against recent historical emissions trends and generated an ensemble of future trends that were largely bracketed by the RCP/ECP4.5 and RCP/ECP8.5 emission profiles. These future emissions trends generally exhibited an initial rise and a subsequent drop and generated a bimodal distribution of cumulative carbon emissions with a median value of 3.1 Tt C and 5th/95th percentiles of 0.96 and 4.9 Tt C. The resulting distribution of planetary warming displayed a median value of 4.7 °C and 5th/95th percentiles of 1.4/8.5 °C relative to preindustrial temperatures.
The model and ensemble design allowed for a demonstrative analysis of parametric sensitivity with respect to long-term planetary warming. Given the model framework and parameter ranges, physical climate/carbon cycle uncertainty (represented by a spread in TCRE values) accounted for 23% of the spread in warming with the remainder accounted for by human system parameter uncertainties. Within this subset, uncertainty in minimum non-fossil energy prices, maximum fossil energy resources and maximum carbon price contributed most to the warming spread with minimum non-fossil energy prices and maximum carbon price being relatively influential in low cumulative emission regimes and maximum fossil energy resources being most influential at high cumulative emission regimes. From a projection standpoint, this indicates that reducing uncertainty in projections of these parameters will have the largest effect in reducing non-TCRE-based climate change uncertainty, and that specific policy action with respect to the development of affordable non-fossil energy technologies and robustly pricing carbon emissions are likely the most effective policy levers to keep emissions at a level consistent with 2 °C of climate warming.
Most importantly, we have highlighted the use of a model/ensemble architecture that generates probabilistic cumulative carbon emissions and planetary warming projections in a format that is accessible to decision makers involved in climate risk assessment efforts. Encouraged by the usefulness of this approach, we suggest increased community adoption of probabilistic approaches for modeling emission scenarios, cumulative carbon emissions and, ultimately, the full scale of planetary warming in the Anthropocene.
Acknowledgments
We thank two anonymous reviewers for highly insightful and productive criticisms. In addition, we thank Klaus Keller (Penn State University), Neil Swart (Canadian Centre for Climate Modelling and Analysis), Ramon de Elia and David Huard (Ouranos Research Consortium) and Jean-Sébastian Landry (McGill University) for valuable comments. Jeremy Fyke is supported by the United States Department of Energy Earth System Modeling Program; Damon Matthews is supported by a National Science and Engineering Research Council of Canada Discovery grant and the Ouranos Research Consortium. LANL LA-UR-15-28788.
Footnotes
- 3
These cases included fossil energy emission factor trend rates and final emission factor values, minimum future non-fossil energy costs and strength and delay parameters in the equation defining the diffusion of non-fossil energies into the global energy mix.
- 4
Maximum fossil energy resources were constrained to be at least as large as initial fossil energy reserves plus 20%, the e-folding times of renewable cost declines, carbon price trends, the delay parameter in the equation describing diffusion of non-fossil energies into the global energy mix and the TCRE were all constrained to positive values and the maximum per-capita consumption was constrained to be greater than present-day.
Supplementary data (1.2 MB PDF)