

Abstract
The current global gold rush, driven by increasing consumption in developing countries and uncertainty in financial markets, is an increasing threat for tropical ecosystems. Gold mining causes significant alteration to the environment, yet mining is often overlooked in deforestation analyses because it occupies relatively small areas. As a result, we lack a comprehensive assessment of the spatial extent of gold mining impacts on tropical forests. In this study, we provide a regional assessment of gold mining deforestation in the tropical moist forest biome of South America. Specifically, we analyzed the patterns of forest change in gold mining sites between 2001 and 2013, and evaluated the proximity of gold mining deforestation to protected areas (PAs). The forest cover maps were produced using the Land Mapper web application and images from the MODIS satellite MOD13Q1 vegetation indices 250 m product. Annual maps of forest cover were used to model the incremental change in forest in ∼1600 potential gold mining sites between 2001–2006 and 2007–2013. Approximately 1680 km2 of tropical moist forest was lost in these mining sites between 2001 and 2013. Deforestation was significantly higher during the 2007–2013 period, and this was associated with the increase in global demand for gold after the international financial crisis. More than 90% of the deforestation occurred in four major hotspots: Guianan moist forest ecoregion (41%), Southwest Amazon moist forest ecoregion (28%), Tapajós–Xingú moist forest ecoregion (11%), and Magdalena Valley montane forest and Magdalena–Urabá moist forest ecoregions (9%). In addition, some of the more active zones of gold mining deforestation occurred inside or within 10 km of ∼32 PAs. There is an urgent need to understand the ecological and social impacts of gold mining because it is an important cause of deforestation in the most remote forests in South America, and the impacts, particularly in aquatic systems, spread well beyond the actual mining sites.
Export citation and abstract BibTeX RIS

Content from this work may be used under the terms of the Creative Commons Attribution 3.0 licence. Any further distribution of this work must maintain attribution to the author(s) and the title of the work, journal citation and DOI.
Introduction
The deforestation of high diversity tropical ecosystems has been mainly due to agricultural expansion, cattle ranching, timber extraction, and urban expansion; and these activities have important consequences for the global carbon budget, biodiversity loss, and degradation of ecosystem services (Lambin et al 2003). In the last 10–20 years, much of tropical deforestation has been attributed to the growing economies of developing countries, particularly China. The increasing wealth in these countries is partly reflected by increased global demand for meat, which has been directly correlated with the expansion of croplands for soybean production (animal feed) and grasslands for meat production in South America (Aide et al 2013). The deforestation associated with these land changes in South America is on the scale of millions of hectares, which makes it easy to detect, but the increase in disposable income in developing countries can also stimulate other causes of tropical deforestation that are much more difficult to detect, specifically gold mining.
Global gold production has increased from ~2445 metric tons in 2000 to ∼2770 metric tons in 2013 (USGS 2014). This increase has been driven by personal consumption (e.g. jewelry), particularly in China and India (World Gold Council 2012, Cremers et al 2013), and uncertainty in global financial markets (e.g. value of the dollar and euro) (Shafiee and Topal 2010). This increase in demand over the last 13 years has been paralleled by a dramatic increase in price (Shafiee and Topal 2010). Over the last thirteen years, the price of gold has increased from $250/ounce in 2000 to $1300/ounce in 2013 (figure 1(a); World Gold Council 2012). This rise in global demand and the price of gold have stimulated new gold mining activities by multinational companies and small-scale gold miners throughout the world (Bury 2004, Creek 2009).
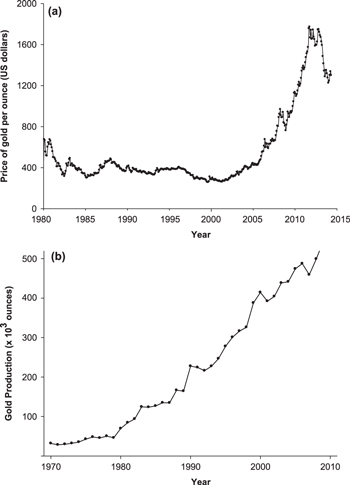
Figure 1. (a) Global price of gold per ounce (USD) from January 1980 to May 2014 (World Gold Council 2012). (b) Gold production ( x 103 ounces) in Latin American countries from 1970 to 2010 (Brown et al 2010)
Download figure:
Standard image High-resolution imageThe high price of gold has made it feasible to extract gold from areas that were not previously profitable for mining, including low-grade deposits underneath tropical forests (Swenson et al 2011). In many cases, the mining of these deposits is characterized by unorganized occupation of lands and uncontrolled mining operations, causing significant forest loss and environmental impacts (Hentschel et al 2002, Villegas et al 2012). Specifically, gold mining impacts forests by removing vegetation for mining pits, transportation access (roads, railways), and settlements. Small-scale mining operations also remove gallery forest to extract alluvial deposits of gold by using high-pressure water jets to remove and process the soil (Almeida-Filho and Shimabukuro 2002). Moreover, although gold mining is usually temporary and occupies relatively small areas, mining effects and impacts are persistent. Long-lasting environmental effects of gold mining include air, soil and water pollution from arsenic, cyanide, and mercury (Eisler and Wiemeyer 2004, Veiga et al 2006). Pollution and sediments from gold mining activities travel long distances through rivers and tributaries negatively affecting water quality and access for humans, fish and other wildlife (Uryu et al 2001). Furthermore, forest recovery after mining activities is significantly slower when compared to regeneration after other land uses (e.g. agriculture, pasture) (Peterson and Heemskerk 2002).
As mining sites often occur in remote locations, they frequently coincide with protected areas (PAs) (Durán et al 2013) or areas of high biodiversity (Villegas et al 2012). Deforestation due to gold mining has become a major threat to some of the most remote and better-conserved old-growth forests in tropical South America (Peterson and Heemskerk 2002, Asner et al 2013). For example, the department of Madre de Dios (Peru), one of the most biologically rich areas on Earth, lost 400 km2 of forest due to gold mining between 1999 and 2012 (Asner et al 2013). In Suriname, estimates indicate that gold miners clear between 48 km2 and 96 km2 of old-growth forest per year (Peterson and Heemskerk 2002).
Although the environmental costs of gold mining are high, it is a major contributor to the economies of industrialized and developing countries, as well as a principal source of income for many people. In Latin American, the gold mining sector is growing rapidly (Bebbington and Bury 2013), with production increasing from ∼414 000 ounces to 542 000 ounces of gold in the last decade (figure 1(b)). In Peru, large-scale mining contributed an average of 6% to the GDP between 2000 and 2010 (World Gold Council 2012). In Colombia, the gold mining sector generates more than 140 000 permanent jobs and an unknown number of informal employments in small-scale mining operations (International Labour Organization 2008). In addition, artisanal and small-scale gold mining employed ∼200 000 people in the Brazilian Amazon in 2008 (Sousa et al 2011). In Suriname, gold mining supports the livelihood of more than 60 000 people (∼12% of the population) (Cremers et al 2013).
As the global demand and price for gold continues to increase (Shafiee and Topal 2010), gold mining activities will likely continue to increase in the tropical forests of South America. Given this current gold rush, the known impacts of gold mining, and the presence of gold mining in remote areas of high biodiversity, we urgently need better information on the distribution and impacts of gold mines in tropical forests. To address these challenges, we identified potential gold mining sites below 1000 m within the tropical moist forest biome (TMFB) of South America. We then estimated forest cover change between 2001 and 2013 using maps derived from MODIS MOD13Q1 imagery (250 m resolution). Specifically, we addressed the following questions: (1) what was the extent of forest change associated with gold mining between 2001 and 2013 in tropical forests of South America? (2) What were the trends of forest change (e.g. deforestation and reforestation) before and after the International Financial Crisis of 2007–2008? (3) Where are the hotspots of gold mining deforestation? and (4) Is gold mining occurring within or around PAs?
Methods
Study area
Our study encompasses the tropical and subtropical moist broadleaf forest biome in South America below 1000 m (hereafter, TMFB) (Olson et al 2001), which includes the Amazonian lowlands, and extends into Colombia, Venezuela, Guyana, Suriname, French Guiana, Brazil, Ecuador, Peru, and Bolivia (figure 2). The TMFB of South America has one of the highest deforestation rates in the world (Hansen et al 2008, Asner et al 2009), mostly due to logging and the expansion of cattle ranching and modern agriculture (Aide et al 2013). This region is rich in alluvial gold deposits, and as gold mining reemerges as an important economic sector in the tropics, it has become another important cause of deforestation and degradation of ecosystem services (Hammond et al 2007).
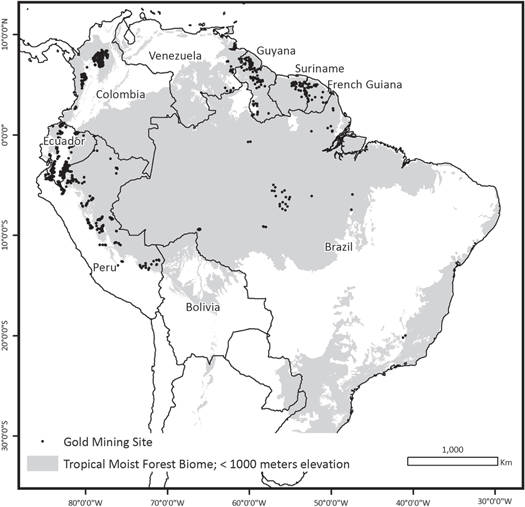
Figure 2. The study site encompasses the tropical and subtropical moist broadleaf forest biome (Olson et al 2001) with elevations <1000 m. Black dots indicate epicenters of active and potential gold mining sites (i.e. geographical centroids) based on literature reviews and government and private mining databases.
Download figure:
Standard image High-resolution imageGold mine geodatabase
To understand forest cover changes associated with gold mining, we first created a geographical database that included active or potential areas of gold extraction obtained from government and private mining GIS databases (e.g. mining concessions, industrial mine locations) and by digitizing polygons around mining locations reported in peer-reviewed articles, news articles, and reports between 2000 and 2013 (supplementary table 1). We also systematically reviewed all high and medium-resolution images available in Google Earth (very high resolution imagery (VHR) from Digital Globe and Landsat; from 2001 to 2013), to include mining sites that were not reported in other sources. In addition to the extraction area, the mining polygon encompassed other mining-associated activities inside or in the vicinity of the extraction site (e.g. roads, installations, settlements, and minor crop and grassland plots), given that these land uses often occur simultaneously with mining. Mining polygons obtained from government GIS layers were incorporated in the database, but to minimize including mining concessions that were not being mined, we only included polygons located in the municipalities that were top producers of gold as an indicator of active gold-mining production (see supplementary table 1).
Table 1. Ecoregions with the highest deforestation associated with gold mining activities between 2001 and 2013, and the area of forest loss between 2001 and 2013.
| Ecoregion | Forest loss associated with gold mining 2001–2013 (km2) | Percent (%) of total forest loss associated with gold mining in the tropical moist forest biome |
|---|---|---|
| Guianan moist forest | 684 | 41 |
| Southwest Amazon moist forest | 473 | 28 |
| Tapajós–Xingú moist forest | 183 | 11 |
| Magdalena Valley montane forests and Magdalena–Urabá moist forest | 144 | 9 |
| Other ecoregions | 196 | 11 |
| Total | 1680 | 100 |
Once completed, the geodatabase included a total of 1606 polygons encompassing all sites (figure 2). The database mainly corresponded to surface mining operations (open-pit, placer or alluvial) of different scales of extraction: large-scale (i.e. highly mechanized gold mining, industrial), medium-scale, and small-scale or artisanal mining (i.e. labor-intensive mining using simple or artisanal technology and limited mechanization). We did not record the legal status of the mining site. The gold mining sites were located in 373 municipalities in Colombia, Peru, Suriname, Guyana, French Guiana, Brazil, Venezuela, and Ecuador.
Forest cover mapping
To map gold mining-related forest cover change, we created annual land cover maps derived from satellite images from 2001 to 2013. We used MODIS MOD13Q1 Vegetation Indices product with 250 m resolution, distributed at no cost by the National Aeronautics and Space Administration (NASA 2014). This product is a 16 days composite of the highest-quality pixels from daily images and includes the enhanced vegetation index (EVI), NDVI, red, near infrared (NIR), and mid-infrared (MIR), and pixel reliability with 23 scenes per year available from 2001 to 2013 (Huete et al 2002). For each MODIS pixel, we calculated annual statistics (mean, minimum, maximum, kurtosis, skewness, and standard deviation) for EVI, NDVI, red, NIR, MIR reflectance values for calendar years 2001 to 2013. The MOD13Q1 pixel reliability layer was used to remove all unreliable samples (value = 3) prior to calculating statistics.
We collected reference samples (9147 pixels) for classifier training and the accuracy assessment in the custom web-based application Land Mapper (Land Mapper 2014). Using this application, we overlaid MODIS pixel-grid (250 × 250 m) on VHR imagery from Digital Globe in Google Earth. We assigned samples of at least 2 × 2 pixel-grids to forest or to a non-forest class and recorded the image acquisition date for each sample. Forest was defined as natural tree cover >2 m in height. Each forest sample had 100% forest cover.
To conduct the image classification we used the Random Forests (RF) tree-based classifier (Breiman 2001) implemented using R (v. 2.12.2; R 2011), and the RandomForest package (v. 4.6-2; Liaw and Wiener 2002), included in Land Mapper (Land Mapper 2014). To train the RF model, reference samples collected from high-resolution images in Google Earth were paired with MODIS time series variables for the same year. The 12 months statistics variables constituted the predictor variables in the RF classification. We used the RF per pixel probabilities to assign land cover classes. A pixel was assigned forest class if the maximum class probability was more than 60%; less than 60% probability was assigned a non-forest class (mixed-forest class) in a post-classification analysis. The final RF model had an overall accuracy of 89%, with forest producer's accuracy of 95% and forest user's accuracy of 98%. This model was used to construct annual maps for each year from 2001 to 2013.
We conducted a post-classification accuracy assessment of the forest versus non-forest classification by comparing classified pixels with the corresponding high-resolution image in Google Earth and assigning a forest or non-forest class. Sampling selection consisted of a stratified sampling method to balance the number of samples per class, and was restricted to areas of high-resolution images that contained mining activities (see supplementary table 2). The sampling resulted in 791 pixels referenced to high-resolution images from 2003, 2004, 2005, 2006, 2011, 2012, and 2013. The forest class had producer's accuracy values ranging from 86% to 100%, user's accuracy values ranging from 82% to 98%, and an overall accuracy of 92% (see supplementary table 2).
Forest cover dynamics
To evaluate the patterns of forest cover change (i.e. deforestation and reforestation) within each mining site, we analyzed the trends of forest cover area using ordinary least squares (OLS) linear regression models following Clark et al (2012). This involved calculating the area of forest cover class for each of the mining polygons in each of the 13 years. We fitted an OLS linear model of area versus time for each mining polygon for the periods of 2001–2006 (n = 6) and 2007–2013 (n = 7). These time periods were chosen to capture patterns before and after the global financial crisis of 2007/08. To determine the strength of the linear relationships, we used the coefficient of determination (R2). We considered the trends significant at p < 0.05 and used the slope of the line to determine the direction of the trend, where positive values of the slope represent an increase in forest cover and negative values represent a decrease in cover. We used this approach to standardize forest cover change through time due to outliers or missing data in any given year. We report forest change as the difference in forested area between the beginning and ending year of each period (e.g. 2006–2001), and we only included mining polygons that had a statistically significant linear trend. These mining polygons highlight areas of forest changes caused by gold extraction and activities associated with mining sites (e.g. roads, settlements, small-scale agricultural and grazing activities). To assess the proportion of other land use activities included in our analysis, we compared sample points within our areas of significant deforestation with high-resolution images in Google Earth. The sampling selection consisted of a random sampling method restricted to areas of significant deforestation and >500 m distance between points, which resulted in 204 points. The analysis indicated that 82% of the deforestation points sampled were due to mining, 13% to pasture, and 5% due to shifting river banks.
Spatial proximity between PAs and gold mining deforestation
To analyze the spatial proximity of gold mining deforestation with PAs we overlapped the distribution of PAs (IUCN and UNEP 2009) with sites that had a significant trend of forest loss. We calculated forest loss within and around each PA (10 km buffer). We used a 10 km buffer to capture mining activities with immediate and regional effects of on PAs, following Duran et al (2013). PAs were classified as: (1) International Designation: Ramsar sites, UNESCO, World Heritage Sites; (2) Strict Protection: IUCN categories I and II (which refer to areas managed mainly for science and for ecosystem protection and recreation); (3) Multiple Use: IUCN categories IV–VI, and including indigenous land usually managed for sustainable use of natural resources (but with no IUCN category), and (4) Other: no IUCN category assigned, but some level of national protection existing.
Caveats
We acknowledge that there are potential caveats to our study. First, MODIS images will not detect forest changes due to small and isolated mining activities (e.g. mining site <5 ha) due to its coarse spatial resolution. We compared our deforestation estimates of a sample of mining polygons with finer-resolution data derived from Landsat (Hansen et al 2013) and calculated that on average MODIS-derived maps did not identify 2.1% (SE 0.33, n = 48) of the deforested area from small mining patches detected using Landsat (see supplementary figure 1). However, the accumulative change from the small-scale conversion can be captured by our trend analysis based on the aggregation of all pixels within a mining site polygon (see Clark et al 2012). Conversely, our maps calculated an average of 6.5% (SE 1.34, n = 48) deforested area that was not mapped using Landsat images. This is because mixed MODIS pixels composed of both forest and non-forest cover located along the border of a mining area were classified as pixels of non-forest (see supplementary figure 1). This indicates that finer-resolution images such as Landsat are better suited for mapping mining extent (Swenson et al 2011). However, these images can also introduce error into a classification because they can lack the ability to capture cloud free data across large areas due to the relatively infrequent revisit time (e.g. 16 d for Landsat). In contrast, MODIS has the advantage of having a high temporal resolution (i.e. near daily revisit time) of imagery, which can be composited to reduce the amount of pixels adversely affected by cloud coverage (i.e. annual statistics in this study) (Clark et al 2012). Furthermore, the wide scenes provided by MODIS satellites (∼1200 × 1200 km) facilitate mapping over large areas. For example, our study site required 38 MODIS scenes instead of 447 Landsat scenes (185 × 185 km), which reduced data processing, storage and time. MODIS high-temporal resolution, combined with ancillary data on mining locations, provides the opportunity to highlight and monitor areas of rapid mining expansion through frequent visiting times (e.g. every month) and to map mining activities occurring simultaneously around tropical cloudy areas of the world. Once these areas of rapid mining expansion are identified, higher resolution imagery can be used to refine the extent of mining expansion and expand the analysis to determine what land uses are being converted to mining (e.g. agricultural lands being lost to gold mining activities). Our methodology could be best replicated in areas where gold mining occurs amidst a background of dense forest (i.e. the tropical lowlands). Gold mining also occurs in areas of higher altitude (e.g. Andean ecoregions), however it is difficult to map with the described methods given the sparse vegetation. Furthermore, we recognize that there is commercial imagery with the potential to generate more accurate results in mapping mining expansion (e.g. high-resolution SAR data), but we wanted to limit our analysis to freely available images (i.e. MODIS products).
Second, some factors may contribute to the underestimation of gold mining deforestation. For example, emerging mining sites (including illegal mining activities) may be too recent to be identified using high-resolution images in Google Earth (see supplementary table 1). Third, our mining polygons derived from government mining concessions may include other sources of deforestation besides those associated with gold; therefore, increasing our estimates of deforestation associated with gold mining (see Forest cover dynamics section). This may occur because mining concessions can overlap with concessions for logging, agriculture, grazing lands, and conservation (Scullion et al 2014). We reduced this error by only including concessions in municipalities that are producing gold (see supplementary table 1) with the assumption that these are more likely to be under gold mining production rather than dedicated to other uses. Given these challenges, our area calculations of gold mining deforestation are approximate, but we believe that our methodology is detecting the hotspots of deforestation due to gold mining and associated activities.
Results
Forest change associated with gold mining
Between 2001 and 2013, approximately 1680 km2 of forest was cleared and 245 km2 of forest regenerated within gold mining sites in the lowlands of the TMFB (figures 3, 4). Forest loss and gain varied greatly between the two time periods. Between 2001 and 2006, there was a loss of ∼377 km2 of forest at 61 gold mining sites; whereas between 2007 and 2013, the area of forest loss quadrupled to ∼1303 km2 and the number of gold mining sites with significant forest loss doubled to 116 sites (figures 3, 4). Forest regrowth declined between the two periods. Between 2001 and 2006, there was regrowth of ∼178 km2 of forest at 20 gold mining sites; whereas in 2007–2013, regrowth decreased to ∼67 km2 and the number of gold mining sites dropped to 19 sites (figures 3, 4).
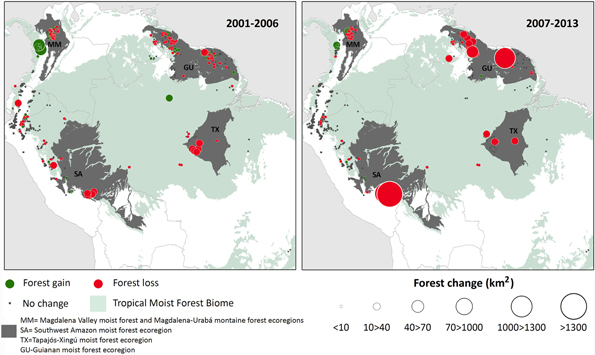
Figure 3. Distribution of gold mining sites with significant change in forest cover (km2) in periods 2001–2006 and 2007–2013. Green dots represent an increase in forest cover, red dots represent a decrease in forest cover, and gray areas indicate no significant change in cover.
Download figure:
Standard image High-resolution image
Figure 4. Number of gold mining sites with significant change in forest cover (p < 0.05) and area (km2) of forest change (loss/gain). Histogram values indicate corresponding number of gold mining sites.
Download figure:
Standard image High-resolution imageGold mining sites with significant deforestation were distributed across the TMFB. Most forest loss (89%) occurred in four regions (described below), and the remaining 11% of forest loss occurred at gold mining sites across 11 other ecoregions. (figure 3; table 1).
The Guianan moist forest ecoregion lost ∼684 km2 of forest to gold mining activities (representing 41% of the total gold mining deforestation in the entire TMFB) (table 1). The majority of the deforestation in this ecoregion was concentrated in the Suriname municipalities of Brokopondo and Sipaliwini (figure 5).

Figure 5. Forest loss associated with gold mining activities in municipalities and protected areas within the four hotspots of gold mining deforestation. Scatter plots show total forest area versus time (from 2001 to 2013) within the mining polygons (outlined in gray). The mining polygons encompass areas of gold mining activity including associated land uses (roads, installations, settlements, and crop and grassland plots).
Download figure:
Standard image High-resolution imageIn the Southwest Amazon moist forest ecoregion, ∼473 km2 of forest was cleared at gold mining sites (representing 28% of gold mining deforestation in the TMFB) (table 1). Most of this deforestation occurred in the municipalities of Inambari, Madre de Dios, and Huepetuhe in the Department of Madre de Dios (Peru) (figure 5).
The Tapajós–Xingú moist forest ecoregion lost ∼183 km2 of forest at gold mining sites (representing 11% of gold mining deforestation in the TMFB). Several patches of gold mining deforestation were found within this ecoregion, with many concentrated in the municipality of Itaituba (Brazil) (figure 5).
The Magdalena Valley-Urabá region lost ∼144 km2 of forest at gold mining sites (representing 9% of gold mining deforestation in the TMFB) (table 1). The majority of the deforestation was concentrated in the municipalities of Zaragoza, El Bagre, and Segovia in the Department of Antioquia (Colombia) (figure 5). Significant sites of the reforestation in this ecoregion occurred in the municipalities of Nechí and Caucasia (figure 3).
Gold-mining deforestation in and around PAs
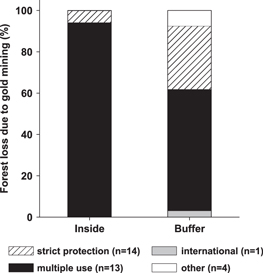
Many gold mining sites occurred in or around PAs. Gold-mining deforestation inside PAs occurred predominantly in multiple use zones (94%), and was less common inside strict protection areas (6%) (figure 6, supplementary table 3). Significant forest loss due to gold mining was found inside 13 multiple use zones, in 14 strict protection areas, and in 1 PA categorized as other. The Rio Novo National Park (Brazil) had the greatest loss (−12 km2) inside a strict protection area (supplementary table 3), and the Tapajós Environmental Protection Area (Brazil) had the greatest loss (−142 km2) inside a multiple use zone (figure 5; supplementary table 3).
Figure 6. Percentage of forest loss due to gold mining occurring inside protected areas (PAs) and within a 10 km buffer surrounding PAs between 2001 and 2013. Only gold mining sites with significant trends of deforestation were included in this analysis. Categories of PAs were defined as follow: (1) International Designation: Ramsar sites, UNESCO, World Heritage Sites; (2) Strict Protection: IUCN categories I and II (which refer to areas managed mainly for science and for ecosystem protection and recreation); (3) Multiple Use: IUCN categories IV–VI, and including indigenous land usually managed for sustainable use of natural resources (but with no IUCN category), and (4) Other: no IUCN category assigned, but some level of national protection existing.
Download figure:
Standard image High-resolution image
Although there was little deforestation inside strict protection areas (−15 km2), 31% of the total deforestation occurred within their 10 km buffer zone (−172 km2) (figure 6, supplementary table 3). The two PAs with the most deforestation in their buffer zones were Rio Novo National Park (−84 km2) in Brazil and the Bahuaja Sonene National Park (−27 km2) in Peru (supplementary table 3). The majority (58%) of deforestation within 10 km buffer zones occurred surrounding multiple use zones (−332 km2) (figure 6). The two multiple use PAs with the most forest loss in their buffer zones were the Communal Reserve Amarakaeri (−103 km2) and the Tambopata National Reserve (−66 km2) in Peru (figure 5; supplementary table 3).
Discussion
In this study, remote sensing analyses combined with ancillary information revealed widespread gold mining deforestation throughout the TMFB of South America. Between 2001 and 2013, gold mining resulted in the loss of approximately 1680 km2 of forest of gold mining sites showing a significant trend of deforestation. Furthermore, our analysis showed that deforestation due to gold mining increased in extent after the international financial crisis of 2007–2008.
Given unprecedented high gold prices, mining activities have increased throughout the tropics where it has become profitable to extract the gold that lies in the subsoil of the forest, thus promoting deforestation (Swenson et al 2011). Although gold mining deforestation is usually smaller in extent than other tropical forest land-uses, gold mining is currently one of the leading causes of forest loss in some of the most important tropical forests of South America. A large extent of this deforestation occurred within and around multiple use or strict protection areas. Below we discuss the land change dynamics of the four hotspots of gold-mining related forest loss, and the environmental implications of gold mining deforestation in proximity to PAs.
Guianan forests—Suriname, Guyana, French Guiana and Venezuela
The Guianan moist forest ecoregion had the largest proportion of deforestation (41%) of the four gold mining hotspots. This region is renowned for its geological formations rich in deposits of gold, diamonds, iron and bauxite, and mining has been a major land use and cause of deforestation (e.g. 68% of the total deforestation in Guyana between 2001 and 2010; (Guyana Forestry Commission 2011). Between 1990 and 2004, gold mining activities expanded rapidly in this region because of liberalization of the international gold market and the influx of Brazilian miners after increased national enforcement of tribal land integrity and land-use laws (Butler 2006, Hammond et al 2007). Small- and medium-scale operations accounted for the majority of this deforestation, but large-scale operations, presumably operating under strict regulations, are also causing forest loss in the region (Hammond et al 2007). Our results demonstrate that the expansion of gold mining in this region is continuing at a rapid rate and often occurring in areas of high conservation priority (e.g. Tepuis in Venezuela, Brownsberg Nature Park in Suriname) (Peterson and Heemskerk 2002, Hammond et al 2007) (figure 5).
Southwest Amazon in Peru
Most of the gold-mining deforestation in the Southwest Amazon moist forest ecoregion is occurring in the Department of Madre de Dios around the Bahuaja-Sonene National Park (strict protection), the Communal Reserve Amarakaeri (multiple use), and the Tambopata National Reserve (multiple use) (figure 5; supplementary table 3). High-resolution satellite data of Madre de Dios showed that the average annual rate of forest loss related to gold mining tripled between 1999–2007 and 2008–2012 (from 21.66 km2 yr−1 to 61.56 km2 yr−1, respectively) (Asner et al 2013). In this region, agricultural expansion was the major driver of forest changes from 2001 to 2006, but after 2007, artisanal and small-scale gold mining expansion was the predominant land change (Scullion et al 2014). The shift from agriculture to gold mining is not surprising given the sizeable increase in income ($15–18 USD daily as a farm laborer to $10–230 USD daily for a typical miner; see Keane (2009), Scullion et al (2014)).
Tapajós–Xingú moist forest in Brazil
The Tapajós–Xingú moist forest ecoregion contains the largest extractive reserve for artisanal and small-scale mining in Brazil, and it is the most important gold producing region in this country (Gonçalo de Miranda et al 1997, Sousa and Veiga 2009). The dramatic rise in the price of gold has resulted in the recolonization of small-scale mining across the Brazilian Amazon because mining areas deemed exhausted of gold are now profitable. From the 1990s to 2010, the number of small-scale miners in the Brazilian Amazon has increased ten-fold (from ∼20 000 to ∼200 000) (Cremers et al 2013), and since 2008, the Tapajós–Xingú moist forest ecoregion has experienced an influx of thousands of new gold miners (e.g. up to 5000 new garimpeiros in the municipality of Itaituba; see Carvalho (2013)) (figure 5). Although new PAs have been created in this ecoregion, the presence of gold and the large influx of gold miners will likely have large impacts in and around these PAs. The Tapajós Environmental Protection Area was the multiple use protected area with the greatest loss of forest, but mining is officially permitted in this PA (Cremers et al 2013). Our visual observation of satellite imagery indicated that forest loss in this PA is often caused by grazing activities occurring simultaneously with gold mining activities.
Magdalena Valley-Urabá
Between 2001 and 2010, the Magdalena Valley-Urabá region (i.e. Magdalena Valley montane forest and Magdalena–Urabá moist forest ecoregions) has been a hotspot of deforestation in Colombia due to oil exploration, cattle ranching, small-scale agriculture, and gold mining (Sánchez-Cuervo et al 2012). Gold mining has been an important economic activity in this region since 1990, but as in the other regions it has expanded rapidly in the last ten years (Massé and Camargo 2012). This region is unique due to the presence of guerrilla and paramilitary groups who are using mining as a new source of income (Massé and Camargo 2012). Up to 20% of the profits from illegal mining in Colombia goes to the guerilla and paramilitary groups (e.g. Revolutionary Armed Forces of Colombia–FARC and National Liberation Army–ELN), and 86% of gold production in Colombia is estimated to be illegal (Massé and Camargo 2012). Interestingly, the presence of paramilitary groups was correlated with reforestation in certain areas (Sánchez-Cuervo and Aide 2013). Our analysis detected reforestation in the municipalities of Nechí and Caucasia, areas of ongoing conflict, which can lead to forced human displacement and the subsequent abandonment of agricultural lands (Sánchez-Cuervo and Aide 2013).
Gold mining coincides with remote areas that are important for conservation
Although there was little deforestation within the strict PAs, the mining operations in the buffer zones can still have serious consequences due to the far-reaching impacts known to affect water, soil, and vegetation. For example, ecological and environmental effects caused by industrial mining activities of several metal minerals (e.g. copper, zinc) have been reported up to 50 km from mines (Durán et al 2013) and elevated mercury concentrations have been found in humans hundreds of kilometers away from gold mining centers (Fréry et al 2001, Ashe 2012). Furthermore, increased sedimentation in water bodies (Mol and Ouboter 2004), heightened wildlife stress resulting from mercurial biomagnification (Eisler 2004), noise pollution (Francis and Barber 2013), increased hunting (Villegas et al 2012), and the degradation of vegetation due to various chemical pollutants (Eisler and Wiemeyer 2004) act to compound gold mining impacts on surrounding ecosystems.
Conclusion
Tropical deforestation studies have traditionally analyzed forest loss due to agricultural expansion, cattle ranching, and urban growth, but less attention has been given to deforestation related to extractive activities of the subsoil such as mining (Bebbington and Bury 2013, Sonter et al 2013). Our study contributes to the understanding of gold-mining deforestation in the tropical rain forest biome in South America, and shows that deforestation has been an important consequence of the global demand for gold. While deforestation due to other land changes has decelerated in this region (Nepstad et al 2014), gold-driven deforestation accelerated after the global economic crisis of 2007. Furthermore, most of the gold-mining deforestation has been concentrated in remote areas, which have high conservation value.
Acknowledgements
NSF IGERT (Number 0801577) and NSF GRFP provided financial support to N. A-B. We thank Serge Aucoin, Paul Furumo, Ricardo Grau, Ana M Sánchez-Cuervo, and Sebastián Martinuzzi for their comments to previous versions. We also thank Jordan Graesser, Carlos J Corrada-Bravo, Rafael Álvarez-Berríos, and Giovany Vega for their assistance with satellite image processing. Valuable insights and improvements on the manuscript were provided by anonymous reviewers. Finally, we would like to thank the Agencia de Regulación y Control Minero in Ecuador for providing access to mining information, and Eddy Mendoza and Arelis Arocho for their assistance with data gathering.