

Abstract
Polymer nanocomposites render a range of outstanding materials from natural products such as silk, sea shells and bones, to synthesized nanoclay or carbon nanotube reinforced polymer systems. In contrast to the fast expanding interest in this type of material, the fundamental mechanisms of their mixing, phase behavior and reinforcement, especially for higher nanoparticle content as relevant for bio-inorganic composites, are still not fully understood. Although polymer nanocomposites exhibit diverse morphologies, qualitatively their mechanical properties are believed to be governed by a few parameters, namely their internal polymer network topology, nanoparticle volume fraction, particle surface properties and so on. Relating material mechanics to such elementary parameters is the purpose of this work. By taking a coarse-grained molecular modeling approach, we study an range of different polymer nanocomposites. We vary polymer nanoparticle connectivity, surface geometry and volume fraction to systematically study rheological/mechanical properties. Our models cover different materials, and reproduce key characteristics of real nanocomposites, such as phase separation, mechanical reinforcement. The results shed light on establishing elementary structure, property and function relationship of polymer nanocomposites.
Export citation and abstract BibTeX RIS
1. Introduction
Polymer nanocomposites comprise a range of outstanding natural and artificial materials. From soft yet tough fibers such as spider silk [1], to hard biominerals such as sea shells or bones [2], and further to polymer nanoclay products used as covers for timing belts and engines [3], all these materials share the same structural motive of a polymer matrix embedding well-dispersed nano-sized particles, where the relative concentrations and structural organization can vary significantly. As a result nanoparticles can introduce new features into the macroscopic properties of the materials, such as increased stiffness, reinforced chemical and thermal resistance, improved optical and electrical properties among others [4–7]. Especially natural polymer nanocomposites, such as bone, nacre and silk, just to name a few, received significant attention in recent years [8–11].
Research initially focused on blending carbon black into rubber to make better tires [12, 13], and was later greatly widened by the invention of fully exfoliated nanoclay-polymer composites in the early 1990ies [14–18]. Similar studies include dispersed nanospheres, nanorod and nanoplates [19–21]. Over the last decade properties which have been optimized range from mechanical reinforcement, to multifunctionality including self-healing systems [22, 23], photovoltaic and solid-state lighting [24, 25], battery electrolytes and electrodes [26], etc. Recent developments to precisely control particle geometries open new directions to optimize material performance [27, 28].
Despite of this wealth of experimental progress, a comprehensive theoretical understanding of these systems is still lacking. Taking the reinforcement of polymer nanocomposites as an example, a variety of explanations were offered based on specific particle-particle interactions [29], bridging polymer chains [30], or particle mobility effects [31]. While these explanations referred to specific (chemical) systems, others provided a more generic view using mean field theory and continuum modeling [32–36] or taking entanglement effects of the polymer matrix into account [13]. Here, in general polymer crosslinking topology and nanoparticle volume fraction seem to be the most important parameters [7, 37]. Thus a first approach based on simple polymer and nanoparticle models should be a reasonable starting point. The major part of simulation studies concentrated on volume fractions around 10% [38–40]. Others study the effect of higher densities on the dynamics of the polymer matrix [41–43]. None of these studies, however, analyzed in a systematic way the mechanic response as a function of strain. Furthermore we compare different systems with respect to the connectivity between embedded nanoparticles and polymers giving first insights into the relevance of nanomorphology. It is the purpose of the present work, to provide a first general comparison and structure property map of such different nanocomposite morphologies using simple particle based models, which have proven to be very successful in polymer research [44]. We here specifically study higher volume fractions as they are relevant for many bio-inorganic composites.
Generally, the size, shape, concentration and orientational as well as spatial order of dispersed nanoparticles affect the mechanical reinforcement of the overall material. [27, 28]. For instance rod-like particles provide a better material toughness than spherical particles [45], or strong attractive potentials between particles can give rise to better reinforcement [46]. This opens a huge parameter space and is beyond the scope of a our present contribution. To reduce complexity we choose (almost) spherical naoparticles immersed in polymer matrices. For this three different classes of generic polymer nanocomposites with different connectivities between polymers and nanoparticles are considered. We restrict ourselves to a generic polymer model with excluded volume only and leave other specific polymer-nanoparticle interaction for future studies. We simulate polymer nanocomposites of different particle size and volume fraction and polymer length, covering the range from about 17% to more than 70% volume fraction. We observe particles clustering into defined percolation pathways and mechanical reinforcement, stress jamming and internal structural breaking, qualitatively comparable to experiment and can relate this to the nanocomposite morphology.
2. Methodology
Both, the polymer matrix as well as the nanoparticles are treated on a generic particle based level. Thus, we represent both components at the same level of detail, being aware of the fact that atomistic details might have a significant influence on the final properties of the material. We expect, however, that the qualitative variation of properties between different nanoparticle polymer connectivities will be independent of further atomistic detail. Earlier studies considered smooth big Lennard-Jones beads as nanoparticles and bead-spring polymer chains [39, 40, 47, 48]. These studies are well suited to describe the equilibrium packing of polymer chains around a nanoparticle, miscibility and nanoparticle diffusion. It is, however, not clear whether tethering and surface friction originating from specific anchoring points are sufficiently taken into account when it comes to mechanical properties of the material.
2.1. Models and setup
Both, the polymer chains as well as the nanoparticles are made of identical Lennard-Jones (LJ) particles and all system and simulation parameters are given in reduced Lennard-Jones units. From here on, we refer to these LJ particles as beads to avoid possible confusion with nanoparticles, if not otherwise specified. For the nanoparticles, as shown in figure 1(A), we arrange LJ beads of size 1 σ in a simple cubic pattern. Starting with a bead in the center, we form center-symmetric nanoparticles of 5 and 10 σ in diameter. Because of this bead arrangement, we obtain (almost) spherical nanoparticles with symmetric square facets of ∼9  and ∼25
  on their surfaces as shown in figure 1(A).
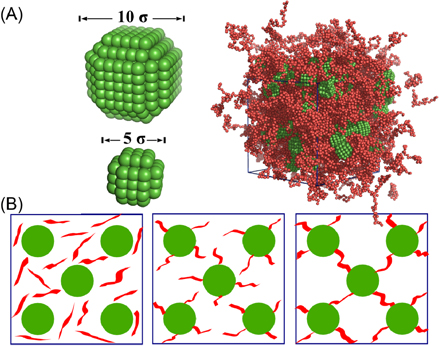
Figure 1. Coarse-grained nanoparticles, simulation system and polymer crosslinking topologies. (A) 2 sizes of nanoparticles used in the simulation systems. Coarse-grained beads are arranged in a simple cubic pattern in a particle. Both particles are semi-spherical, with 6 facets on their surface. A snapshot of an equilibrated composite simulation system is shown at right, with particles in green and polymer chains in red. (B) Sketches of three polymer crosslinking topologies. From left to right are the uncoated, the star and the network pattern, respectively.
Download figure:
Standard image High-resolution imageWe use the standard coarse-grained bead-spring model for all beads in our simulation [44]. This potential consists of a repulsive term, UijWCA (equation (1)), which acts between all beads of the system. For chemical bonded neighbors along the polymer chains and within the nanoparticles as well as for the grafting potential between the end chain bead and the anchor bead of the nanoparticle, an attractive and finite extensible nonlinear elastic potential, UijFENE (equation (2)) is added:
between all beads of the system and
between chemical neighbors. In reduced units, the following parameters are used:  and
and  for UijWCA and UijFENE. All beads have the same mass of m = 1 and temperature
  .
.
To improve the rigidity of the nanoparticles, similar to [41, 49, 50], we apply an additional harmonic potential, Uijharmonic (equation (3)), between second nearest neighbor bead pairs inside each nanoparticle:

where  and
and  . This overall setup results in rigid particles dispersed in a soft polymer matrix.
In an ideal nanocomposite material the nanoparticles are well dispersed, while particle agglomeration degrades material properties [7, 51]. In order to obtain simulation systems with well dispersed nanoparticles in a polymer melt, we initially arrange our nanoparticles in a face-centered cubic arrangement in the simulation box, with nearest inter-particle distance of about 10 σ. We build 3 × 3 × 3 unit cells of this face-centered cubic arrangement, which results in 108 nanoparticles in each simulation box with standard periodic boundary conditions.
For the polymer matrices we use monodisperse fully flexible polymer chains of either 30 or 60 beads. We apply three polymer chain-nanoparticle crosslinking schemes: a dispersion without covalent particle polymer attachment, a star pattern and a network pattern, as depicted in figure 1(B). For the star pattern we tether one end of each polymer chain to the centers of each of the 6 surface facets on every particle. For the network case, we first identify the closest bead pair between two neighbor nanoparticles (one bead from each nanoparticle). We then use these bead pairs as anchor points and attach both ends of a straight polymer chain to connect two different particles. The bond distances in these polymer chains are off from their equilibrium length (0.97 σ), which will be relaxed in the system warm up simulation (see below). By this each particle is connected to its 12 first nearest neighbors. We note that the initial polymer bead density is as low as 0.02 and the polymer chains are in a dilute state (free of entanglement) in such a network setup, which could be different from real experimental systems prepared under other conditions. One reason for the fact that we can exclude chain entanglements for this preparation scheme is that the Ne of the free chain model is about 85 beads and thus longer than our chain lengths (30 and 60 beads) [52, 53] as detailed primitive path analysis and the corresponding plateau modulus reveal [52–54]. Preparing the network at melt density for the polymers would lead to an artificially rigid system [55], because of the short length of the considered chains. We believe that this setup does not sacrifice the basic mechanical properties and does allow a simple direct comparison to the other composite types studied in this work. In total, all simulation systems contain 648 chains. As shown in table 1, we study 12 different systems: six with small (5 σ) and six with big particles (10 σ), each of which either contains polymers of 30 (30B) or 60 beads (60B), respectively. For comparison, we also model two pure polymer melts with 648 monodisperse chains of either 30 or 60 beads. We use the standard bead density of  for pure polymer melts, as well as for the polymers in the space between particles in the composites (see below). By using such a modeling strategy, we restrict ourselves to generic properties of crosslinking effects in polymer nanoparticle composites. Furthermore, with the two particle sizes and chain lengths we consider different particle volume fractions (table 1), which was shown to be a key factor of polymer nanocomposites properties [37]. Because of the simplicity of the present setup, a larger variety of nanocomposites can easily be studied, providing a more comprehensive picture.
Table 1. Details of nanoparticle sizes, polymer chain lengths and particle fractions in the simulation systems for the three connection topologies (star, network and dispersion).
| systems | particle size(σ) | chain length(σ) | volume fraction(ϕ) |
|---|---|---|---|
| 1 | 5 | 30 | 29.3% |
| 2 | 5 | 60 | 17.2% |
| 3 | 10 | 30 | 72.5% |
| 4 | 10 | 60 | 56.8% |
2.2. Simulations
We use the molecular dynamics simulation package Espresso++ [56] to perform all simulations, including warm-up, equilibration and constant volume scaling. Periodic boundary conditions are applied in all simulations. We use a no-fallback random-walk algorithm [56] to generate polymer chains in the internal spaces among particles to build the uncoated pattern, with a polymer chain and particle number ratio of 6:1. Specifically, we assign initial bonds of length 0.97σ between adjacent polymer beads and a minimal distance of 1.5σ between every second bead in each chain. This scheme is known to reproduce properties of chains in a melt reasonably well [44]. During this random-walk polymer generation, we also ensure the polymer chains not to penetrate the nanoparticles. We first utilize a force-capping method for the LJ part of the polymer bead interaction to warm up our simulation systems and eliminate any possible bead overlap. With an integration time step of 0.0005τ for 20000 steps, the repulsive energy,  , is slowly increased from 0.1 to 1 and a soft core potential (force capping) is used if two beads are closer than 0.8 σ. After this warm-up process, we use a bigger time step of 0.005 τ and turn on the Berendsen barostat [57] using a pressure of 5.0, to arrive at a homogeneous polymer density (around 0.02 initially) in the region between the nanoparticles. We keep this pressure for the whole course of system equilibration, with a coupling constant of 2τ. By this we maintain the bead density of the polymer matrix to be
  , being the same as in former studies [44]. While this applies to the longer chains, for short chains and/or high nanoparticle density the resulting polymer density might vary slightly due to packing issues. The simulation temperature is set to 1.0 using a Berendsen thermostat [57], with coupling constants of 1τ. We then equilibrate all our systems for another 20,000 τ in the NpT ensemble, and collect data for analysis every 5 τ. We apply the same warm-up process to all systems under consideration and use the same parameters for all simulations, if not otherwise specified. We expect the polymer bond lengths and chain-nanoparticle linking distance to be around reported value of 0.97σ in the equilibrium state [44, 58].
In order to access the mechanical properties, we perform uniaxial compression/biaxial extension (termed 'compression' in the following text) and uniaxial extension/biaxial compression (termed 'pull') simulations of the systems after equilibration. Since polymer melts typically display an extremely low compressibility [59, 60], we switch off the pressure coupling and deform the simulation box at constant volume conditions. This is expected to be a very good approximation until jammed clusters of nanoparticles start to percolate through the whole system. However, even then the qualitative nature of the observed phenomena should be the same. Taking such effects into account in a more quantitative way would require much larger systems and more detailed interactions, such as an attractive component in the polymer bead bead interaction. Then effects like cavity formation or fibrillation etc could be studied. Though very interesting and important, this is beyond the scope of the present more basic work, and will be subject to future studies. Specifically, we either decrease (compression) or increase (pull) one dimension of the simulation box, X-axis, at a strain rate of  at the same time, we increase or decrease the transverse box dimensions with strain rate of
  to compensate volume changes, respectively. We use a smaller time step of 0.001τ for these simulations to ensure system stability. In order to elucidate loading rate dependence in our results, we apply three box scaling strain rates in our simulations, namely in compressing simulations using
  values of 99%, 99.9% and 99.99% every 10 τ while in elongating simulations using
  values of 101%, 100.1% and 100.01%. This leads to strain rates of
  ,
,  , and
, and  respectively. When comparing our loading time scales (
 ) to the longest relaxation times of the unperturbed chains in the melt, which is found to roughly range from
  for N = 30 to
  for N = 60 [44, 58], one sees that we cover a range of strain rates above and below the characteristic chain relaxation times. Note that the entanglement length Ne for the fully flexible chains is approximately 85 monomers [52, 53], es explained before. We are aware that our box scaling scheme results in a slightly changing loading rate during the course of simulation, namely gradually lower in compressing and gradually higher in pulling. Because the system mechanics is normally sensitive to the loading rate, [61] we thus perform some control simulations with constant loading rate for comparison. As shown by similar results in Suppl. figure S1, our gradually and slightly changing loading rate does not result in significant difference.
We monitor the pressure tensor

during the simulations, where V is the simulation box volume, and m,  ,
,  and
and  are the bead mass, velocity, pair distance and pair-wise force, respectively [57]. Because of the constant temperature condition, changes in the pressure tensors stem from the pair-wise repulsive force component,
  , which is the active stress in the system during volume scaling [62–64].
Given that the nanoparticles are structurally much more rigid, the local mechanical stress in a particle propagates, equilibrates and averages out much faster than in the polymer chains after every volume scaling step.
3. Results and discussions
Here we focus on understanding the particle dynamics and more importantly the systems' mechanical properties. The fully flexible polymer chains of 30 and 60 beads in the systems are known to be only weakly entangled [44, 52]. This simplifies the analysis compared to setups with highly entangled polymer melts. Because two sizes of particles (table 1) as well as different chain lengths are used, our systems exhibit different particle volume fractions ranging from 17.2% to 72.5%, covering most available, but qualitatively different systems [65]. In the following, we first discuss our results separately for each crosslinking topology.
3.1. Uncoated systems: morphology
The uncoated systems consist of particles loosely distributed in the polymer melt. We first monitor the properties of the polymer chains, subject to the presence of nanoparticles compared to simple polymer melts. Asymptotically we would expect for the mean squared end to end distance a value of  and
and  following random walk scaling. As shown in table 2, this is reasonably satisfied considering the variance of the data. [44]. Interestingly, both
  and
and  are not affected by the size of the nanoparticles in the system within the error bars. It was formerly reported that the relative size of the nanoparticles and the polymer coil (measured via it's Rg) greatly affects the mixing process and phase behavior. It was found that smaller nanoparticles promote polymer chain expansion while bigger ones cause chain contraction [66]. In our case, however, the nanoparticles, with diameters of 5 and 10σ, are comparable in size to the polymer chains, and do not cause these effects. Because of the short lengths of either 30 or 60 beads and the corresponding lack of entanglements any significant deviation from Rouse dynamics would be due to the presence of the nanoparticles. Indeed, the polymer diffusion slows down with the addition of particles, as shown in figure 2. The mean squared displacement (MSD) of the center of mass,
  , of polymer chains in our pure melt systems are very close to earlier results [44] with very characteristic initial signatures of the onset of entanglement effects, i.e. the ratio of the chain diffusions constant of 30-bead to 60-bead ones is slightly larger than two. Upon adding nanoparticles of 5σ, the diffusion constant (
 ) of 30-bead chains decrease from 14.89 × 10
 (black solid lines) in pure melt to 7.23 × 10
 (black dotted lines), and 60-bead chains from 5.63 × 10
 (green solid lines) to 3.84 × 10
 (green dotted lines). Bigger nanoparticles and higher volume fraction further decrease chain diffusion (figure 2). Interestingly the ratio of the chain diffusion constants switches from slightly more than
  to slightly less than that. That means that the effect of the filler particles dominates over the usual chain length dependency. Grest and coworkers as well as Kröger and coworkers found that noninteracting small nanoparticles act like a plasticizer before the effect turns around for higher volume fractions [38, 42, 43, 67]. Obviously the current systems cover the whole crossover of relevant chain length and nanoparticle volume ratio. Such an increased viscosity of dispersions is expected and has also been observed in previous studies [68, 69].
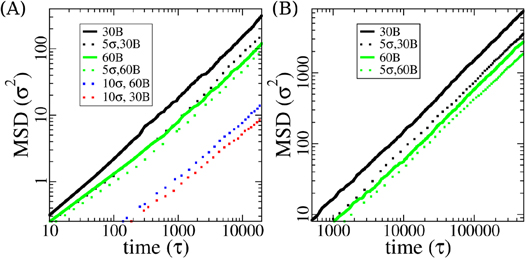
Figure 2. Polymer chains center of mass Mean Squared Displacement (MSD) in uncoated systems (dotted lines) and in pure melt systems (solid lines) in short simulations of 20000τ (A) and long simulations of 500000τ (B), with legends showing particle sizes and chain lengths.
Download figure:
Standard image High-resolution imageTable 2.
Polymer chain mean squared end-to-end distances ( ) and radius of gyrations (
 ) in composite systems of all three crosslinking topologies, and in polymer melts. All the data is obtained from the last 20000τ stretch of the equilibrations runs. Nanoparticle sizes are indicated in the table. Each value is shown with standard deviation.
30B ( ) ) |
60B ( ) ) |
|||
|---|---|---|---|---|

|

|

|

|
|
| uncoated, 5σ particles | 45.2 ± 32.8 | 7.5 ± 3.2 | 102.1 ± 80.4 | 16.0 ± 7.7 |
| uncoated, 10σ particles | 44.8 ± 35.6 | 7.7 ± 3.6 | 104.2 ± 75.9 | 17.1 ± 8.3 |
| star, 5σ particles | 48.3 ± 35.6 | 7.6 ± 3.3 | 88.7 ± 66.8 | 15.0 ± 6.6 |
| star, 10σ particles | 42.9 ± 32.3 | 7.8 ± 3.5 | 112.3 ± 87.0 | 18.4 ± 9.1 |
| network, 5σ particles | 18.8 ± 12.9 | 4.7 ± 1.5 | 30.2 ± 18.2 | 8.5 ± 2.4 |
| network, 10σ particles | 8.2 ± 8.4 | 5.6 ± 1.6 | 15.6 ± 13.7 | 8.7 ± 2.7 |
| polymer melt | 46.2 ± 35.8 | 7.6 ± 3.3 | 95.0 ± 69.9 | 15.9 ± 6.9 |
We also monitor particle diffusion over the equilibration simulation time of 20000 τ. We find that the small particle diffusion can be explained by the local dynamics of the polymer chains, which is in agreement with former studies [39]. As shown by the MSD curves in figure 3(A), particle mobility decreases with increasing particle volume fraction. For the smaller particles the ratio of the diffusion constants with 60-bead polymer chains to its counterpart with 30-bead chains, as taken from the largest displacements, is close to two. This indicates that the increase in particle density between the system of N = 60 and N = 30 bead chains does significantly increase the matrix viscosity η beyond the Rouse scaling of  . Under the condition of an ideal non-entangled polymer melt, one expects for a spherical object a diffusion constant D of
  , kT being thermal energy and R being the particle radius. Yet as shown by the black curve in figure 3(A), an onset of slowing-down in particle diffusion is observed (at around 1000τ). This decrease in particle diffusion is attributed to particle aggregation/collision, and will be further discussed below. The results for the small nanoparticles nicely confirm the data for the chain diffusion. The particles diffuse faster in the N = 60 melt than in the N = 30 melt. Thus the increase of the matrix viscosity due to chain length is overcompensated by the plasticizer effect at smaller volume fraction. Though we do not focus on the viscosity of the lower volume fraction systems, our data nicely fit to the scheme developed by the [43, 67]. In contrast to that the big particles (10σ) are subject to severe packing constraints in between the polymers. For the longer chains, the particle diffusion constant is reduced by more than a factor of ten for the larger particles, as compared to a factor of two simply due to the increased radius. This is even more severe for the large particles in the melt of the shorter chains. They seem locked in the initial face-centered cubic grid arrangement, showing a very small MSD value that only reflects position fluctuations. This is expected given the high particle volume fraction. Especially for those big particles among 30-bead long polymer chains, the particles concentration is 72.5% and is close to the packing limit of face-centred cubic hard spheres (∼74%). This interpretation is supported by analysis of the particle distribution in the simulation boxes. As depicted by the locations of the center of mass of the particles along the box X-axis and snapshots in figure 3(B), big particles are stuck at well-defined particle-particle distances comparable to their size, while smaller particles (5 σ) are more evenly distributed after equilibration. Thus, the slowing-down of big particle diffusion in our case is due to the high particle fraction rather than chain entanglements as formerly reported [39].
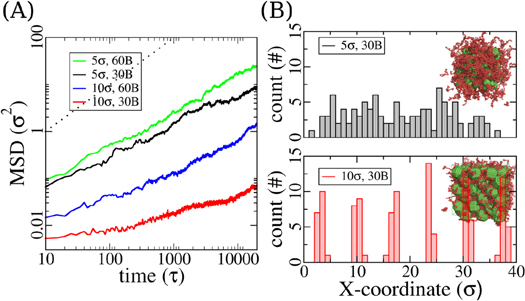
Figure 3. Particle dynamics in equilibration, examples from the uncoated systems. (A) Particle mean-squared displacement (MSD) observed in 4 simulation systems. The sizes of the particles and polymer chain lengths are given by the legends. A slope of 1 is indicated by the dotted line for comparison. (B) Locations of the center of mass of particles along the X-axis of the simulation box at equilibrated state. 5 σ particles on top and 10 σ ones at the bottom, with snapshots showed as insets. Distribution data are taken from the same color coded systems in (A), with particle size and polymer chain length in the system shown as legends.
Download figure:
Standard image High-resolution imageBeyond that we observe a tendency towards separation of small particles (5 σ) from the polymer matrix in longer simulations. Small clusters of particles form and coagulate due to depletion interactions, since no specific particle particle attraction is present. This is very similar to previously reported results of polymer-colloid mixtures [70–74]. To shed more light on this process we extended the simulations of the 5σ particles (in all three crosslinking topologies) to 500000 τ. Indeed, small particles aggregate into clusters. This leads to (partially) cooperative motion and a dramatic slowing down, indicating trapping or jamming(black curve in figure 4(A)). In contrast the functionalization of the particles by chains (star like particles) prevents this aggregation and the individual objects diffuse freely. The network particles of course just fluctuate in their rubbery cage as defined by the imposed connectivity. Even more interesting is that the uncoated particles form percolation pathways along all three dimensions in the simulation box, as exemplified by figure 4(B). This is only observed for small nanoparticles in the uncoated systems. The aggregation appears to be further enhanced by the planar facets of the particle surfaces. Two particles adhere to each other facet by facet and reduce by that the interface to the polymer environment. Because of these two contributing factors, nicely aligned percolation pathways are formed. Such percolation pathways were not observed in similar studies of smooth spherical particles even though phase separation from the polymer matrix was found as well [40]. Of course this effect is strongly supported by the relatively high particle volume fractions in our systems. In order to verify the particle surface facet effects, we carried out additional simulations with different nanoparticles that have face centered cubic bead arrangement. These nanoparticles are 5σ in diameter and possess surface facets of octagon shape with areas of ∼12  , as shown in Suppl. figure S2A. After the same equilibration process, we observe the similar percolation structures (Suppl. figure S2B) for uncoated systems with the same nanoparticle volume fraction.
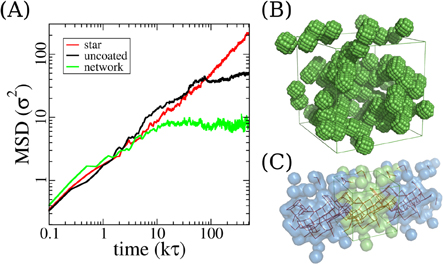
Figure 4. Particle (5 σ) dynamics and aggregation. (A) Particle MSD in three crosslinking topologies in system equilibrium simulations. Data shown here is from 5 σ particles with polymer chain length of 30 beads. (B) Particle aggregation in the uncoated system occurs via facet-to-facet adhesion. Polymer chains are not shown in the snapshot for a clear view. (C) Percolation pathways formed by particles in the uncoated system. Particles in (B) are shown as transparant green spheres, with their of periodic images (transparant blue spheres) at two sides of the simulation box. The percolation pathways are depicted by the red lines connecting pairs of the center of mass of particles. Each red line connects two nanoparticles if their internal distance is smaller than 5.5 σ.
Download figure:
Standard image High-resolution image3.2. Uncoated systems: mechanical response
We access the systems' nonlinear mechanical properties by a systematic deformation of the simulation boxes. We look at both uniaxial extension and compression subject to constant volume constraints. While running these simulations the full pressure tensor based on the two body interactions in the system is monitored. We here predominantly report the strain along the X-axis.
We find the particle volume fraction to be the determining factor of the systems' mechanical properties. As shown by the stress-strain curves during compressing simulations in figure 5(A), systems with higher particle volume fraction (volume fraction of 56.8% and 72.5%) experience strong stresses during deformation compared to those with lower particle volume fraction (volume fraction of 17.2% and 29.3%). The latter show almost zero stress and the applied strain rates are so small that the system can adjust without any observable residual stress. In contrast the system with big particles of 10 σ and short polymer chains (N = 30 beads and volume fraction: 72.5%) exhibit an outstandingly high stress peak during the simulations (green curve in figure 5(A)). This stress peak is a signature of the breakdown of the initial spatial arrangement of the nanoparticles as depicted by figures 5(E) and (F). The initial order suddenly disappears after the stress peak and is spatially disorderd. Such an extraordinarily steep increase of stress right before the structural breakdown indicates high structural hardness. Thus this is connected to high energy dissipation during the deformation. The structural breakdown also results in a sudden drop to negative, retracting transverse stresses,  , of the systems as shown in figure 5(C). As mentioned above, the compressing simulation is actually an uniaxial compression/biaxial extension process. The negative stress indicates that the structural breakdown results in a faster expanding of the system in the transverse directions, Y and Z-axis, than the extension rate. Most interestingly, we observe positive net increase of transverse stress in the system at the very beginning of the compressing and right before the structure breakdown, which is a sign of negative Poisson'(s) ratio at these two states. Thus the jamming of the filler particles leads to an initial negative Poisson ratio, which becomes positive only after the irreversible rearrangement of the particles. Such a transient negative Poisson ratio has also been found in the microstrcutures in other composite materials [75, 76].
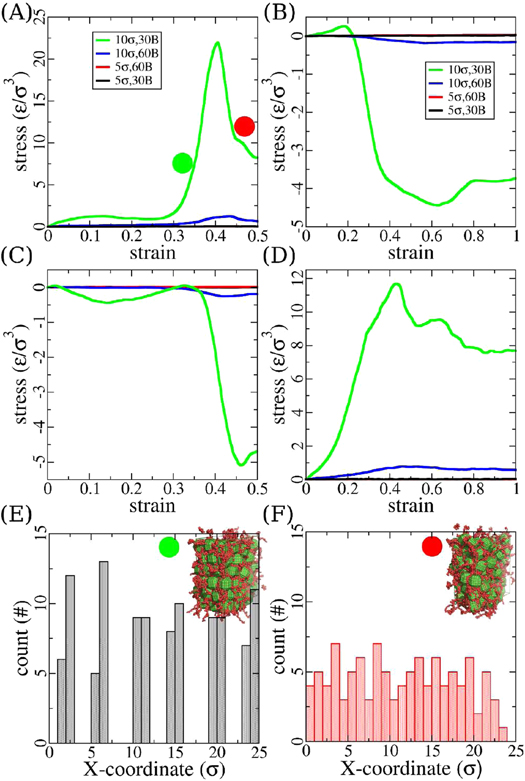
Figure 5. Mechanics of the uncoated systems under compressing and pulling. (A) Stress-strain curves observed during the compressing simulations. The loading is on the X-axis of the simulation box. Particle size and polymer chain length in each system are indicated in the legends. Colored filled circles (green and red) are the positions on the green curve where system snapshots are taken for nanoparticle positions analysis to show structural breakdown. (B) Stress-strain curves of the 4 uncoated systems from pulling simulations, with legends showing particle sizes and polymer chain lengths. (C) Transverse stress ( ), defined as the changes in the transverse pressure tensors, in 4 uncoated systems observed during compressing simulations in (A). (D) Transverse stress in 4 uncoated systems observed during pulling simulations in (B). System internal structural rearrangement is visible in the nonmonotonic stress curve. (C) and (D) share the same color code and legends with (A) and (B), respectively. (E) Locations of particles along the X-axis of the simulation box before structural breakdown. Simulation snapshot (inset) is taken from system with particles of 10 σ and 30B polymer chains, with green sphere indicating its corresponding position on the green curve in (A). (F) Locations of particles after structural breakdown in the same system, with red sphere showing its corresponding position on the green curve in (A).
Download figure:
Standard image High-resolution imageLocal stress plays an important role in this structural breakdown. Before the structural breakdown the stress is dominantly carried by the nanoparticles, as shown in Suppl. figure S3. These local stresses continuously accumulate during the deformation until a critical point (at a strain value of ∼0.4) is reached, where the energy barrier for rearrangement of the particles is exceeded. This transition causes a fast displacement of the particles driven by high local stresses and has a resemblance to crack nucleation in biominerals such as nacre and metallic materials during nanoindention [77, 78]. There nanoparticles displacement and boundary sliding leads to local stress relieve. A similar, but much weaker stress strain relationship is observed for the system with 10σ particles and 60-bead polymer chains (blue curve in figure 5(A). Obviously, a lower particle volume fraction guarantees more internal space between particles and a smoother energy barrier for structural breakdown or rearrangement. With even lower particle volume fraction in the system, the internal space becomes larger than the particle size and enables the particles to diffuse and relax local stress. The relatively low strain rate used in the simulation also allows the polymer chains to have time for relaxation. All of which results in almost flat stress-strain curves in figure 5(A).
We observe an internal nanoparticle structural breakdown during pulling of the high particle volume fraction systems too, however, at a much lower strain. As shown in figure 5(B) and Suppl. figure S4, the system stress increases to a strain value less than 0.2 at which point the fast structural breakdown event starts. The stress then decreases afterwards, and reaches negative values as shown in figure 5(B) (green and blue curves), i.e. the system tries to elongate itself. We ascribe this negative stress to fast relocation of the nanoparticle towards the pulling direction of the simulation box together with a potential tendency to segregation. As discussed above in the Methods section, pulling in one dimension (X-axis) of the simulation box requires compensating compression in the transverse dimensions (Y and Z-axis). After structural breakdown, transverse compressing stress drives particles moving towards the pulling direction and exert expanding stress, which results in effectively negative stress in the stress-strain curve. By comparing the normal (figures 5(A) and (B)) and transverse stresses (figures 5(C) and (D)), one can see the semiquantitative agreement between the transverse stress during compression and the longitudinal stress during pulling and along the same line the transverse stress during pulling and longitudinal stress during compression, respectively, which is a result of the constant volume simulation scheme. Again, this is an effect only observable at high particle volume fraction. For the other two low particle concentration systems, particles are allowed to relocate themselves easily by diffusion and avoid local stress accumulation. Their stress-strain curves are as flat as those in compressing simulations.
It is well accepted that the addition of nanoparticles into polymer melts can result in mechanical reinforcement [13–16, 79] As shown and discussed above, our simulation systems with big particles are reminiscent of biominerals rather than a polymer melt and display features of solids rather than viscous liquids. They support stresses, which are orders of magnitude larger than the ones with small particles (low particle volume fraction). Thus we choose the small particle (5 σ) systems for a direct comparison to the corresponding polymer melt. We prepare two polymer melts, with polymer chains of 30 beads or 60 beads, respectively. Both systems contain the same chain number (648) and have the same bead density of  . After full equilibration for 500000 τ, we also subject these two pure melts to the same mechanical tests for evaluating their stress-strain response. Because of the small deformation rates compared to the inverse Rouse time of the polymers the resulting stress can not be distinguished from zero within the simulation accuracy. However, for the systems with small filler concentration, even though the stress response is extremely weak compared to higher filler concentrations, we observe a clear signal of a restoring stress for both kinds of deformation, as shown in figure 6. As mentioned above, particles are able to aggregate/jam and form percolation pathways. The reinforcement effect levels off, when the rearrangement of the particles begins, as shown in Suppl. figure S5. This result confirms former reports that the mechanical properties of nanocomposites are sensitive to particle dispersions [80–83]. Similar to experimental observations [61], the stiffness is also loading rate dependent and higher loading rate results in higher stiffness, as shown in Suppl. figure S6. There is, however, one surprising detail, which deserves more attention. While for the compression the reinforcement is stronger for a higher volume fraction of particles, i.e. shorter chains, we observe the opposite for the uniaxial elongation, i.e. reinforcement is larger for longer chains and thus a smaller particle concentration. On the one hand increasing the chain lengths results in an increase of viscosity, on the other hand increasing particle density also gives rise to a larger viscosity as well. We observe both effects, however find that for the compression case the first and for the pulling case the latter seems to dominate. To shed more light on these competing effects a detailed investigation beyond the scope of the present paper is needed.

Figure 6. Mechanical reinforcement of the uncoated systems comparing to pure polymer melts under compressing and pulling. Stress-strain from the composite systems under compressing (A) and pulling (B) are shown in solid curves, comparing to data from pure polymer melts in dotted curves. All data is obtained at a strain rate of  . Particle sizes and chain lengths are shown as legends.
Download figure:
Standard image High-resolution image3.3. Star systems
In order to provide a direct comparison with the dispersion case the nanoparticle-polymer star like systems were subject to the very same deformations studies as presented before. The polymer chains move with their connected particles, since each polymer chain is grafted only to one particle. Despite this constraint, because of the free end and the low grafting density the polymer conformations are only weakly perturbed and thus yield similar  and
and  values and a ratio of about ∼6:1 as shown in table 2. Thus the polymer conformations are similar to those in the uncoated systems or in pure polymer melts. However, because the chains are grafted to the nanoparticles, the particle particle aggregation is mostly surpressed. This results in the enhanced particle diffusion at low particle density, as shown in figure 4(A) (red curve). The grafted polymer chains around each particle thus behave as surfactants and are able to promote particle miscibility in the system [84]. The big particles with higher volume fraction are jammed in their initial position, and thus can not diffuse at all.
Despite the stabilization of the suspension by the grafted polymers, the mechanical properties are very similar, including the density dependence, to that of the dispersions as shown in figure 7. Systems with high nanoparticle content also exhibit the same pattern of local stress jamming and structural breakdown. We conclude that the star and uncoated systems are mechanically very similar, as long as the particle aggregation for the dispersion case does not lead to a macroscopic phase separation.
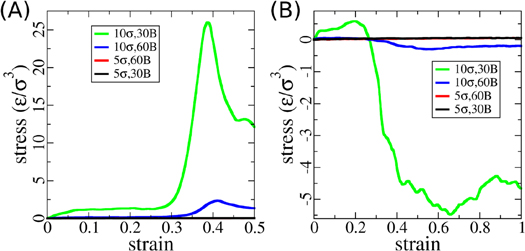
Figure 7. Mechanical properties of the star systems. (A) Stress-strain curves observed during compressing the star systems. The red curve can not be distinguished from the black one in this plot. (B) Stress-strain curves of pulling the star systems. Particle sizes and chain lengths are shown as legends.
Download figure:
Standard image High-resolution image3.4. Network systems
The network system can be viewed as a polymer network with bulky crosslinking entities of a functionality of f = 12, thus they are expected to a first approximation to display the usual polymer network properties [85]. However, while in a standard network the average chain extensions (Rg and R) are the same as in a melt, this is not the case here. Since the chains are smaller than an entanglement length, we only expect quantitative rather than qualitative deviations. After the preparation at a lower density the volume is reduced to arrive at the same density as in the other two cases. Because of the full repulsive WCA potential used for the polymer beads, chains can not cut cross each other after their preparation. These chains are compressed as also has been seen for other collapsed polymer gels [86]. The actual values for  and
and  thus deviate from free chains and are different from those in either uncoated or star systems (table 2). While for the big particles large scale motion is mostly blocked because of the high volume fraction it is restricted, for lower volume fractions due to the network connectivity, also shown in figure 4(A).
The mechanical properties clearly exhibit features of a soft solid, and the effect of particle volume fraction is similar to the other two cases, especially for the larger particles as shown in Suppl. figure S7. We find the systems with small particles (5σ) to have mechanical properties close to standard rubber elasticity. Taking the system in which the small particles are inter-connected by polymer chains of 60 beads for example, there are 648 chains and 108 linking points of functionality f = 12 (corresponding to the number nanoparticles) in the simulation system, and the polymers have a volume (accessible volume) of 43864.43  . Applying classical network models, which do not take topological constraints into account, the elastic modulus is expected to be (
 ), where ν is the number of chains and μ the number of crosslinks; and x = 1 for the phantom and x = 0 for the affine network model, respectively [87]. This leads to predictions of
  (phantom) and
  (affine) for the two network models, which, however, are known to underestimate the modulus in networks of short chains of length
  [55]. We obtain a modulus of ∼0.042
 under a strain value of 0.5 of this system during our pulling simulations. This value suggests that the addition of the nanoparticles leads to a significant reinforcement, even though the volume fraction is rather small. This result is found to be in accord with other former studies [14, 15]. Because of the network connectivity, particles can only rattle in their cage just as crosslinks in ordinary polymer networks. The elastic response of the networks is much stronger than that of the star and uncoated systems when subjected to pulling simulations, as shown in figure 8(A). At least for the small particle systems the data point towards a roughly affine deformation of the sample and the corresponding rubbery response as is illustrated by the distribution of end-to-end distances under strong elongation (figure 8(B)). The network systems are thus mechanically rubber-like [85]. We additionally perform loading and unloading simulations at different loading strain, and observe almost no hysteresis as depicted in Suppl. figure S8. This again is a clear signature of the absence of large scale reorganization of particle positions under strain. The pulled morphologies of the systems are also different from those with star and uncoated crosslinking topologies, as depicted in figure 8(C). Specifically, we find the pulled network systems to be organized like a fiber with extended polymer chains axially oriented along the fiber and the nanoparticles organized in clusters, which is distinctly different from the star and uncoated systems. The morphology of polymer chain connected by nanoparticles and running parallel along the pulling axis in the strained network systems is reminiscent to that of spider dragline silk [1]. There the combination/arrangement of crystalline and amorphous polymer regions is thought to be the key to it'(s) out-performing modulus.
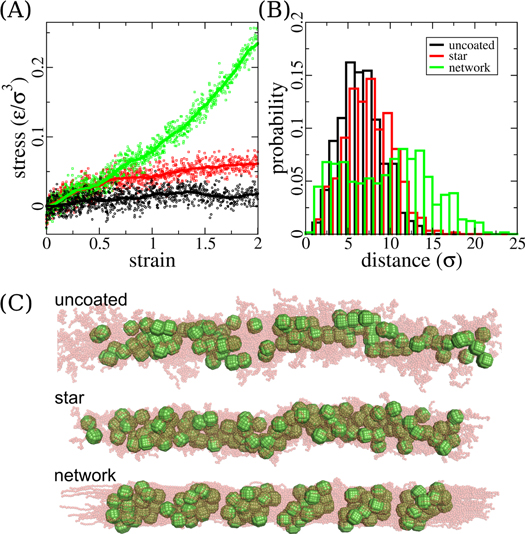
Figure 8. Mechanical effects of polymer chain crosslinking topologies, exemplified by simulation systems with particle sizes of 5 σ and chain lengths of 30 beads. (A) Stress-strain curves of three crosslinking topologies; (B) End-to-end distances of the polymer chains in the system, at a strain rate of 2. Plots (A) and (B) share the same color codes. (C) Example morphologies of three pulled crosslinking topologies. Polymers in all snapshots are shown as transparent light red beads in order to have a clear view of the nanoparticles.
Download figure:
Standard image High-resolution image4. Conclusion
Our study provides a comparison of the dynamics and mechanics of three different classes of polymer nanoparticle composites in the region of high particle density. Their mechanical properties are dominated by two key factors, namely particle volume fraction and polymer crosslinking topology. A higher particle volume fraction will result in particles in confined positions. This effect can also be enhanced by depletion force driven particle aggregation. Such hierarchical structures resemble biominerals with relatively high hardness. Not only density but also polymer crosslinking severely affects particle diffusion. By applying different connectivity schemes between the particles and the polymer matrix, polymer chains of the same length and concentration can trigger polymer particle phase-separation, they can act as surfactants that promote miscibility and mobility, or simply act as solidifiers. Most interestingly, particle aggregates can form percolation pathways through the systems by a match of adjacent particle facets. This result shows the possibility of designing nanoparticles that can spontaneously form desired hierarchical structures.
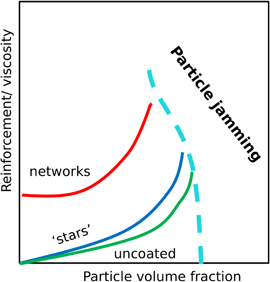
Our results also demonstrate different mechanical properties and their origins in these three system classes. Particles with high volume fraction form blocked structures to resist stress, while those with low volume fraction increase polymer melt viscosity and in this way stiffen the whole system. Polymer crosslinking topology also greatly affects the mechanical response, especially under tension. A network topology gives rise to rubber-like elasticity, however with an enhanced modulus. The mechanical properties of polymer nanocomposites can thus be summarized in a pictoral diagram as shown in figure 9, if particle aggregation effects triggered by specific interactions are not taken into account. Given that the polymer chains used in this study are shorter than Ne of the free chain model, effects of polymer entanglements are not explicitly included in this diagram. Chain non-crossability could affect the reinforcement for the network case, however in a more visible way for low nanoparticle volume fractions. The interplay of entanglements, nanoparticle size with respect to the tube diameter and chain length are interesting questions for further studies.
Figure 9. Pictorial sketch of mechanical reinforcement of polymer nanocomposites. The boundary of particle jamming region is not well defined in this diagram. This is not exactly defined as it most probably depends on chains lengths, grafting polydispersity etc. We expect it to be somewhat smaller for systems with grafted chains compared to dispersions.(see table 1). Possible jamming effect resulting from attractive polymer-nanoparticle interactions is not included in this diagram.
Download figure:
Standard image High-resolution image
In summary, we have used a generic coarse-grained potential to model and simulate polymer nanocomposites and analyze some first basic properties. Our simplified model systems successfully reproduce characteristics of classical material mechanics including phase behavior, mixing dynamics, and enhanced mechanical properties. The data provide a path for correlating molecular structure with material mechanics. Our generic systems are conveniently adjustable for studying more complex morphologies in order to more directly address questions related to silk-like materials [88], or the dynamics and mechanics of janus particles or particles with dipoles in a viscous gel [89, 90]. This, however, will be subject of future studies and is beyond the scope of the present work.
Acknowledgments
We thank Dr Livia Moreira for helpful discussions in this project and proof reading of this manuscript. The authors gratefully acknowledge partial support by the DFG priority program SPP1420 'Biomimetic Materials Research: Functionality by Hierarchical Structuring of Materials'.