

Abstract
Simple mechanical models emulating fish have been used recently to enable targeted study of individual factors contributing to swimming locomotion without the confounding complexity of the whole fish body. Yet, unlike these uniform models, the fish body is notable for its non-uniform material properties. In particular, flexural stiffness decreases along the fish's anterior-posterior axis. To identify the role of non-uniform bending stiffness during fish-like propulsion, we studied four foil model configurations made by adhering layers of plastic sheets to produce discrete regions of high (5.5 × 10⁻⁵ Nm2) and low (1.9 × 10⁻⁵ Nm2) flexural stiffness of biologically-relevant magnitudes. This resulted in two uniform control foils and two foils with anterior regions of high stiffness and posterior regions of low stiffness. With a mechanical flapping foil controller, we measured forces and torques in three directions and quantified swimming performance under both heaving (no pitch) and constant 0° angle of attack programs. Foils self-propelled at Reynolds number 21 000–115 000 and Strouhal number ∼0.20–0.25, values characteristic of fish locomotion. Although previous models have emphasized uniform distributions and heaving motions, the combination of non-uniform stiffness distributions and 0° angle of attack pitching program was better able to reproduce the kinematics of freely-swimming fish. This combination was likewise crucial in maximizing swimming performance and resulted in high self-propelled speeds at low costs of transport and large thrust coefficients at relatively high efficiency. Because these metrics were not all maximized together, selection of the 'best' stiffness distribution will depend on actuation constraints and performance goals. These improved models enable more detailed, accurate analyses of fish-like swimming.
Export citation and abstract BibTeX RIS
1. Introduction
Swimming and flying animals feature a diverse array of structures that are used for propulsion, including fins, wings, tails, and bodies. These propulsors not only vary in their anatomy, but also in their actuation and material composition (e.g., skin membrane, bone, feathers, fin rays, muscle). Despite this diversity, propulsors bend in astonishingly similar patterns. Propulsors found in animals ranging from insects to whales all flex at a point approximately two-thirds along the length of the propulsor, measured from its origin [1]. For this reason, Lucas et al [1] suggested that each propulsor's unique combination of material properties, external shape, internal anatomy, fluid interactions, and actuation traits comes together to achieve this stereotyped bending pattern. Notably, where it has been quantified, flexural stiffness—a measure of resistance to bending that depends on both shape of the structure and the properties of its constituent materials—decreases along the length of many propulsors. These propulsors become highly flexible at nearly the same point as in the observed external bending pattern [2, 3]. However, it is unclear what role this pattern of bending and stiffness distribution play in biological locomotion.
Because the dynamics of fish locomotion have been particularly well-documented, fish provide a useful model system for studying the role of flexibility in propulsion. To swim, fish use sequential muscle activation to pass a sinusoidal bending wave down their flexible bodies in the rostral-caudal direction [2, 4–9]. Throughout this process, the fish's head stays fairly steady, and the lateral oscillations (heaving) of the body increase in amplitude as the wave passes from head to tail [5, 8, 10–12]. Although many factors affect thrust generation and swimming efficiency, including body and tail shape and fin usage [5, 13–22], passive flexural stiffness—based solely on body shape and materials—is a key variable controlling this waveform [2, 5, 23–25]. For instance, increasing the body's bending stiffness accelerates the travel of the bending wave, leading to increased tail-beat frequency and an associated increase in swimming speed [2, 5]. However, the precise ways in which stiffness is used by fish to modulate waveform and swimming performance are unclear. In particular, passive flexural stiffness is non-uniform along the fish: it decreases dramatically in the posterior third of a fish's body, reflecting the common biological bending pattern [1, 2]. But, it is not possible to experimentally manipulate actuation characteristics and patterns of flexural stiffness in a live, free-swimming fish. Furthermore, it is difficult to measure forces and torques acting on a freely swimming fish, and nearly impossible to isolate the effects of stiffness on its performance. And so, the significance of this stiffness distribution remains elusive.
Recently, simple mechanical models have been used to eliminate the confounding complexity of the fish body and to perform controlled experiments targeting the effects of individual factors on swimming performance [2, 19, 21, 22, 26–32]. These models consist of a passively-flexing foil driven by a robotic controller. Although these models are considerably simplified and appear distant from a fish, they are able to generally reproduce the midline kinematics of a swimming fish [19, 21]. Moreover, they allow for rapid alteration of experimental variables, direct measurements of forces and torques acting on the model, and detailed assessment of their effects on propulsion.
These models have begun to elucidate the individual contributions of body length, tail shape, center of mass oscillation, near-wall swimming, resonance effects, actuation patterns, and flexural stiffness to fish swimming performance [2, 19, 21, 22, 26–32]. These studies have shown that the relationship between stiffness and performance is complex: under some conditions, increased stiffness can lead to increased swimming speeds, thrust coefficients, and efficiencies, but under other conditions, being flexible was more advantageous [2, 21, 33]. Previous research has emphasized uniform stiffness distributions [21, 33], but has not been compared across stiffness distributions [2], or has not tested swimming under biologically-relevant conditions [34, 35].
Thus, our goal in this paper is to provide a detailed analysis of the effects of non-uniform stiffness distributions on swimming propulsion under conditions routinely experienced by the fish body. We used a simple mechanical flapping foil model to isolate the effects of stiffness distribution. We designed and tested four foil configurations with discrete regions of high and low flexural stiffness and examined their kinematics, self-propelled speeds (SPSs), cost of transport (COT), thrust coefficients, and propulsive efficiencies in order to compare their performance. In addition, we introduce a new pitching program where the swimming foil maintains a constant 0° angle of attack while heaving laterally, and compare swimming performance in this program to that of the more commonly studied program featuring lateral heaving without any pitch.
Based on the results of Lucas et al [1], Riggs et al [34], and Cleaver et al [35], we hypothesized that the non-uniform stiffness models would achieve improved swimming performance over traditional uniform stiffness models, and that the common biological stiffness pattern with the flexible 'tail' region would perform the best overall. We also predicted that the 0° angle of attack pitching program would further enhance swimming performance, based on the results of Quinn et al [32], and would lead to more fish-like kinematics than seen in previous studies. Finally, we discuss the significance of these improvements in the context of a whole fish body and propose hypotheses about the mechanisms driving the observed performances.
2. Materials and methods
2.1. Foil design
Four different foils were constructed out of 'transmatte' plastic from a collection of shim stock (ARTUS Corp, Englewood, NJ, USA). Each foil was comprised of a sheet of plastic which was sandwiched at the leading edge by two additional panels of the same material to create discrete regions of high stiffness (three layers of plastic) and low stiffness (one layer of plastic) (figure 1). Layers of plastic were held together by transparent epoxy. Three-point bending tests revealed that the flexural stiffness of the high stiffness regions (EI = 5.5 × 10⁻⁵ Nm2) was approximately three times the flexural stiffness of the low stiffness regions (EI = 1.9 × 10⁻⁵ Nm2) (table 1), and that these flexural stiffnesses were within the range of values characteristic of fish [2, 23, 24]. So that all four foils had the same leading-edge thickness when mounted on the actuation rod (see experimental setup below), the leading edge of all foils was three layers of plastic thick (figure 1).

Figure 1. Foil schematics. The leading edge is on the left. Uniform foils had uniform stiffness along the chord. Non-uniform foils had discrete areas of high and low stiffness. Low stiffness regions were constructed using a single layer of plastic. High stiffness regions were achieved by sandwiching three layers of plastic. A thin strip of fluorescent paint along the foils' midlines facilitated imaging. Details of foil construction can be found in the text. In the foil naming scheme, '#_3' refers to the proportion of the foil with high stiffness, i.e., the anterior 1/3 of the 1_3 foil is stiff.
Download figure:
Standard image High-resolution imageTable 1. Foil and material characteristics. The 0_3 and 3_3 foils were composed of only single-layer (low stiffness) material and triple-layer (high stiffness) materials, respectively. For the 1_3 and 2_3 foils, the anterior 1/3 and 2/3 of the foil, respectively, contained high stiffness material. See figure 1 for images of the four foil types and the distribution of material stiffness.
| Mass (g) | Re range of swimming trials | Flexural stiffness (×10−5 Nm2) | |
|---|---|---|---|
| 0_3 | 2.8 | 21 000–75 000 | — |
| 1_3 | 6.7 | 21 000–115 000 | — |
| 2_3 | 8.9 | 24 000–114 000 | — |
| 3_3 | 12.3 | 28 000–108 000 | — |
| Single-layer plastic (low stiffness) Mean ± S.E. | — | — | 1.9 ± 0.07 |
| Triple-layer plastic (high stiffness) Mean ± S.E. | — | — | 5.5 ± 0.07 |
The four foils consisted of two uniform-stiffness and two non-uniform stiffness models. The uniform-stiffness models were comparable to our previous foil models [19, 21, 26, 29, 31] and were used as controls. These two models included a foil whose entire free length had low stiffness, as well as a foil whose entire length had high stiffness (figure 1). The first non-uniform foil had high stiffness in the anterior one-third of its length and low stiffness elsewhere (figure 1). The other non-uniform foil had high stiffness in the anterior two-thirds of its length (figure 1), reflecting the commonly-observed biological stiffness pattern [1]. These proportions led to the naming codes used to designate the foils in this paper, where [number]_3 refers to the proportion of the foil that was stiff (e.g., 1_3 indicated that the anterior 1/3 of the foil had high stiffness). Foil identification conventions are given in figure 1.
Additionally, a thin strip of fluorescent paint was applied at the foils' midlines to facilitate imaging.
2.2. Experimental setup
Foils swam in an oncoming flow using an updated version of our mechanical flapping-foil system used in earlier research on aquatic propulsion [19, 21, 26, 29–32]. Briefly, a foil was clamped at the leading edge by a rod fitted with an ATI Nano-17 six-axis force–torque sensor (ATI Industrial Automation, Apex, NC, USA) that allowed for measurements in the X (streamwise, thrust/drag axis), Y (lateral, direction of heaving motions), and Z (vertical, pointing up the shaft) directions. A carriage suspended this rod in a recirculating flume. The carriage also contained a set of heave and pitch motors that actuated the rod in motions that approximated the kinematics of swimming fishes [19, 21]. A suite of custom LabVIEW programs (National Instruments Corp., Austin, TX, USA) was used to control the motors, to monitor their real-time positions, to collect data from the force–torque sensor, and to set the flow speed in the flume. Refer to Quinn et al [32] for a schematic diagram of the system, and photographs of similar versions of the experimental set-up were provided by Lauder et al [19] and Lauder et al [33].
The foils were actuated in two pitch programs. First, as in our previous foil studies, the foils were actuated in sinusoidal, lateral heaving motions without pitch (figure 2), which approximates the motions of the posterior, thrust-producing region of a fish's body [21]. Second, the foils were actuated in a 0° angle of attack program where each foil was heaved as in the heaving program, but the pitch angle was continuously changed so that the foil's leading edge maintained a constant 0° geometric angle of attack relative to the oncoming flow (figure 2). For each combination of heave amplitude, flapping frequency, and flow speed that was examined, the pitch angle waveform function (which gave pitch angle at each point in time) required to produce a constant 0° geometric angle of attack was calculated a priori using equation (11) in Read et al [36], where the angle of attack function was set to zero. The LabVIEW suite then pitched the foil according to this waveform.

Figure 2. Instantaneous foil position and force and torque acting on foils over a motion cycle. Foils were flapped at their self-propelled speeds (see figure 5) at 1.5 Hz and 1.5 cm heave amplitude, in two pitch programs: heaving (no pitch) and 0° angle of attack, where pitch was constantly updated to maintain 0° angle of attack into oncoming flow. Fx—thrust forces, Fy—lateral forces, Tz—vertical torque. Stiffness distribution and pitch program both affected the timing and magnitude of peak forces and torque.
Download figure:
Standard image High-resolution imageFx and Fy here always refer to forces in the streamwise and lateral directions. To account for rotations of the force–torque sensor as the rod was pitched in the 0° angle of attack program, measured x- and y-forces (Fxmeas and Fymeas) were resolved into streamwise and lateral components using the following formulas, where θ was the instantaneous pitch angle in radians


2.3. Measurements of foil performance
The 'self-propelled' condition (sensu [17, 19, 31, 33, 37–39]) describes a state of steady swimming, where thrust and drag forces balance, and so the fish experiences zero net forces or torques. For a swimming body, this steady-state condition is met at a characteristic swimming speed for each motion program type (i.e., combination of heave amplitude, flapping frequency, and pitch program), called the SPS. Yet, fish experience non-self-propelling, or non-steady, conditions during accelerations and maneuvering. Thus, swimming performance of foils was quantified in both self-propelling and non-self-propelling conditions. In both situations, thrust coefficients and mechanical power used to actuate the foils were calculated following the equations in Read et al [36].
To find SPS, a custom, master LabVIEW program (modified from Wen and Lauder [29]) automated data collection by operating the controller's suite of programs at various combinations of heave amplitude, flapping frequency, and pitch program. We chose to move the foils with ±1.5 cm heave amplitude, in the two pitch programs, at flapping frequencies of 0.5, 1.0, 1.5, 2.0, and 2.5 Hz, which encompass values characteristic of fish [5, 8, 10, 12, 19, 21]. Net forces and torques acting on the foil were measured in each motion program over a range of flow speeds. Linear regressions performed in RStudio (RStudio, Inc., Boston, MA, USA) on flow speed versus net thrust coefficient per motion cycle were used to identify SPS—the y-intercept indicated the flow speed where thrust coefficient was 0, the self-propelling condition. A preliminary, broad sweep of flow speeds was tested to approximate SPS, and subsequently, a targeted sweep over a range of 0.1 m s−1, centered at the approximate SPS, was used to find SPS precisely. This targeted sweep was repeated five times to produce five replicate measures of SPS.
Linear regressions on net mechanical power consumed versus net thrust coefficient were also conducted in RStudio. The y-intercept indicated the mechanical power usage corresponding to SPS. Dividing this value by SPS and foil mass yielded mass-specific COT corresponding to that SPS. This calculation was conducted for each replicate measurement of SPS, providing 5 replicate measures of COT.
Statistics were conducted in JMP Pro 11 (SAS Institute Inc., Cary, NC, USA) on SPS and COT data to identify the effects and interactions between foil type (stiffness distribution), pitch program, and flapping frequency. The Shapiro–Wilk W test for normality and Levene's test for equality of variances determined that all data were normal but heteroscedastic. Inspection of residuals revealed that variances were still fairly consistent across cells, indicating that they did not grievously violate the assumptions of the ANOVA [40]. In addition, ANOVAs are fairly robust in the case of normal data with equal replications [40]. Thus, three-way ANOVAs were conducted despite the heteroscedasticity; however, caution was taken in interpreting border-line significant results. The following post-hoc tests were administered. Tukey HSD tests were conducted to investigate the effects of flapping frequency and foil type. Additionally, a Student's t test was used to compare pitch programs, and a Means Contrasts test was used to compare the two uniform foils against the two non-uniform foils.
To examine the performance of foils over a range of non-self-propelling conditions, three-dimensional performance surfaces were collected after Shelton et al [21]. Briefly, another custom, master LabVIEW program was used to automatically actuate each foil at 49 combinations of heave amplitude (0.5–2 cm, in 0.25 cm increments) and flapping frequency (0.5–2 Hz, in 0.25 Hz increments) in an oncoming flow of 0.3 m s−1. The resulting values for net thrust coefficients and power consumed were averaged over several motion cycles. Using these means, propulsive efficiencies were calculated following the equations in Read et al [36]. This procedure was repeated five times per foil to produce replicate surfaces that were averaged together, and this procedure was also conducted in both pitch programs. Note that SPS occurs in these surfaces where the thrust coefficient and, hence, efficiency are zero.
2.4. Midline kinematics
Foil kinematics at SPS were captured at 1.5 Hz flapping frequency and 1.5 cm heave-amplitude, for both heaving and 0° angle of attack programs. Foils were filmed at 250 fps in ventral view using a 45° mirror and a high speed camera (Photron PCI-1024; 1 megapixel resolution). A continuous Coherent 10W argon-ion laser light sheet was used to illuminate foils along the strip of fluorescent paint at the midline. This produced a video where the foil was white, in high contrast to a black background. An optical mirror located outside the flow tank was used to help illuminate the foils' trailing edges, which often drifted out of the laser sheet in the 0° angle of attack program. A LabVIEW pulse trigger allowed simultaneous force–torque measurements and video collection. Six motion cycles worth of video (1000 frames) were collected for each foil in each pitch program.
A custom LabVIEW program was used to automatically filter out background particles and digitize the foil in each frame of the videos. Using these digitized data, the program calculated maximum lateral excursion (half of peak-to-peak amplitude) for 13 equally-spaced points along the length of the foils (at 0 L, 1/12 L, ..., 1 L) as in Jayne and Lauder [8]. Additionally, in each frame, the program selected 204 equally-spaced points along the length of a digitized foil, including the leading and trailing edges. A cubic spline was fit to these points. A set of six splines equally spaced through time were selected to represent each motion cycle. Splines from corresponding time points in multiple motion cycles were averaged together to yield mean 'snapshots' of foil motion. The six mean 'snapshots' were plotted together to produce midline envelopes.
Due to the inability of the detection program to distinguish the black rod used to actuate the foils from the background, the anterior-most 1 cm of the foils were simulated as straight lines extending from the detected, digitized foil. While this simulation generally showed good agreement with images of the rod's location, it did introduce a small amount of error to the detection of leading edge (0 L) coordinates. This error did not affect detection at any other location along the foil.
Reynolds number (Re) and Strouhal number (St) were calculated for each foil in each pitch program based on SPS kinematics data. Re was calculated using the equation below, where ρ was the density of freshwater (1000 kg m−3), v was swimming velocity (in this case, SPS), L was foil chord length (0.18 m), and μ was the dynamic viscosity of freshwater (0.001 kg m−1 s−1)

St was calculated using the equation below, where f was flapping frequency (1.5 Hz), and A was the peak-to-peak trailing edge amplitude

JMP Pro 11 was used to conduct statistics on lateral excursion data to detect differences in foil kinematics based on the effects and interactions of foil type (stiffness distribution), pitch program, and location on the foil. Shapiro–Wilk W tests for normality and Levene's tests for equal variances indicated that several cells were non-normal, and all cells were heteroscedastic. An examination of the residuals was unable to suggest if the data were appropriate for an ANOVA, so an aligned rank transform, useful for multi-factor non-parametric analyses, was performed with ARTool v.1.5.1 [41]. Aligned data were then analyzed using multiple three-way ANOVAs to examine each effect and interaction as in Wobbrock et al [41], with a false detection rate correction to reduce the Type I error rate from multiple testing [42]. A standard three-way ANOVA ran in parallel on untransformed data led to similar results as the more statistically-rigorous analysis, and therefore, further interpretations of the results of statistical tests were made based off this standard three-way ANOVA. Post hoc Tukey HSD, Means Contrasts, and Student's t tests were used to identify differences between stiffness distributions, uniform versus non-uniform foils, and pitch program, respectively.
Phase-averaged (n = 6) force and torque time-traces at SPS, corresponding to these kinematics, were also examined over a motion cycle. All force and torque traces contained high-frequency noise that was filtered in IPython v.2.3 [43] using a second-order Butterworth low-pass filter in two passes, to eliminate phase-shifts, with a desired cutoff frequency of 10 Hz (adjusted to 12.47 Hz to account for multiple passes) [44].
3. Results
3.1. Midline kinematics
As foils were heaved laterally, a bending wave developed and traveled from anterior to posterior, in the opposite direction of swimming 'travel.' Generally, this wave grew in amplitude as it moved posteriorly (figures 3 and 4). Each foil displayed unique kinematics; stiffness distribution, pitch program, and position on the foil, as well as all interactions between these factors, had significant effects on kinematics (all p < 0.0001, table S1, figures 3 and 4).

Figure 3. Kinematics of swimming foils over a motion cycle. The leading edge is on the left. Foils were flapped at their self-propelled speeds (see figure 5) at 1.5 Hz and 1.5 cm heave amplitude. Reynolds (Re) and Strouhal (St) numbers are reported on the corresponding plot. The foils exhibited diverse kinematics which varied with both stiffness distribution and pitch program. (See also figure 4 and ANOVA results in table S1.)
Download figure:
Standard image High-resolution image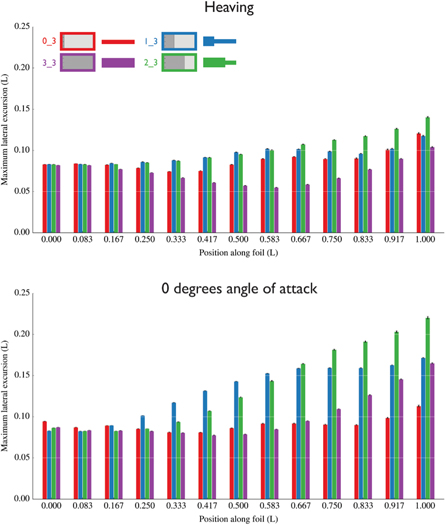
Figure 4. Maximum lateral excursion along the length of the foils (data corresponding to figure 3). The leading edge is on the left. Error bars represent one standard error (n = 6, except n = 5 for 0_3 in the heaving program) and are often too small to be visible. Foils were flapped at their self-propelled speeds (see figure 5) at 1.5 Hz and 1.5 cm heave amplitude. Lateral excursion at each point on the foil varied according to both pitch program and foil stiffness distribution but generally was larger in the 0° angle of attack program. Non-uniform foils, particularly the 2_3 foil, achieved the largest trailing edge amplitudes. (See also figure 3 and ANOVA results in table S1.)
Download figure:
Standard image High-resolution imageIn the heaving program, the foils experienced most of their bending in the posterior region (∼0.5–1 L), as indicated by the increasing curvature of the snapshot lines, compared to the more parallel snapshot lines at the anterior region of each foil (figure 3). This contrasts with curvatures observed in the 0° angle of attack program, where the foils were bending throughout their lengths. Qualitatively, non-uniform foils, particularly in the 0° angle of attack program, tended to have more fish-like kinematics than uniform foils (figure 3).
Each foil exhibited its own unique pattern of lateral excursion. For example, in the heaving program, the uniform, high stiffness (3_3) foil's excursion decreased in the middle of its length, while none of the other foils experienced this change (figure 4). However, compared to the heaving program, the 0° angle of attack program led to increased lateral excursions, with the non-uniform foils experiencing the largest excursions overall (figure 4). Notably, the 1_3 (stiff anterior one-third) foil achieved large lateral excursions more anteriorly (∼0.17–0.25 L), but excursion plateaued in the last third of its length. In contrast, the 2_3 foil started to achieve these large excursions more posteriorly (∼0.3–0.4 L), but excursion continued to increase up until the trailing edge without any plateaus.
Additionally, the 0° angle of attack program magnified the peak-to-peak trailing edge amplitudes, compared to the trailing edge amplitudes in heaving program, and compared to the imposed heave amplitudes at the leading edge (figures 3 and 4). This was especially true of non-uniform foils. The 2_3 foil (stiff anterior two-thirds) had the largest trailing edge amplitudes in both pitch programs, but the trailing edge amplitude was greater in the 0° angle of attack program (figures 3 and 4).
3.2. Swimming performance
At SPS, zero net forces and torques act on a foil over a complete motion cycle, but these forces and torques can vary instantaneously. Pitch program and stiffness distributions led to variation amongst the instantaneous force and torque traces. Peak streamwise forces (Fx) and vertical torques (Tz) were larger, and peak lateral forces (Fy) were smaller, in the 0° angle of attack program compared to the heaving program (figure 2). Each stiffness distribution led to phase shifts in peak magnitudes, and having any high stiffness region appeared to add higher frequency effects to otherwise largely sinusoidal traces (figure 2). Thrust forces displayed more oscillations within a flapping cycle in 0° angle of attack program compared to the heaving program, even though mean thrust for all foils and motions was near zero (figure 2).
In terms of SPS itself, there were significant effects of stiffness distribution, pitch program, and flapping frequency, as well as all interactions of these factors (all p < 0.0001, table S2). Non-uniform stiffness distributions led to increases of up to 26% and 50% in SPS for the 1_3 foil and 2_3 foil, respectively, relative to the stiff uniform foil, which had the largest SPS of the two uniform foils (figure 5). Although the differences between foils were smaller in the 0° angle of attack program, this pitch program as a whole led to increases in SPS of up to 54% compared to the heaving motion program (figure 5).

Figure 5. Self-propelled speeds of swimming foils. Foils were flapped with 1.5 cm heave amplitude and increasing frequency in two pitch programs. Error bars (standard error) are obscured by the points (n = 5). Although SPS increased with frequency, the manner in which it did so varied across stiffness distribution and pitching program. Non-uniform foils often achieved SPSs similar to or greater than uniform foils. (See also ANOVA results in table S2.)
Download figure:
Standard image High-resolution imageThe effects of flapping frequency were more complex. Increases in flapping frequency led to overall increases in SPS but did so in different ways across foil types and pitch programs (figure 5). The non-uniform foils usually achieved faster SPS at a given flapping frequency than uniform foils, with the 2_3 foil often achieving the fastest SPS overall.
Notably, the 1_3 and 2_3 foils had equally large SPS in the 0° angle of attack motion program at the highest frequency tested (figure 5). Because the 2_3 trace appeared to be plateauing while the 1_3 trace increased, it is possible that the 1_3 foil would achieve larger SPS at higher flapping frequencies than those tested here.
Mass-specific COT also experienced significant effects of stiffness distribution, pitch program, and flapping frequency, and all interactions of these factors (all p < 0.0001, table S3). Yet, as a performance metric, COT provided a complex picture. The COT increased with flapping frequency for all foils, although as in SPS, it did so in different patterns across foil types and pitch programs (figure 6).

Figure 6. Cost of transport for foils swimming at self-propelled speed. Foils were flapped with 1.5 cm heave amplitude and increasing frequency in two pitch programs, as in the SPS tests (see figure 5). Error bars (standard error) are obscured by the points (n = 5). Non-uniform foils generally achieved higher self-propelled speeds at costs of transport similar to those of uniform foils moving at lower speeds. (See also ANOVA results in table S3.)
Download figure:
Standard image High-resolution imageIn the heaving program at low swimming speeds, when the proportion of the foil that was stiff increased, COT decreased (figure 6). These findings are consistent with the results of Shelton et al [21] and Feilich and Lauder [22], each of whom found that, in the heaving program, mass-specific COT varied inversely with flexural stiffness. However, at high flapping frequencies and swimming speeds, the pattern changed, and the 2_3 foil, with the biological stiffness pattern, had the lowest COT (figure 6).
When the 0° angle of attack program was applied to simulate both the pitching and heaving of a fish's body, all of the foils experienced a substantial decrease in COT (figure 6), as predicted by the optimizations performed by Quinn et al [32]. Differences between foils were smaller than in the heaving program but still were significant (table S3). At low flapping frequencies, the 1_3 foil's COT was marginally smaller than the other foils (figure 6). As frequency increased, a cross-over phenomenon occurred, so the 3_3 foil consistently had the lowest COT values (figure 6). Yet, a given flapping frequency, the non-uniform foils always had faster swimming speeds than the 3_3 foil, albeit at a higher cost. Moreover, the greatest speeds observed were only obtained among the non-uniform foils at low, but not minimum, COT.
A similar story emerged under non-self-propelling conditions, where three-dimensional performance surfaces (figure 7) revealed performance differences between the foils. Because these surfaces can be difficult to interpret as static images, transects through these surfaces are presented in figures 8 and 9 for clarity. Note that propulsive efficiency is only defined at thrust coefficients greater than zero.

Figure 7. Locomotor performance of foils swimming in an oncoming flow of 0.3 m s−1. Error bars are omitted for clarity (but see figures 8 and 9). Transects through these surfaces are presented in figures 8 and 9 for clarity. Thrust coefficients and efficiencies are dimensionless. Foils were flapped at 49 combinations of frequency and heave amplitude in two pitch programs. Each surface is the mean of n = 5 trials. Self-propulsion occurs where the thrust coefficient is zero.
Download figure:
Standard image High-resolution image
Figure 8. Transect lines through the heaving performance surfaces from figure 7. Rows represent increasing heave amplitude. Error bars (standard error) are obscured by the points (n = 5). Non-uniform foils, particularly the 2_3 foil, often achieved greater thrust coefficients and efficiencies, and at lower flapping frequencies, than uniform foils.
Download figure:
Standard image High-resolution image
Figure 9. Transect lines through the 0° angle of attack performance surfaces from figure 7. Rows represent increasing heave amplitude. Error bars (standard error) are obscured by the points (n = 5). Non-uniform foils often achieved greater thrust coefficients and efficiencies, and at lower flapping frequencies, than uniform foils. While the 2_3 foil had the greatest thrust coefficient and efficiency at low frequencies and heave amplitudes, the 1_3 foil outperformed this foil at high frequencies and heave amplitudes.
Download figure:
Standard image High-resolution imageUnder non-self-propelling conditions, non-uniform stiffness distributions generally led to greater thrust coefficients and higher propulsive efficiencies than observed in the uniform stiffness control cases (figures 7, 8, and 9). In the heaving program, the 2_3 foil, with the biological stiffness pattern, had the largest thrust coefficients and swimming efficiencies in any combination of heaving amplitude and flapping frequency (figure 7).
Compared to the heaving program, the 0° angle of attack program further increased thrust coefficients and efficiencies for all four foils. But, notably, it introduced localized peaks into the performance surfaces that were not observed in the smoother surfaces of heaving program (figure 7). Again, cross-over phenomena were evident. The 2_3 foil always achieved positive thrust coefficients, and consequently, positive swimming efficiencies, first among the foils when frequency and heave amplitude were ramped up (figure 9). Yet, as frequency and heave amplitude continued to increase, the 1_3 foil surpassed the 2_3 foil, the biological stiffness pattern, in both performance metrics (figure 9).
4. Discussion
4.1. Effects of non-uniform stiffness
Previous investigations have revealed that flexural stiffness has significant, albeit complex, impacts on swimming performance. Together, Shelton et al [21] and Lauder et al [33] demonstrated that increased stiffness leads to increased swimming speeds, thrust coefficients, and efficiencies under some conditions, but more flexible models performed better in others. Yet, each of these studies focused solely on uniform stiffness distributions. In contrast, McHenry et al [2] and Riggs et al [34] used models with flexural stiffness decreasing along the length in a manner proportional to the predicted flexural stiffness of a pumpkinseed sunfish. As with Shelton et al [21] and Lauder et al [33], their results revealed that increased stiffness can be advantageous or disadvantageous depending on the operating conditions [2, 34]. But, McHenry et al [2] did not compare performance across stiffness distributions, and it is unclear how their biological stiffness pattern compares to traditional uniform stiffness models. Notably, Riggs et al [34] did make comparisons with a rigid NACA airfoil and found that the fish-like stiffness distribution led to increased thrust. However, Riggs et al [34] presented their data as raw thrust forces, complicating comparisons with other works like Cleaver et al [35], which typically normalize these data as thrust coefficients. Additionally, Riggs et al [34] did not test biologically-relevant stiffness magnitudes. Furthermore, like McHenry et al [2], Riggs et al [34] actuated their models in pitching motions only, whereas fish also make lateral heaving motions [8, 21]. Recently, Cleaver et al [35] reached similar conclusions to Riggs et al [34] by demonstrating that adding a flexible tail to a rigid hydrofoil leads to greater time-averaged thrust output under certain conditions, but Cleaver et al [35] did not test biologically-relevant stiffnesses, distributions, or motions. Therefore, while informative and foundational, these studies preclude a general interpretation of the effect of multiple stiffness distributions under biologically-relevant swimming conditions, and so, collectively, have been unable to demonstrate the contributions of the common bending pattern [1] to biological propulsion.
These previous studies do, however, provide an experimental baseline which suggests several hypotheses. Based on the results of Riggs et al [34], Shelton et al [21], and Cleaver et al [35], we would predict that biological non-uniform stiffness distributions would increase thrust. Furthermore, we would expect maximum swimming speeds and efficiencies when the foils are actuated in biologically-relevant motions including both heave and pitch [32, 33]. Using a mechanical flapping foil controller, we compared the swimming performance of uniform and non-uniform models with biologically-relevant stiffnesses and actuation. In accordance with the above predictions, we found that, with few exceptions, non-uniform models outperformed uniform models, regardless of the operating conditions.
From our findings, it becomes clear that propulsor design and actuation patterns must be selected based on performance goals. Although the 0° angle of attack program consistently led to better performance in terms of high speeds at relatively low costs, a particular combination of flapping frequency and stiffness distribution within this pitch program can be selected to maximize swimming speed or minimize COT. But, as the greatest speed and lowest COT are not achieved simultaneously, the 'best' actuation pattern must be chosen based on the goals at hand, e.g., get somewhere as fast as possible, travel the longest distance for a given cost, or a compromise between the two.
Under non-self-propelling conditions, the 0° angle of attack program, again, consistently led to improved performance in terms of large thrust coefficients at relatively high efficiencies. But, because these metrics were not maximized simultaneously, non-self-propelling conditions led to an analogous conclusion.
Cross-over points like those observed here appear to be a defining feature of swimming via flexible propulsors. For instance, Shelton et al [21] compared foils with different magnitudes of uniform stiffness actuated in a heaving motion program. Generally, Shelton et al [21] found that a stiffer foil achieved higher thrust coefficients and swimming efficiency than a more flexible foil. But, as frequency increased, a cross-over point occurred, and although the stiffer foil still produced the most thrust, the flexible foil had higher swimming efficiency. Together, these findings suggest that there is no one 'best' flexural stiffness distribution; rather, propulsor design must be selected based on how the propulsor will be actuated and on the performance goals.
It is noteworthy that, under non-self-propelling conditions, the non-uniform foils nearly universally outperformed the uniform foils. Particularly, our finding of relatively high thrust coefficients and efficiency values for non-uniform foils at large heave amplitudes under the 0° angle of attack program contrasts with previous work in heaving programs or with rigid swimming foils. For example, at heave amplitudes of 2.0 cm and flow of 0.3 m s−1, the 1_3 foil achieved peak efficiency of nearly 0.45 and a thrust coefficient of 0.5 (figure 9). These values are substantially higher than those for foils moved in the heaving program (figure 8) and approximately twice the values for Shelton et al's [21] stiffest foil moved in the heaving program. The efficiency values for non-uniform foils approach those seen for a rigid foil [36] although thrust coefficients do not reach the absolute magnitudes (1.0 or greater) of coefficients for rigid foils.
Although laboratory experiments emphasize steady-state locomotion of fish, in the field, fish rarely swim in a straight line at a constant speed for any length of time; rather, fish are more typically behaving under non-self-propelling conditions. Our results, collected under biologically-relevant swimming conditions, lead us to propose that fish body's non-uniform stiffness distribution enables effective locomotion by increasing thrust coefficients and swimming efficiencies, and could facilitate tradeoffs among performance goals by actively altering body stiffness locally.
Fish often appear to maintain a 2_3-type bending pattern during moderate-speed steady swimming [1], where the tail typically moves at relatively low heave amplitudes and frequencies [5, 8–10]. These motions correspond to the range where the 2_3 foil achieved the greatest performance, which may explain the conservation of the 2_3-type bending pattern observed by Lucas et al [1] during steady state swimming.
Yet, to accelerate, fish increase their tail-beat amplitudes and frequencies [5, 7, 8, 12, 45]. Moreover, they must recruit more-anteriorly-located muscles, increasing bending along the middle portion of their bodies in a manner qualitatively resembling the bending kinematics of the 1_3 foil. Notably, this foil was able to produce the most thrust under high efficiency during large heave amplitudes and frequencies. Moreover, Tytell et al [25] found that there were different optimal flexural stiffnesses for acceleration (non-self-propelling thrust production) and steady-state swimming speed (SPS). Thus, we hypothesize that, while fish may passively exhibit a 2_3-like stiffness distribution [2] during steady swimming, they may be modifying their flexural stiffness distribution in an active mechanism—active lengthening of muscles [23]—to most effectively achieve their performance needs. In particular, fish may be using a 2_3 stiffness distribution during steady locomotion, but a 1_3 distribution during accelerations.
As discussed in the following paragraphs, it appears that the kinematics resulting from non-uniform stiffness distributions and biologically-relevant actuation are leading to the observed performance differences. While we achieved these kinematics using passive bending mechanisms, which many animals use, it is important to note that active bending mechanisms that arrive at the same kinematics would share these performance benefits. In short, the kinematics themselves, rather than how they are achieved, drives performance.
As a whole, our findings corroborate those of Cleaver et al [35] and Riggs et al [34], who each demonstrated that non-uniform stiffness distributions can improve swimming performance by increasing thrust output. Yet, for each study, these improvements were achieved under different swimming conditions. Cleaver et al [35] found that small heave amplitudes and large flexible components led to the greatest performance. In contrast, Riggs et al [34] found the greatest thrust production at high frequency and heave combinations. Although our data were more similar to the findings of Riggs et al [34], key differences arise in either case. This is likely because neither Riggs et al [34] nor Cleaver et al [35] investigated biologically-relevant stiffness magnitudes and distributions during fish-like motions including both pitch and heave. For instance, our performance surfaces, particularly in the 0° angle of attack program, featured large, transient peaks and valleys (figure 7). These multiple peaks are characteristic of the performance surfaces produced using similar foils and actuation from Quinn et al [32], and may be the result of resonance effects that were not achieved with the much stiffer foils of Cleaver et al [35] and Riggs et al [34]. In sum, we expand on these previous studies by demonstrating that performance benefits from non-uniform stiffness of biological magnitudes are achieved under biologically-relevant swimming conditions.
An outstanding question remains: what are physical mechanisms leading to the observed performances? There are at least three probable factors. First, as a whole, the 0° angle of attack program has been shown to reduce leading edge separation and delay vortex breakdown in the wake, reducing the amount of energy lost to the wake, thereby increasing swimming efficiencies [32].
Second, during body-caudal fin swimming, the body's sinusoidal bending wave produces localized peaks where a small portion of the body is essentially rotating around a point in space [46]. On the concave side of the body, the combination of this rotation and the body's retreating movement create a local region of low pressure, and so fluid is entrained and accelerated downstream [46, 47]. Because it results in an increase in both the size of the low pressure region and the difference in pressure magnitude between this region and free-stream, increasing the magnitude of the body's lateral excursions increases the amount of fluid entrained and accelerated along the body [48]. In turn, this increases the fluid forces produced when these flows reach the tail tip and are shed into the wake as vortices. Thus, we propose that the increased lateral excursions and tail-beat amplitudes of the non-uniform foils are improving thrust production, swimming efficiencies, and swimming speeds by altering the dynamics of pressure distribution along the body.
Finally, the addition of a flexible margin in a jellyfish model increased the spacing between the areas of relatively high and low pressure around the body [48]. This prevented shed vortices from colliding in the wake, canceling, and negating locomotor forces [48]. In fact, when the model's flexible margin was replaced with an equivalent rigid one, the model was not able to produce net thrust [48]. The distribution of flexural stiffness studied in that model—rigid bell with flexible margin—is loosely analogous to the patterns studied here, with rigid anterior regions and flexible tails, and indeed, spacing of pressure cores and vortices has been shown to be critical for thrust production in a fish-like body [47]. These observations suggest an additional mechanism by which non-uniform stiffness distributions may be improving swimming performance, namely, by positioning pressure cores and, hence, shed vortices, more favorably.
4.2. Comparing foil and fish kinematics
Flexible foil models have enabled targeted studies of many factors driving swimming propulsion that would otherwise be impossible in a living fish. To be informative, these models must approximate various morphological characteristics and material properties of the fish's body while faithfully reproducing its movements. Previous research has featured models swimming with kinematics that bear some resemblance to those of fish, for instance, McHenry et al [2], Lauder et al [19], and Shelton et al [21]. These kinematics have generally been achieved by actuating the model in either lateral heave [19, 21, 30, 31] or pitch [2, 34], but not both, with rare exceptions [32, 33]. These models have begun to reveal fundamental mechanisms driving swimming propulsion. However, further refinements to both models and actuation traits are necessary to achieve kinematics that are truly fish-like, thereby enabling more detailed, accurate analyses.
Several modifications could be made to achieve more fish-like characteristics while preserving the simplicity of flexible foil models, for instance, using models with trailing edges cut to reproduce the shape of a fish's caudal fins [19, 22]. In this study, we added fish-inspired non-uniform flexural stiffness distributions and actuation patterns involving both pitch and heave to standard foil models. These refinements, while simple, were able to produce remarkably fish-like kinematics (figure 10). The combination of non-uniform stiffness and 0° angle of attack program caused lateral excursion to increase along the foils in a manner similar to the caudal region of a largemouth bass (Micropterus salmoides) [8]. These changes also, qualitatively, increased curvature along the foils (figures 3 and 10), as is characteristic of the bass body [8]. In this way, we were able to achieve much more accurate reproductions of fish kinematics than those seen in traditional models—uniform foils in a heaving program.

Figure 10. A comparison of kinematics from a largemouth bass (Micropterus salmoides), non-uniform foils actuated in the 0° angle of attack program, and uniform foils in the heaving program, over half a tail-beat cycle. Midline kinematics of a largemouth bass were modified from Jayne and Lauder [8], and foil kinematics are reproduced from figure 3. Although uniform flexible foils in the heaving program have been used extensively in prior investigations of fish locomotion, these foils only very generally replicated the kinematics of swimming fish. Adding non-uniform stiffness distributions and 0° angle of attack actuation allows much more accurate reproductions of the kinematics of swimming fish.
Download figure:
Standard image High-resolution image
Acknowledgments
This work was supported by an NSF Graduate Research Fellowship under grant DGE-1144152 to KNL and by ONR MURI Grant N000141410533 monitored by Dr Bob Brizzolara to GVL. Thanks to Erik Anderson for LabVIEW programming assistance, John Dabiri, Dan Quinn, and Valentina di Santo for many helpful discussions, and Kara Feilich for statistical assistance. We also thank two anonymous reviewers for helpful feedback on an earlier version of this manuscript.