
Abstract
The coalbed gas reservoirs in the Qinshui Basin in central China are highly heterogeneous; thus, the reservoir characteristics are difficult to assess. Research on the pore structure of a reservoir can provide a basis for understanding the occurrence and seepage mechanisms of coal reservoirs, rock physics modeling and the formulation of rational development plans. Therefore, the pore structure characteristics of the coalbed gas reservoirs in the high rank bituminous coal in the No. 15 coal seam of the Carboniferous Taiyuan Group in the Heshun coalbed methane (CBM) blocks in the northeastern Qinshui Basin were analyzed based on pressure mercury and scanning electron microscopy data. The results showed that the effective porosity system of the coal reservoir was mainly composed of pores and microfractures and that the pore throat configuration of the coal reservoir was composed of pores and microthroats. A model was developed based on the porosity and microfractures of the high rank coal rock and the mercury injection and drainage curves. The mercury injection curve model and the coal permeability are well correlated and were more reliable for the analysis of coal and rock pore system connectivity than the mercury drainage curve model. Coal rocks with developed microfractures are highly permeable; the production levels are often high during the initial drainage stages, but they decrease rapidly. A significant portion of the natural gas remains in the strata and cannot be exploited; therefore, the ultimate recovery is rather low. Coal samples with underdeveloped microfractures have lower permeabilities. While the initial production levels are lower, the production cycle is longer, and the ultimate recovery is higher. Therefore, the initial production levels of coal reservoirs with poorly developed microfractures in some regions of China may be low. However, over the long term, due to their higher ultimate recoveries and longer production cycles, the total gas production levels will increase. This understanding can provide an important reference for developing appropriate CBM development plans.
Export citation and abstract BibTeX RIS

Original content from this work may be used under the terms of the Creative Commons Attribution 3.0 licence. Any further distribution of this work must maintain attribution to the author(s) and the title of the work, journal citation and DOI.
1. Introduction
Unconventional oil and gas resources will play a gradually increasing role in the future (Olson et al 2009, Dai et al 2014, Ding et al 2015, Mohammad et al 2015, Wang et al 2016, Zeng et al 2016). This is primarily due to the fact that while conventional oil and gas resources are gradually being depleted, oil and gas consumption by humans continues to increase. On the other hand, with global low-carbon economy and sustainable development initiatives, considerable international efforts are being made to develop clean energy systems (e.g., unconventional oil and gas resources) that can decrease CO2 emissions. Coalbed methane (CBM) is less preferable to tight sandstone gas resources in terms of quality and has a slower development rate and longer payback period. CBM production was only 26.62 × 10⁸ m3 in 2012 (Song et al 2013). The Qinshui Basin, which is located in Shanxi Province in central China, is the main area of CBM production in the country. Coal formations in the upper Paleozoic Carboniferous-Permian terrestrial-marine transitional facies are the main exploration and exploitation targets for CBM.
The depths of coalbed exploitation in the Qinshui Basin mainly range from 300 to 1500 m. The production levels at depths of less than 1000 m are typically relatively high. The daily gas production of single vertical wells after fracturing often exceeds 1000 m3. However, the production levels decrease rapidly with increasing depth, and the minimum daily gas production levels of single deep vertical wells can be less than 100 m3. This phenomenon is primarily related to the increase in the horizontal principal stress difference that occurs with increasing depth (Bao et al 2016, Li et al 2012, Tao et al 2012, Yan et al 2015). Numerical simulations show that for every 1 MPa increase in the stress difference, the coalbed fracturing volumes decrease by approximately 12.5% (Ding et al 2015). Estimations based on this gradient show that the maximum critical depth of coalbed gas exploitation is approximately 1300 m, which is consistent with the low production of single coalbed gas wells at depths of more than 1000 m in Qinnan. Therefore, we argue that coalbed gas exploitation should focus on shallow layers. On the other hand, the stress in the strata changes with increasing depth. Figure 1 shows the relationship between the current principal stress (total stress) of the Carboniferous-Permian coal reservoir in the Fanzhuang block, Qinnan, and the burial depth (Ding et al 2015). In relatively shallow layers, the stresses are σH (horizontal maximum principal stress) > σv (vertical principal stress) > σh (horizontal minimum principal stress). With increasing depth, a stress transition occurs at approximately 600 m, where the stresses gradually change to σv > σH > σh and are dominated by the vertical stress. This phenomenon indicates that fractures that are generated in shallow coalbeds will extend horizontally, whereas those in deep coalbeds will extend vertically. Figure 2(a) shows the daily gas productions of single vertical coalbed gas wells from zone A in the Qinshui Basin (Ding et al 2015). The main coalbed that is exploited by these wells is less than 800 m deep. While the gas production levels high are, the daily production of each well varies significantly. The cumulative water and gas production shows a negative logarithmic relationship (figure 2(b)). The water production rates have a significantly negative effect on gas production.

Figure 1. Relationship between stress and depth in the Carboniferous-Permian coal strata in the Fanzhuang block of the southern Qinshui Basin.
Download figure:
Standard image High-resolution image
Figure 2. (a) Histogram of gas production volume per day. (b) Cumulative water and gas production from single wells in the southern Qinshui Basin.
Download figure:
Standard image High-resolution imageThe factors that affect the ultimate recovery of unconventional oil and gas reservoirs can generally be grouped into three categories: (1) hydraulic fracturing effects; (2) the existence of natural fractures and their connectivity; and (3) the reservoir characteristics. Hydraulic fracturing increases the reservoir permeability via induced fractures. In addition to the geological conditions, the fracturing effects depend heavily on the construction parameters (e.g., the interval and number of perforation clusters). Reservoirs that contain natural fractures are prone to generating high production yields because the presence of natural fractures can significantly improve the reservoir's flow capabilities.
In this paper, we selected the Heshun coalbed gas zone in the northeastern region of the Qinshui Basin as our study area. We analyzed the characteristics of the pore structure of this type of coalbed gas formation using the physical properties, mercury injection, and scanning electron microscopy data of a high-quality Carboniferous Taiyuan coal reservoir in the study region. An analytical model of mercury injection capillary pressure curves for high-rank coal reservoirs was created that simultaneously measured pores and microfractures. We analyzed and validated the mercury drainage and imbibition processes and discussed the relationship between the mercury injection curve patterns and the ultimate recovery.
Mercury injection experiments are mature technology and commonly used to analyze the pore structure of different types of reservoirs; however, previous studies have failed to fully consider the impact of microfractures on mercury injection curve type changes. In this paper, the microfracture development of a coalbed is quantitatively characterized. Microfracture factors were introduced into the mercury analysis for a coal reservoir for the first time, and an engineering application was examined. The research scale of the mercury injection analysis model is nearly microscopic. Through the introduction of microfractures, mercury injection analysis has been improved, allowing a closer examination of the complex deformation of coal reservoirs from the nano- to micro-scale levels. The study results can serve as important reference information for the development of rational coalbed gas development plans.
2. Material and method
2.1. Experimental design
An AutoPore IV 9500 automatic mercury porosimeter was used for the mercury injection experiments. The experiments were conducted at the State Key Laboratory of Oil and Gas Reservoir Geology and Exploitation, Chengdu University of Technology. The experimental procedure followed the State Standard GB/T 21650.1-2008. The Windows operating system was used as the instrument's operation and control system. The instrument provides rapid pressure ramp rates, a flexible and controllable vacuum system, and high-performance low- and high-pressure systems. The following analytical setup conditions were employed: mercury surface tension of 480 mN m−1, mercury contact angle of 140°, maximum pressure of 228 MPa, pore diameters of 0.0038–1000 μm, one high-pressure hydraulic fluid reservoir and two low-pressure hydraulic fluid reservoirs. The mercury injection capillary pressure curve reflects the characteristics of the connective pore throat structures. During the mercury injection experiment, the non-wetting phase displaces the wetting phase during the imbibition process. When the injection pressure is increased to exceed the pore throat capillary pressure, the imbibition mercury saturation degree gradually increases.
2.2. Geological settings
The study area is situated in the Heshun well block of the northeastern Qinshui Basin (figure 3). The Heshun region is situated within the northern–northeastern Zhanshang–Wuxiang–Yangcheng fold belt in the northeastern part of the Qinshui depression block. It is mainly characterized by fold structures. The strata dip to the northwest at approximately 15° and form a monocline. Faults are not well developed, and there are broad and gentle secondary folds. The structures are oriented northern–northeast (Su et al 2005). The main coal formations in the Hushun block are the Carboniferous Upper Series Taiyuan Formation and the Permian Lower Series Shanxi Formation. The Shanxi Formation normally includes three to six coalbeds with an average total coalbed thickness of 2.82 m. The Taiyuan Formation contains four to nine coalbeds with an average total coalbed thickness of 7.43 m. The main target layers are the No. 15 coalbed of the Taiyuan Formation and the No. 3 coalbed of the Shanxi Formation, which are composed of meager coal and anthracite, respectively. This study focuses on the No. 15 coalbed of the Taiyuan Formation, which is thick and widely distributed across this region. Figure 4 shows a stratigraphic column of the coalbeds in the Qinshui Basin and the Heshun block.
2.3. Sampling procedures
We collected high-quality bituminous coal samples of No. 15 coal from the Taiyuan group. The longitudinal sampling interval was 5–30 cm, and 40 coal samples were collected. The samples were collected from the Tianchi coal mine in the Heshun coalbed gas region, which is located in the northeastern area of the Qinshui Basin. The No. 15 coalbed is generally buried at depths of 300–400 m in the study region and is approximately 5 m thick. The R0 value is approximately 1.8%–2.5%, which indicates a meager coal content.

Figure 3. Location map of the study area.
Download figure:
Standard image High-resolution image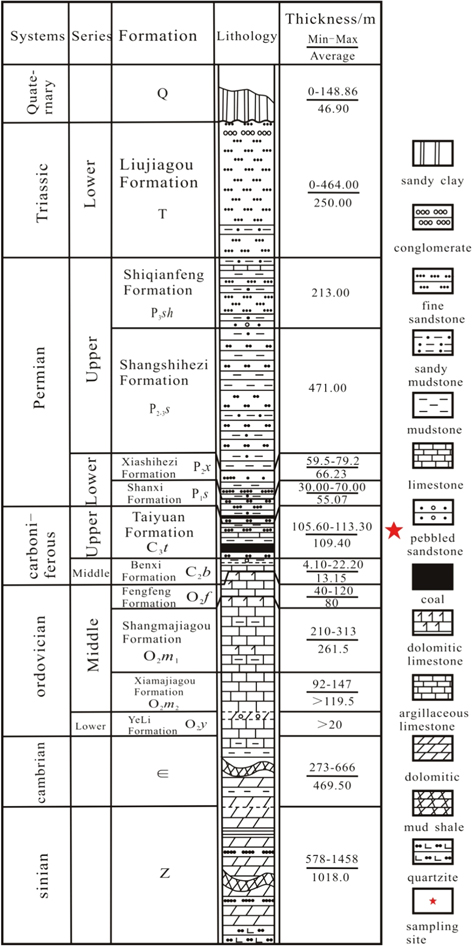
Figure 4. Stratigraphic column of coal-bearing strata of the Heshun district in the Qinshui Basin.
Download figure:
Standard image High-resolution imageFive coal samples were used for the experiments; detailed information regarding these samples is presented in table 1. The size of the coal samples was 2.5 cm in diameter and 6 cm in length. The samples were vertically oriented, cylindrical samples drilled using a water-cooled diamond coring drill. Thin sections were cut from the end of the plug sample on which the measurements were performed. The experiment was completed at a temperature of 25 °C. The experiment was completed in the State Key Laboratory of Oil and Gas Reservoir Geology and Exploration.
Table 1. Basic information about the coal samples.
| Mineral contents (%) | ||||||||||
|---|---|---|---|---|---|---|---|---|---|---|
| Serial number | Coal seam | Coal type | Sampling depth (m) | Number of samples | Ro (%) | Porosity (%) | Gas permeability (mD) | Vitrinite | Inertinite | Other components |
| H_1 | No.15 | Lean coal | 365 | 1 | 2.2 | 14.04 | 0.219 2 | 85 | 10 | 5 |
| H_2 | No.15 | Lean coal | 340 | 1 | 2.2 | 7.6 | 0.111 1 | 80 | 12 | 8 |
| H_3 | No.15 | Lean coal | 355 | 1 | 2.2 | 12.67 | 0.001 1 | 75 | 10 | 15 |
| H_4 | No.15 | Lean coal | 320 | 1 | 2.2 | 11.35 | 0.008 9 | 82 | 3 | 15 |
| H_5 | No.15 | Lean coal | 300 | 1 | 2.2 | 14.24 | 0.009 6 | 77 | 15 | 8 |
We used microscope observations to conduct a quantitative characterization of the microfracture development in the five sample groups (table 2 and figure 5). Under a microscope, the studied coal rocks could be categorized into two groups of fractures (microfractures): principal and secondary fractures. In sample H_1, the principal fractures were approximately 0.02–1.4 cm long, with an average length of 0.4 cm. The widths ranged between 1 and 40 μm, with an average of 8 μm. The principal fracture density was approximately 3.5 cm–1. The lengths of the secondary fractures in sample H_1 ranged between 0.01 and 0.8 cm, with an average length of 0.22 cm. The widths were generally 1–20 μm, with an average of 4 μm. The density of the secondary factures was approximately 2.0 cm–1. The lengths of the principal fractures in samples H_2 to H_5 ranged from 0.01 to 0.8 cm, with an average of 0.2 cm, and the widths ranged from 1 to 18 μm, with an average of 3 μm. The density of the principal fractures was approximately 0.9 cm–1. The lengths of the secondary fractures in samples H_2 to H_5 ranged from 0.01 to 0.4 cm, with an average of 0.1 cm, and the widths were generally 1–15 μm, with an average of 2.5 μm. The density of the secondary fractures was approximately 0.75 cm–1. When the densities of the principal and secondary fractures in a coal rock both exceeded 1 cm–1, we defined the coal rock as a fracture-developed coal rock. When the densities of the principal and secondary fractures were less than 1 cm–1, we defined the coal rock as a fracture-underdeveloped coal rock. Therefore, coal sample H_1 was fracture-developed, coal samples H_2 to H_5 were fracture-underdeveloped, and the reservoir space was dominated by pores.
Table 2. Microfracture parameters of coal samples.
| Length (cm) | Width (μm) | |||||
|---|---|---|---|---|---|---|
| Serial number | Type | Range | Average | Range | Average | Density (cm−1) |
| H_1 | Principal fractures | 0.02–1.4 | 0.40 | 1–40 | 8 | 3.5 |
| Secondary fractures | 0.01–0.8 | 0.22 | 1–20 | 4 | 2 | |
| H_2 | Principal fractures | 0.01–0.8 | 0.28 | 1–18 | 5.6 | 1.7 |
| Secondary fractures | 0.01–0.4 | 0.16 | 1–15 | 3.8 | 1.5 | |
| H_3 | Principal fractures | 0.01–0.8 | 0.09 | 1–18 | 1 | 0.4 |
| Secondary fractures | 0.01–0.4 | 0.05 | 1–15 | 1 | 0.25 | |
| H_4 | Principal fractures | 0.01–0.8 | 0.18 | 1–18 | 3 | 0.6 |
| Secondary fractures | 0.01–0.4 | 0.12 | 1–15 | 2.6 | 0.55 | |
| H_5 | Principal fractures | 0.01–0.8 | 0.24 | 1–18 | 2.5 | 1 |
| Secondary fractures | 0.01–0.4 | 0.12 | 1–15 | 2.5 | 0.7 | |

Figure 5. Quantitative characterization of microfracture development. Notes: (a) the principal microfracture density is 8 cm–1, and the secondary microfracture density is 6 cm–1. The average length of the principal microfracture is 0.3 cm, and the average length of the secondary microfracture is 0.15 cm. (b) The width of the microfracture is 11.77 μm.
Download figure:
Standard image High-resolution image2.4. Experimental methods
The experimental procedure was administered as follows. (1) Open the nitrogen gas valve, turn on the mercury porosimeter and computer, and log into the 9500 operation system. (2) Select the sample tube, seal the sample, paste the sealant, and weigh the sample after sealing. Place the sample tube in the low-pressure chamber after weighing, tighten the low-pressure chamber (not over-tight), and install the measurement tube. (3) Build the sample report file and conduct a low-pressure analysis. After the analysis, remove the sample tube, weigh and record the weight of the sample tube, and prepare for the high-pressure analysis. (4) Start the high-pressure analysis. First, raise the sample tube into the high-pressure chamber, release the handle of the high-pressure chamber, and slowly lower the sample chamber of the high-pressure chamber and the sample tube together. After reaching half the distance, place the sample tube into the high-pressure chamber, and ensure that it is in good contact with the base. Lower the sample chamber, check that the gas vent valve is open, and tighten the sample chamber. During this process, some high-pressure oil and bubbles should be observed entering the small cup above the gas vent valve. Repeat the release-tighten operations to ensure that the bubbles in the high-pressure chamber can be cleared. Start the high pressure analysis. (5) After the analysis, release the gas vent valve, rotate the sample chamber, remove the sample tube, clean up, and dispose of the mercury. Clean the sample tube and seal the parts, bake it dry, exit the system, and finish the experiment.
3. Results and discussion
3.1. Coal seam pore-fracture characteristics
3.1.1. Coal seam pore-fracture characteristics observed by scanning electron microscope
Observations of 33 thin sections of coal-rock samples showed that the vitrinite content was 62%–80% with an average of approximately 70.02%. The inertinite content was generally 10%–25% with an average of approximately 18.48%. The vitrinite/inertinite (V/I) values mainly ranged between 2 and 30. The coal lithotype was mainly composed of clarain and vitrain, and the macroscopic coal lithotype was mainly composed of bright and banded bright coals.
The coal rank was high; the coal mainly contained nano-micropores (<100 nm) and minor numbers of intermediate (100–1000 nm) and large pores (>1000 nm). The intermediate and large pores were mostly located in the inertinite (Li et al 2013). These pores were generally spherical (figure 6(A)), and some were elliptical (similar to elongated bubbles) (figure 6(A)). These features indicate that these pores were formed via hydrocarbon generation. The pores were often connected. The microfractures in the coal reservoir were mainly shear (figures 6(B) and (C)) and extensional fractures (figure 6(D)). The shear fractures are related to compressional tectonic movements, and the extensional fractures are related to hydrocarbon generation, tectonics, uplift and decompression of the strata, and thermal cooling (Nelson 1985). Additionally, observations of the cores show that the coal rocks often contain near-horizontal slip fractures. Slip fractures are often found in mudstones and denote high levels of plasticity in coal rocks (Schmoker 1996). These three types of fractures are all tectonic fractures, which indicates that tectonic fractures dominate the coal rocks. The microfractures are mainly 0.01–2 cm long, and the apertures are generally 1–80 μm wide. The fracture surfaces are mostly unfilled or partially filled (figures 6(B)–(D)), and few are completely filled (figure 6(E)). The microfracture effectiveness is good. Cleats and some of the microfractures are filled with calcite veins, quartz, and clay minerals (figures 6(E) and (F)), which reduce the permeability of the coal reservoir.
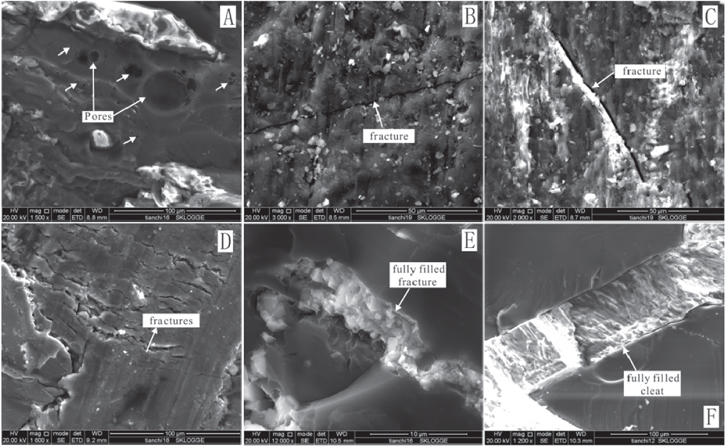
Figure 6. Scanning electron microscope images showing the microscopic characteristics of the No. 15 coal reservoir in the study area. Notes: (A)—spherical shape pores are primarily developed, followed by elliptical-shaped pores. The pore sizes are different, although there is good consistency between the pore shapes; (B)—shear fracture, straight, unfilled in the coal sample; (C)—shear fracture, straight, unfilled in the coal sample; (D)—extension microfractures in the coal sample with a large aperture, showing a sewing rough surface; (E)—fully filled microfractures in the coalbed; and (F)—a set of cleats is developed and fully filled.
Download figure:
Standard image High-resolution image3.1.2. Characteristics of the pore structure based on the mercury intrusion method
We conducted mercury injection tests on the coal samples (table 1). As shown by the histogram of the radii of the pore throats in the coal sample (figure 7), this coal rock mainly contains nano-micropore throats. We compared the pore structure parameters of this coal rock to those of regular sandstone, tight sandstone, shale, and high-rank coal rock from the literature (Nelson 2009, Xu et al 2005) (table 3). The data for tight sandstone samples #5 and #6 are the results of gas logging measurements, and the data for shale sample #12 are mercury injection and small angle neutron scattering measurement results. The data for the other measurements are mercury injection results.

Figure 7. Histograms of the coal pore throat radii from the mercury tests.
Download figure:
Standard image High-resolution imageTable 3. Pore diameters and porosity and permeability parameters of different rocks.
| Sample number | Lithology | Average pore throat diameter μm–1 | Porosity/% | Permeability mD–1 |
|---|---|---|---|---|
| 1 | Medium-grained sandstone | 16.667 | 14 | 25.5 |
| 2 | Fine sandstone | 15.5 | 18.1 | 19.6 |
| 3 | Extremely fine-grained sandstone | 9.667 | 24.2 | 109.7 |
| 4 | Coarse sandstone | 5.667 | 26.3 | 22.3 |
| 5 | Cretaceous Green River sandstone | 0.895 | 7.5 | 17.7 |
| 6 | Cretaceous tight sandstone in the eastern Texas Basin | 0.118 | 4.9 | 1.5 |
| 7 | Pennsylvanian shale in the Anadarko Basin | 0.05 | — | — |
| 8 | Pliocene shale in the Beaufort-Mackenzie Basin | 0.023 | 7.5 | — |
| 9 | shale (America) | 0.012 | — | — |
| 10 | Devonian shale in the Appalachian Basin (poor organic matter) | 0.008 | 7.2 | 1.4 |
| 11 | Devonian shale in the Appalachian Basin (rich organic matter) | 0.024 | 3.6 | 5.1 |
| 12 | Jurassic and Cretaceous shale (Canada) | 0.012 | 4.9 | 1.9 |
| 13 | Coal from the Yangquan Coal Mine in the north Qinshui Basin | 0.052 5 | 3.825 | — |
| 14 | High rank coal (this paper) | 0.086 | 11.98 | 69.98 |
Table 3 shows that conventional sandstone reservoirs have the largest average pore throat diameters, and the corresponding porosity and permeability are relatively high. A sandstone reservoir with a pore diameter of >30 μm and a pore throat diameter of >10 μm is often considered to be a high-quality sandstone reservoir. Compared to conventional sandstone reservoirs, the pore throat diameters of tight sandstone reservoirs are 10–100 times smaller, and the corresponding porosity and permeability of the rocks are much lower. The decrease in permeability is the most significant (table 3). Low permeabilities and high water saturation levels are the main features of tight sandstone reservoirs. The pore diameters are often <10 μm, and the pore throat diameters are often <1 μm. The average pore throat diameters of shale and coal rocks are similar, but that of shale is slightly smaller. Compared to the tight sandstone sample described above, these two average diameters are 10–100 times smaller. The permeability of the shale is in the nD range (table 3).
Table 4 shows the characteristic mercury injection parameters of different coal samples obtained from the mercury injection tests. For coal rocks, smaller average pore throats (Φ) denote a larger proportion of large pores in the rock samples. A small sorting value indicates that the sorting is effective and that a coal-rock reservoir favors one type of pore, though the pores can be large or small. The skewness indicates whether the pore throat distribution in a rock is skewed to larger or smaller pores relative to the average. The skewness of a good coal-rock reservoir is normally approximately zero. The variation coefficient denotes the relative variability of the measurements. Normally, a larger variation coefficient indicates a better coal reservoir.
Table 4. Mercury parameters of the coal samples.
| Serial number | Coal seam | Average(Φ) value | Sorting value | Skewness | Coefficient of variation |
|---|---|---|---|---|---|
| H_1 | No.15 | 14.807 | 3.646 | −1.394 | 0.246 |
| H_2 | No.15 | 14.851 | 3.410 | −1.634 | 0.230 |
| H_3 | No.15 | 16.031 | 1.962 | −2.074 | 0.122 |
| H_4 | No.15 | 15.674 | 2.659 | −2.145 | 0.170 |
| H_5 | No.15 | 15.962 | 2.573 | −2.779 | 0.161 |
In summary, the average value of the No. 15 coal reservoir is large. The sorting value is also large (poor sorting), and the skewness is negative. The deviation from zero is intermediate, and the variation coefficient is small. These results indicate that the pore throat variation in the No. 15 coal reservoir is poor and is almost entirely skewed to small pores. The pore space that corresponds to the mercury imbibition of a throat radius of less than 100 nm in samples H_1 to H_5 accounts for 87%, 90%, 77%, 81%, and 89% of the pore space that corresponds to total mercury imbibition. The pore space that corresponds to the mercury imbibition of a throat radius of less than 10 nm (60% of the corresponding throat radius is less than 5 nm) accounts for 76%, 83%, 71%, 65%, and 79% of the pore space that corresponds to total mercury imbibition. Lower permeabilities denote larger micropore volume proportions. Therefore, the No. 15 coal in the Carboniferous Taiyuan Formation contains numerous micropores. The pore throat configuration of the studied coal reservoir is the micropore–microthroat type.
The characteristics of the mercury injection capillary pressure curve can reflect the pore connectivity in different pore diameter ranges. The mercury imbibitions and drainage curves of the five groups of samples from the No. 15 coal are shown in figure 8. The mercury drainage efficiencies of the five coal samples (H_1 to H_5) are 62.84%, 81.06%, 64.81%, 80.52%, and 74.09%. For high-rank coals, when the mercury drainage efficiency is >50%, the pore connectivity is generally considered to be good (Fan et al 2010). The mercury drainage efficiencies of the No. 15 coal samples range between 62.84% and 81.06% with an average of 72.76%, which indicates that the overall pore connectivity for the No. 15 coalbed in the study region is good. This phenomenon is related to the fact that the coal rocks in this region have generally experienced some degree of tectonic deformation. Under the microscope, the coal rocks exhibit bending deformation features. Therefore, the porosity and permeability of this coal reservoir are relatively good (table 3). The mercury drainage efficiency cannot entirely represent the rock permeability. For example, the permeability of sample H_1 is relatively high (0.2192 mD), whereas its mercury drainage efficiency is the lowest of the five groups of samples.

Figure 8. Mercury injection and drainage curves of the samples of the No. 15 coal.
Download figure:
Standard image High-resolution imageThe mercury injection capillary pressure curves of the different groups of samples are similar. The mercury imbibition and drainage curves form hysteresis loops (figure 8), indicating that the coal rocks are dominated by open pores. The volume difference between the mercury imbibition and drainage curves for the samples is small, which suggests that the coal rocks contain some closed or partially closed pores. The mercury drainage curve of sample H_3 shows a sudden decrease, which indicates that the content of bottle-neck type pores is high. Therefore, while the volume difference between mercury imbibition and drainage for this group of samples is large, the pore connectivity is poor. The permeability of this sample is the lowest of the five groups of samples (0.0011 mD).
3.2. Analysis of the coal reservoir mercury curve model based on pores and microfractures
3.2.1. Development of the mercury curve analysis model
Because the effective pore space of the studied coal reservoir mainly includes pores and microfractures, we developed a model to interpret the mercury injection capillary pressure curve of high-rank coal rock reservoirs that simultaneously considers pores and microfractures (figure 9) to better describe the characteristics of the mercury injection capillary pressure curves of coal reservoirs.

Figure 9. Model of mercury injection and drainage curves that considers the pores and microfractures in the coal rock.
Download figure:
Standard image High-resolution imageThe model assumes that the microfractures can connect the reservoir with surrounding pore clusters (Li et al 2014, Yao and Liu 2012) (pink circle in figure 9) to form a local high permeability zone. Mercury imbibition into these zones only requires low mercury injection pressures. Therefore, during mercury imbibition, mercury preferentially enters these microfractures (solid lines 1–4 in figure 8) and the connected large pore spaces (pink circle in figure 9).
The space that is represented by microfracture 5 is only connected by small pore throats (figure 9); thus, during the initial stages of mercury injection, mercury will not enter this area.
With increasing mercury imbibition pressure, the pore space of the local high permeability zone that is composed of microfractures and connected high pore throats is gradually filled with mercury. In turn, the mercury gradually enters pores with underdeveloped microfractures (unfilled circle in figure 9) through small throat channels between the pores (dashed line in figure 9). Coal is dominated by nano-micropores and throats, and these throats are significantly smaller than the microfractures (Petersen 2006). Therefore, mercury can only enter small throats and their connected pores under high mercury injection pressures.
3.2.2. Analysis of the mercury injection process
Figure 9 shows the variations of the mercury imbibition and drainage curves for coal rocks with developed and underdeveloped microfractures. During mercury imbibition, due to the limited space (microfractures or throats) at the edge of the rock, the initial SHg shows negligible variations with a SHg of 0. Significant mercury imbibition only occurs when the mercury injection pressure increases to points A1 and B1.
With a further increase in the mercury injection pressure, connected microfractures and nearby large pore throats are first filled with mercury (figure 10) (Chen et al 2012). At this point, according to the previous model, developed microfractures in the rock can connect to adjacent pore clusters to form local high permeability zones. Mercury fills these regions preferentially. Therefore, a large amount of mercury can be filled with a small variation in the capillary pressure (i.e., SHg can increase significantly, which corresponds to A2 in figure 9). In coal rocks with underdeveloped microfractures, few microfractures and large pore throats can be filled with mercury. The increase in SHg is smaller (B2 in figure 9). At this point, more mercury can only be added by increasing Pc (capillary pressure).
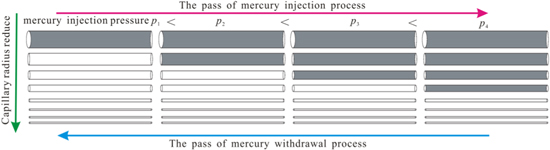
Figure 10. Mercury injection and drainage path model.
Download figure:
Standard image High-resolution imageWith a further increase in the mercury injection pressure during stages A3 and B3, the pressure becomes high enough to allow mercury to enter pores that are connected only by small pore throats (unfilled circle in figure 9). The Pc values that correspond to A3 and B3 are equal, whereas the SHg values vary significantly. The SHg value for coal samples with underdeveloped microfractures (B3) is smaller, which indicates that the rock samples are dominated by pores that are only connected by small pore throats. By contrast, the SHg value of coal samples with developed microfractures (A3) is larger, which indicates that microfractures and their connected pores account for a relatively high proportion of the rock samples. A4 and B4 represent the final stage of mercury imbibition. At this stage, all of the connected pore throats are filled with mercury.
3.2.3. Analysis of mercury drainage process
During the mercury drainage process, M1 and N1 (figure 9) show that the connected pore space in the coal rocks is initially filled with mercury. During drainage, the mercury in the smallest pores and throats with the highest mercury injection pressure drains first (figure 10). The rock samples with underdeveloped microfractures are dominated by pores that are only connected by small pore throats. During this stage, the mercury in these pores discharges preferentially. With small variations in Pc, SHg varies significantly, which corresponds to N2 in figure 9. Because the proportion of pores that are only connected by small pore throats in rock samples with developed microfractures is relatively small, when the variations in Pc are small, the variations in SHg are also quite small (M2 in figure 9).
With further drainage, the mercury in the larger pores and throats is discharged sequentially, which corresponds to M3 and N3 in figure 9. When the mercury drainage pressure decreases to zero, the SHg value of the sample is not zero. This is because microfractures (such as microfracture #5 in figure 9) and the connected large pore throat spaces are connected by small pore throats, so the mercury typically cannot discharge efficiently and therefore remains in the rock samples. Rock samples with underdeveloped microfractures are dominated by pores that are only connected by small pore throats. Mercury can drain efficiently, and therefore, the decrease in SHg is substantial, while the residual mercury content remains low. In rock samples with developed microfractures, few pores are only connected by small pore throats, the proportion of large pore throats and microfractures is large, and the final residual mercury content is high.
3.2.4. Model verification
To verify the reliability of the proposed model, we analyzed the mercury injection capillary pressure curve of every coal sample from the study region. Table 5 shows the measured permeabilities based on gas logging and the mercury drainage efficiencies of the five groups of coal samples. As indicated by the model (figure 9), the mercury imbibition curve that is inclined toward the upper right-hand corner shows that the microfractures in the rock sample are underdeveloped; the permeability of the rock sample is low. The mercury imbibition curve that is inclined toward the bottom left-hand corner shows that the microfractures in the rock sample are developed; thus, the permeability of the rock sample is high.
Table 5. Permeability test results and mercury withdrawal efficiencies of the coal samples.
| Sample number | Gas permeability (mD) | Mercury withdrawal efficiency (%) |
|---|---|---|
| H_1 | 0.219 2 | 62.84 |
| H_2 | 0.111 1 | 81.06 |
| H_3 | 0.001 1 | 64.81 |
| H_4 | 0.008 9 | 80.52 |
| H_5 | 0.009 6 | 74.09 |
The features of the mercury injection capillary pressure curves of the measured coal samples shown in figure 11 (gray box) indicate that the microfractures in sample H_1 are the most well developed (corresponding to its high permeability (table 5)), followed by H_2, which has a lower permeability (table 5). The mercury injection capillary pressure curves of samples H_4 and H_5 are similar, and their corresponding permeabilities are also similar (table 5). The mercury injection capillary pressure curve of sample H_3 is similar to the pattern of curve B1–B2–B3–B4 in figure 9, which indicates that the microfractures are underdeveloped; this corresponds to the lowest permeability (table 5). The results show that the proposed model can effectively describe the variations in the mercury injection capillary pressure curves of high-rank bituminous coal samples and their relationships to the permeability.

Figure 11. Mercury injection and drainage curves of the samples.
Download figure:
Standard image High-resolution imageAs shown in table 5, the mercury drainage efficiency of the coal samples and the permeability measured by gas logging show a weak negative correlation, which indicates that the mercury drainage efficiency cannot be used to accurately describe the connectivity between the pores in rock samples and that the mercury drainage efficiency is somewhat misleading.
Similar to the mercury imbibition curves, the mercury drainage curves of the different groups of coal samples show that the permeability of coal sample H_1 is the highest, which indicates that its microfractures are relatively well developed, followed by sample H_2. The permeabilities of the remaining three groups of coal samples are low and approximately the same order of magnitude. Nonetheless, the mercury drainage curves show that the permeability of sample H_3 is slightly higher than those of samples H_4 and H_5, which is inconsistent with the permeability measurements (table 5). This phenomenon indicates that for the three groups of samples with relatively underdeveloped microfractures, the mercury drainage process is more complex than the mercury imbibition process, primarily because the pore throat relationships for this type of coal rock are highly complex. In general, the pore connectivity in coal rocks that is determined by the mercury imbibition curve model is more reliable than that determined by the mercury drainage curve model.
3.3. Relationship between the mercury curve type and ultimate recovery
Based on these observations, the coal rocks with developed microfractures (H_1) have relatively high permeabilities, which indicates that during the initial drainage stages, the production levels are often high, but production decreases rapidly (figures 8 and 9). A significant fraction of the natural gas content ultimately remains in the strata and cannot be exploited. Therefore, the ultimate recovery of a single well is low. Coal rocks with underdeveloped microfractures (H_3 to H_5) have low permeabilities. While the production during the initial stages is low, the production cycle is long, and the ultimate recovery is high.
To validate this point, we used the mercury injection measurements to calculate the ultimate recovery or the recoverable portion of the natural gas in each group of coal samples. We assumed that the mercury injection limit SHg is the original gas saturation Sgi of the reservoir. The SHg value at the end of mercury drainage is the residual gas saturation Sgr. The ultimate recovery or the recoverable portion of the natural gas in the coalbed gas reservoir can be approximately represented as follows: ultimate recovery = [(Sgi − Sgr)/Sgi] × 100%.
Table 6 shows the calculated ultimate recoveries of each group of coal samples. The results show that the ultimate recovery of sample H_1, which has the highest permeability, is the lowest (only 64.18%). This result indicates that the residual gas content is high, which is consistent with previous findings. Although the permeability of sample H_1 is only twice that of sample H_2, the degree of microfracture development in sample H_1 is significantly higher than that in sample H_2. The microfractures in samples H_2 to H_5 are underdeveloped or are mostly filled, and these pores are generally connected through small pore throats. The ultimate recoveries of the four groups of coal rocks are 65.84%–82.82% with an average of 76.19%. The ultimate recovery is 12.01% higher than that of sample H_1, which has the highest permeability.
Table 6. Permeability test results and ultimate recoveries of the coal samples.
| Sample number | Gas permeability (mD) | Ultimate recovery (%) |
|---|---|---|
| H_1 | 0.219 2 | 64.18 |
| H_2 | 0.111 1 | 82.82 |
| H_3 | 0.001 1 | 65.84 |
| H_4 | 0.008 9 | 81.18 |
| H_5 | 0.009 6 | 74.91 |
The results not only demonstrate the reliability of the conclusion described above but also indicate that the initial production levels of coal reservoirs with relatively poor microfracture development in some regions of China may be low. However, over the long term, due to their higher ultimate recoveries and longer production cycles, the cumulative gas production levels will be higher.
3.4. Numerical analysis
The reservoir parameter of CBM wells X1 and X2 in the study area are similar. The coal reservoir production and development parameters are as follows:
Depth (H) = 400 m, initial formation pressure (pi) = 3.68 MPa, coal seam thickness (h) = 6 m, porosity (φ) = 8%, reservoir temperature (T) = 307.15 K, coalbed density (ρB) = 1.5 g cm−3, formation compression coefficient (cf) = 0.3 × 10⁻⁴ MPa−1, original gas saturation (Sgi) = 50%, gas viscosity (μgi) = 0.03 mPa s−1, gas compression factor (Zi) = 0.96 (desorption is considered), Langmuir volume (VL) = 37 m3 t−1, and Langmuir pressure (PL) = 2.5 MPa.
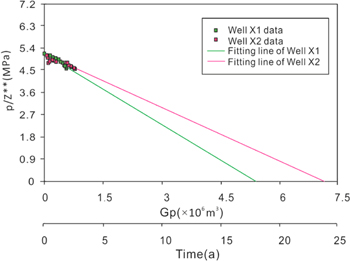
Microfractures in the #15 coalbed in well X1 are well developed, with φf of approximately 2.5%. Microfractures in the #15 coalbed in well X2 are underdeveloped, with φf of approximately 1%. According to the drainage data of these two wells during the 2.5 yr study period, the relationship between the formation pressure/modified gas compression factor (p/Z**) and cumulative gas production (Gp) can be calculated by the material balance equation (figure 12).
Figure 12. The relationship between p/Z** and Gp for wells X1 and X2 in the study area.
Download figure:
Standard image High-resolution image
As shown in figure 12, the material balance equation can be used to fit the production data of the two studied CBM wells. The fit is very good, indicating that this method is effective. Microfractures are well developed in the coalbed of well X1, and well X1 has relatively higher initial production levels than well X2, in which the microfractures are less developed, suggesting that well X1 has a higher Gp value at the beginning of the production process (figure 12). As the production time increases, i.e., approximately 1.25 years later, the productivity of well X1 should decrease. The x-intercept of the fitted line for well X1 is significantly smaller than that of well X2. The gas contents in the X1 and X2 coal reservoirs are the same, and the difference between the reservoirs are mainly embodied in the development of microfractures. Thus, when the CBM reaches the maximum recovery degree, the CBM in well X1 is mainly retained in the microfractures. According to the ultimate recovery of these two CBM wells, the cumulative gas production ratio between well X1 and well X2 can be used to characterize the ultimate recovery of CBM, which is approximately 75%.
The fit of the well X2 production data is good, and the pressure decrease is much smaller than that of well X1. In this paper, the ultimate recovery of the coalbed obtained by MICP experiments is approximately 70%, which is consistent with the numerical simulation results. According to the calculated results presented in figure 12, when reaching the ideal recovery, the production time of a single well (vertical well) is approximately 15–20 years. Coal with underdeveloped microfractures requires more time to reach this recovery than coal with developed microfractures.
4. Conclusions
- (1)The effective space in coal reservoirs in the study region is dominated by pores and microfractures. These pores are generally spherical and elliptical. The microfractures are dominated by tectonic fractures, including shear fractures, extensional fractures, and slip fractures. Most are unfilled or partially filled. Most of the cleats are filled, and their efficiency is poor.
- (2)We developed an analytical model for the mercury injection capillary pressure curves of high-rank coal rock reservoirs that considers both pores and microfractures. This mercury imbibition model is consistent with the permeability of the coal rock. The mercury imbibition model is more reliable than the mercury drainage model for analyzing the pore connectivity of coal rocks.
- (3)Coal rocks with well-developed microfractures have high permeabilities. During the initial drainage stages, the production levels are often high; however, they decrease rapidly. A significant portion of the natural gas ultimately remains in the strata and cannot be exploited; therefore, the ultimate recovery is relatively low. Coal samples with underdeveloped microfractures have lower permeabilities. While the initial production levels are lower, the production cycle is longer, and the ultimate recovery is higher.
- (4)The initial production levels of coal reservoirs with poor microfracture development in some regions of China may be low. However, over the long term, due to their higher ultimate recoveries and longer production cycles, their cumulative gas production levels will increase. This finding can serve as an important reference when forming rational coalbed gas drainage development plans.
Acknowledgments
This research was supported by the National Natural Science Foundation of China (Grant Nos 41372139 and 41072098) and the National Science and Technology Major Project of China (2016ZX05046-003, 2011ZX05018-001-002, 2011ZX05033-004 and 2011ZX05009-002-205). The authors would like to thank the staff of all of the laboratories that cooperated in performing the tests and analyses. We are also grateful to the anonymous reviewers, whose comments improved the quality of this manuscript.