


Abstract
The safety of future fusion reactors is critically dependent on the tritium (T) retention in plasma-facing materials. Hydrogen isotope (HI) exchange offers a method to redistribute HIs within solid materials, presenting a feasible approach for removing T from bulk materials and trapped by strong trapping sites. Nonetheless, unraveling the intricate mechanism behind HI exchange remains an urgent yet formidable challenge. This study undertakes a comprehensive investigation into the mechanism of HI exchange in tungsten materials across multiple scales. First, we developed a multi-component hydrogen isotope transport and exchange model (HIDTX) based on classical rate theory. The model validation was further carried out, demonstrating good consistency with the well-controlled laboratory experiments. From the results of different comparative models in HIDTX, it is found that the reduction in deuterium retention due to HI exchange was primarily driven by three synergistic effects: competitive re-trapping, collision, and swapping effects. Through molecular dynamics (MD) and first-principles calculations, the microscopic mechanism of HI exchange was revealed to be that the presence of hydrogen atoms in the interstitial sites surrounding a vacancy in tungsten decreased the binding energy between the vacancy and hydrogen. Meanwhile, we discovered that the combination of thermal desorption and HI exchange can significantly lower the temperature required for the hydrogen removal and enhance the removal rate. Particularly, the hydrogen removal time can be shortened by approximately 95% with simultaneous HI exchange compared to that with only thermal desorption. This work provides a practical guideline for comprehending and subsequently designing for efficient T removal in future nuclear fusion materials.
Export citation and abstract BibTeX RIS

Original content from this work may be used under the terms of the Creative Commons Attribution 4.0 license. Any further distribution of this work must maintain attribution to the author(s) and the title of the work, journal citation and DOI.
1. Introduction
Deuterium (D) and tritium (T), as hydrogen isotopes (HIs), are the preferred fuels for future fusion reactors due to the large reaction cross-section and high energy release rate [1]. During fusion discharges, plasma-facing materials (PFMs) are exposed to low-energy and high-flux D–T plasma. A portion of the fuel will detach from the scrape-off layer and be implemented into PFMs [2]. However, T is a very expensive and radioactive element. Its retention in materials leads not only to fuel loss but also to radioactive contamination. The safety of future fusion devices is greatly dependent on the amount of T retention in materials [3–7]. Although tungsten (W), one of the preferred PFMs, has the advantage of low HIs retention [8–12], there will still be a large amount of T retained in W due to a significant number of trapping sites (TS) generated under the irradiation of 14.1 MeV fusion neutrons. All these make the removal of retained T from fusion materials a crucial task.
Currently, T removal methods mainly include baking [13–15], discharge cleaning [16, 17], laser scan [18, 19], etc. Among these, baking is widely used, but its efficiency is limited by the temperature due to the need for protecting materials and components, resulting in a relatively low T removal efficiency. Discharge cleaning is effective in removing surface deposits, but it may cause additional material damage, leading to T re-adsorption during the cooling after thermal excitation. Laser scan is a recently developed surface T removal method, but its process and system are quite complex, resulting in long T removal cycles. Moreover, these two methods are only effective in the near-surface layer (∼10 nm) in materials and have limited removal efficiency in the bulk region or T trapped by strong TS sites. Isotope exchange, through atomic swapping, can achieve isotopes concentration redistribution in solid materials. It provides the feasibility to remove the retained T in the bulk and strong TS sites. Thus, HI exchange is considered as one of the important candidate methods for T removal in future fusion materials [20].
Several excellent experimental studies have demonstrated that isotope exchange can effectively remove retained HIs [21–30]. Schwarz–Selinger and Alimov et al [23, 24] implanted D and H plasma sequentially into W. They observed strong isotope exchange appeared near the W surface at room temperature, while extended to all depths at elevated temperatures, achieving up to 90% removal efficiency. In our previous study [30], the T and D gas exposure was performed for C–W mixed materials. It is found that T desorption decreased significantly at the high-temperature stage, indicating the T retained in the strong TS sites was exchanged by D. In addition, some researchers have also theoretically confirmed the feasibility of HI exchange using micro-scale theoretical calculations [31–39]. Liu et al found that when one HIs species is trapped by a TS site which is already occupied by another HIs species, the de-trapping barrier of this TS site is reduced, providing an opportunity for another isotope to be de-trapped [36]. Lindblom et al revealed that the presence of H near a vacancy which is already occupied by T can accelerate the T de-trapping process [39]. All these findings provide a reliable theoretical basis for the macro-scale modeling and simulation of HI exchange behavior.
Macroscopic rate theory is commonly used for H migration behavior in materials [9, 40–47]. Typically, the classical model identifies the behavior of single-component HIs in materials into three processes: diffusion, trapping, and de-trapping. After entering the material, single-component HIs diffuse through interstitial lattice sites (LS) under a concentration gradient. If there is a TS site nearby, HIs tend to be trapped there due to the higher binding energy of TS site with HIs. As the temperature increases, the trapped HIs will be thermally activated to de-trap from the TS site and then jump into the nearby LS site. Considerable research efforts have utilized the rate theory model to investigate HIs diffusion and trapping/de-trapping processes. Several simulation codes were developed, such as TMAP [48], DIFFUSE [49], MHIMS [47], and HIDT [9, 46]. All these modeling and simulation works have proved the effectiveness of the classical macroscopic rate theory in studying HIs migration in materials. However, taking above HI exchange into account, these models or codes remain nonnegligible limitations. For instance, one of the great challenges using rate equations is that multi-component HIs behave separately in the same way as single-component HIs, involving only diffusion, trapping, and de-trapping processes. It does not explicitly account for the process of HI exchange. Therefore, when employing classical rate theory to simulate the HI exchange process, the newly implanted HIs in the bulk can only diffuse through TS sites which are already occupied by HIs, instead of exchange with the trapped HIs. This suggests that classical rate theory cannot accurately describe the process leading to a reduction in HIs retention through HI exchange. Therefore, to investigate the mechanism of T removal in PFMs, modeling and simulation of HI exchange behavior based on the rate theory are facing challenges and it is worthwhile devoting much effort to this.
In this study, the collision and swapping effects in HI exchange were firstly integrated into the classical rate theory. A macroscopic HI migration and exchange model, namely hydrogen isotopes diffusion, trapping, and exchange (HIDTX), was successfully established (section 2). Then, this model was validated with the well-controlled laboratory experiments (section 3). After that, various effects were compared to explore the influence of different exchange mechanisms (section 4). In section 5, the microscopic mechanism of HI exchange was revealed through molecular dynamics (MD) and first-principles calculations. Furthermore, T removal efficiency by simultaneous isotope exchange and thermal desorption was investigated. This work provides a multi-scale explanation of the HI exchange mechanism and establishes a theoretical foundation for T removal in PFMs.
2. Basic model of HI exchange
Currently, the transport theory of single-component HIs in metallic materials has been relatively well investigated, while multi-component HIs, although having similar chemical properties, is less successful and still require further research. In this section, a brief introduction to our previously established single-component HIs transport model, namely hydrogen isotopes diffusion and trapping (HIDT) [46], is provided. Then, we will place emphasis on introducing the established HI exchange model.
2.1. Single-component HIs transport model
HIDT was developed based on the macroscopic rate theory for the diffusion and trapping/de-trapping behavior of single-component HIs in metals. As to BCC metal, the overall governing equation for the evolution of its internal HIs concentration can be represented as follows [50]:
where  represents the diffusion coefficient of HIs in materials,
  and
and  are the concentration of HIs at LS and TS sites, respectively.
  represents the external source of the HIs. The diffusion coefficient can be determined using the Arrhenius relationship:

where  is the pre-exponential factor of the diffusion coefficient,
  is the diffusion activation energy,
  is the Boltzmann constant,
  is the temperature. The diffusion coefficient shows mass dependence with regard to different species of HIs. It can be calculated by the classical harmonic model
  , where
  and
and  is the pre-exponential factor of diffusion coefficient and the mass of H. The
  in equation (1) represents the HIs concentration evolution at TS sites, indicating the trapping and de-trapping processes. If this value is positive, it means the trapping process. Otherwise, it indicates the de-trapping process. The overall changes of HIs concentration trapped at TS sites is given by [51]:
where  is the attempt frequency,
  is the binding energy of HIs with TS sites,
  and
and  are the total concentrations of LS and TS sites in the material, respectively.
At the W surface, H2 primarily undergoes molecular dissociation, forming atomic H, then subsequently dissolves into the surface layer. This process can be simplified by considering an external source, denoting as the implantation process. It can be expressed as  , which represents a forced boundary condition. Here,
  is the implantation flux of HIs,
  is the reflection coefficient, and
  represents the depth distribution of the implanted HIs particles.
The inverse process involves atomic diffusion to the surface, followed by recombination into molecules. The specific boundary conditions can be obtained based on our previous work [46]. Based on the model described above, we developed the HIDT code, which has been validated and compared with experimental data, confirming its accuracy and reliability.
2.2. Multi-component HIs exchange model
The multi-component HIs exchange model (HIDTX) is built upon the aforementioned single-component HIs transport model. It can simultaneously express the transport and exchange behaviors among various HIs species. According to equation (1), the overall transport equations for HIs-i and HIs-j in the material can be represented separately as equation (4). The symbols i and j represent HIs species, i.e. H, D, and T.
However, these equations do not consider the HI exchange behavior between HIs-i and HIs-j, thus unable to represent the actual processes. Therefore, in this work, we divided the HI exchange into the collision and swapping effects, as shown in figure 1. Then, these two effects are integrated into the diffusion trapping/de-trapping equations described in equation (3). The specific expressions are given by equation (5) [52].
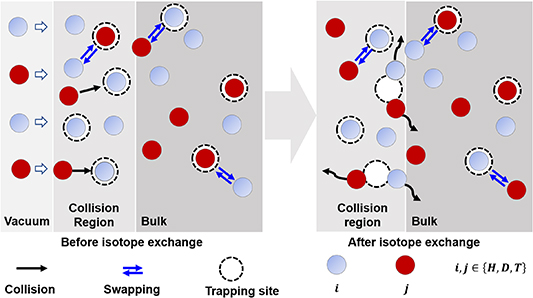
Figure 1. Schematics of hydrogen isotope exchange behavior involving collision and swapping effects.
Download figure:
Standard image High-resolution imageHere,  in equation (5) is the trapping and de-trapping of HIs-i at TS sites. The
  is the collision effect. It represents the implanted HIs-j has a certain probability colliding with the trapped HIs-i at TS sites in the particle implantation region, leading to HIs-i being de-trapped from TS sites. The
  is the swapping effect. It represents a direct exchange between HIs-i and HIs-j.
Generally, the number of collided HIs-j or HIs-i atoms is proportional to the following factors: (1) the collision cross-section ( ) between HIs-i and HIs-j; (2) the total fluence of implanted HIs-i or HIs-j in the material (
 or
or  ); and (3) the concentration of HIs-j or HIs-i trapped by TS sites (
 or
or  ). Based on these factors, the isotopes collision term can be defined as follows:
Here,  represents the maximum depth of HIs implantation,
  denotes the depth at a specific point in this range. When HIs at TS sites are collided, they acquire a portion of the implanted atom's energy. The amount of energy acquired will determine whether de-trapping occurs. However, this energy is influenced by various factors, including the energy possessed by the incident particle, the angle of collision, the depth of the collision, and the binding energy between HIs and TS sites. Obtaining precise data for these factors is currently challenging. So, in this work, we simplified the modeling by using the average collision cross-section (
 ). The average collision cross-section can be considered as the cross-section for desorption of HIs after being impacted and acquiring energy. In collisions, D can transfer more energy to T than H because of their smaller mass difference. Therefore, collision effects between different HIs require the use of different average collision cross-sections.
Regarding the swapping effect, HIs-i or HIs-j trapped by TS sites may undergo thermal activation, leading to a direct exchange with neighboring HIs-j or HIs-i. It is noteworthy that this thermal activation process becomes more pronounced with increasing the temperature, which explains the possibility of isotopic exchange between HIs at LS and TS sites [23, 24].
During the swapping process, the increase in the number of HIs-j atoms at TS sites is influenced by the following factors: (1) the oscillation frequency of HIs moving between TS and LS sites ( ); (2) the probability of neighboring sites being occupied by HIs-j at LS sites (
 ); and (3) the concentration of HIs-i occupied TS sites (
 ).
).
Therefore, the increased concentration of HIs-j atoms at TS sites due to the swapping effect can be expressed as:
where  and
and  can be expressed as follows:
where  represents the activation energy for swapping. Similarly, the decreasing number of HIs-j atoms at TS sites due to swapping process is related to the following factors: (1) the oscillation frequency of HIs moving between TS and LS sites (
 ); (2) the probability of the neighboring sites being occupied by HIs-i at LS sites (
 ); and (3) the concentration of HIs-j occupied TS sites (
 ). Therefore, the concentration evolution of HIs-j atoms at TS sites due to the swapping effect can be expressed as:

where  can be expressed as follows:
By combining equations (8)–(10), the net concentration changes of HIs-j atoms at TS sites due to swapping effect can be defined as:

Similarly, the net concentration changes of HIs-i atoms due to swapping effect ( ) can be obtained. Until here, we have developed a multi-component HIs transport and exchange model, through which the concentration variation and depth distribution of multi-component HIs during the exchange process can be calculated. A glossary of coefficients used in the HIDTX model is summarized in
  ) in equation (2), recent studies have shown the isotope effect in hydrogen diffusion does not follow this mass dependence [53, 54]. However, in the present model, we have evaluated the ratios of diffusion rates among different HIs at the temperature range of 300–600 K. It is showed the exchanged amount of D changes only slightly, and the overall trend remains unchanged. Therefore, in order to be consistent with the classical harmonic model of the isotope effect as the square root of an isotope mass ratio, a ratio of 1.41 for the diffusion rates between H and D was used in the following work.
3. Model validations
In section 2, this study successfully established the HIDTX model, but its reliability remains to be verified. To assess the effectiveness and accuracy of the HIDTX model, we validated the simulation results with experimental data obtained from well-controlled laboratory experiments conducted by Roth et al [23].
3.1. Experimental and simulation parameters
In Roth et al's work [23], the recrystallized polycrystalline W sample was initially heated to 320 K or 450 K and then exposed to  ions with an energy of 200 eV and a flux of
  =1 × 10²⁰ m−2s−1 for 10 000 s. Subsequently, the sample was implanted with H ions at different flux, where the energy of H ions was 200 eV and the flux
  =9 × 10¹⁸ m−2 s−1. To enhance the credibility of the comparisons, all known experimental conditions in [23], including the temperature, implantation flux and fluence, and sample size, were used in HIDXT model. The basic parameters for both the single-component HIs transport model and the multi-component HIs exchange transport model are presented in table 1. Currently, there is limited research on collision cross-sections and swapping activation energies. The specific values used in this study for collision cross-sections and swapping activation energies are derived from the experimental evaluations in the HIDTX model. Details of the collision cross-section data testing are provided in section 4.3, and the approach for obtaining swapping activation energy data is similar to that for collision cross-section data.
Table 1. Basic simulation parameters for HIs transport model.
| Parameter | Symbol | Value | References |
|---|---|---|---|
| Atomic density of tungsten |

| 6.3 × 1028 m−3 | |
| Density of lattice site |

| 3.8 × 1029 m−3 | DFT calculation [33] |
| Jumping frequency |

| 1 × 10¹³ s−1 | DFT calculation [33] |
| Diffusion activation energy |

| 0.39 eV | Experiment [55] |
| Diffusion coefficient of H |

| 4.1 × 10⁻⁷ m2 s−1 | Experiment [55] |
| Binding energy between TS sites and HIs |

| 1.0–1.2 eV | Experiment [9, 56] |
| Collision cross-section |

|
 cm2 cm2
| This work (Evaluated in HIDTX presented in section 4.3) |
| Swapping activation energy |

| 0.7 eV | This work (Evaluated in HIDTX) |
3.2. Simulation and experimental results
When D atoms diffuse through W lattice and encounter TS sites, they are typically trapped by the TS sites due to the higher binding energy of D with TS sites. In the experiment, W was irradiated with D particles for 10 000 s at a high flux. Under this condition, D can cover almost all TS sites along the diffusion path. Therefore, we generally consider the distribution of D concentration with depth to be equivalent to the distribution of TS concentration with depth.
The simulation and experimental results are presented in figure 2, with the experimental data obtained through point interpolation based on the experimental data from Roth et al [23]. From the depth profiles measured by NRA in figures 2(a) and (b), it can be observed that without H implantation, at 320 K and 450 K, the D concentration at TS sites is highest in the top 0.5 µm, reaching up to 8% D/W. With increasing the depth, the D concentration gradually decreases to 1 × 10⁻¹% and 6 × 10⁻³% D/W at 320 K and 450 K, respectively. During D implantation, W suffers thermal and energetic ions irradiation, resulting in the accumulation of TS sites near the surface. The concentration of TS sites reaches up to 8% D/W near the surface. As to the deeper depth, the effectiveness of TS sites generation induced by irradiation gradually diminishes. As a result, within the depth range of 0–0.5 µm, the TS site concentration gradually decreases to around 1 × 10⁻²% D/W. This concentration is sustained within the range of 0.5–7.4 µm. The total D retention amount within the top 7.4 µm is 2.6 × 10²⁰ at 320 K and 1.4 × 10²⁰ D m−2 at 450 K. When the D implanted W were further exposed to H implantation, it is found that the D retention within the surface layer is reduced by approximately 40% and 70% at 320 K and 450 K, respectively, with the H fluence of 7.5 × 10²² H m−2. With a further increase in the H implantation fluence to 7.5 × 10²³ H m−2, the D retention is decreased by approximately 50% and 90% at 320 K and 450 K, respectively. The significant reduction in D retention at 320 K predominantly occurs within the top 0.5 µm. While at 450 K, this significant reduction in D retention occurs not only within the top 0.5 µm but also extends to the deeper depth of 0.5–7.4 µm. It indicates the pronounced decrease in D retention is essentially due to the occurrence of HI exchange effects when H diffuses through the D-occupied TS sites, resulting in the de-trapping of D from these sites. Furthermore, this effect can extend to the deeper regions with increasing the temperature.

Figure 2. Comparison between HIDTX simulation and experimental results. (a) and (b) at 320 K and 450 K, the distribution of D concentration within the top 7.4 µm, measured using NRA, for various H fluences; (c) D retention with different H implantation fluences.
Download figure:
Standard image High-resolution imageRegarding the simulation results, it can be seen that without H implantation, the D concentration depth profile is consistent with the experimental data. The total D retention in the top 7.4 µm also shows a good agreement, indicating HIDTX model can successfully reproduce the classical rate model under the environment of a single-component HIs transport. When continuing the simulation of H implantation after the D implantation, the total D retention within the top 7.4 µm depth is overestimated at 320 K, while at 450 K, is consistent with the experimental results. The overall trend of the D concentration distribution follows the experimental results well. The comparison of the total retentions between experimental and simulations is shown in figure 2(c). It is seen that with increasing H implantation fluence, the D retention further decreases. Moreover, at 450 K, the decreases in D retention is more pronounced. In the simulations, by increasing the H implantation fluence to 7.5 × 10²³ H m−2, the results demonstrate the same decreasing trend of D retention. This suggests that the HIDTX model, which includes HI exchange effects, is also successful in simulating multi-component HIs exchange transport. Specifically, during the H implantation after D implantation, the implanted H not only diffuses through D-occupied TS sites but also undergoes HI exchange with D at the passed TS sites, leading to D de-trapping.
The simulated retention of D exhibits slight differences compared to the experimental data. This difference is associated with the implantation fluence. Under the condition of no H implantation, the simulated depth profile of D concentration and retention match the experimental data well. At 320 K, the D retention is consistently overestimated with increasing the H implantation fluence. At 450 K, under low H implantation fluence (7.5 × 10²² H m−2), the simulated concentration and retention is slightly lower than that from experiments. When the H implantation fluence is higher (7.5 × 10²³ H m−2), their discrepancy becomes more obvious. This discrepancy is likely attributed to various factors, such as the selection of simulated values for collision cross-sections, swapping activation energy, binding energies, etc. For example, the swapping effect is a thermally activated process, as indicated by equation (11), which may result in a less pronounced decrease in the retention of D at lower temperatures (320 K) and a more substantial decrease at higher temperatures (450 K). Additionally, the model itself may contribute to these differences, involving aspects like the configuration of various trap types, incorporation of defect evolution models, among others. Multiple TS within the material may have lower de-trapping energies, allowing D to de-trap at 320 K. However, in this study, only one type of TS with de-trapping prevention between 320 K and 450 K is considered. As a result, the D retention at 320 K is overestimated. At 450 K, D can de-trap from these low de-trapping energy TS. However, under higher temperature irradiation conditions (450 K), the surface of W is more prone to generating new TS sites (defects). This phenomenon is enhanced with an increase in the H implantation fluence. Therefore, at high H implantation fluence, the exchanged D can be trapped again by newly generated TS sites, resulting increasing the D retention. In summary, even though a bit of the numerical discrepancies appears, it is in an acceptable range for the simulation, proving the effectivity and accuracy of the HIDTX model. For more model validations, please refer to the supplementary material.
4. Effects of isotope exchange on HIs retention
HIDTX model has been established and well validated against experiments. However, the effects of different HI exchange mechanisms are not well understood. In this section, various comparative models for HI exchange are established. Different effects of HI exchange on D retention are systematically investigated.
4.1. Simulation models and process
As described in section 2.2, the influence of HI exchange on HIs transport behavior can be considered as two effects: collision and swapping. To a better understanding, we have constructed four cases of simulation models, marked as A, B, C, and D, as listed in table 2. In actual fusion reactors, T removal is commonly achieved through the exchange of either H or D with T. For the sake of better analysis and discussion, we focus exclusively on the exchange between H and D, as their underlying principles are analogous. Therefore, in the following works, two HIs species, HIs-i and HIs-j, represent H and D, respectively.
Table 2. Different comparative models of HIs transport and exchange.
| Model | Equation |
|---|---|
| A |

|
| B |
![$\left\{ \begin{array}{*{20}{c}} {\frac{{\partial {C_{TH}}}}{{\partial t}} = {v_0}{e^{\frac{{ - {E_{\text{d}}}}}{{k \times T}}}}\left( {\frac{{{N_T} - {C_{TH}} - {C_{TD}}}}{{{N_L}}}{C_{LH}} - {e^{\frac{{ - {E_{\text{b}}}}}{{k \times T}}}}{C_{TH}}} \right) - P_{{\text{dt}}}^H} \\ [5pt] {\frac{{\partial {C_{TD}}}}{{\partial t}} = {v_0}{e^{\frac{{ - {E_{\text{d}}}}}{{k \times T}}}}\left( {\frac{{{N_T} - {C_{TH}} - {C_{TD}}}}{{{N_L}}}{C_{LD}} - {e^{\frac{{ - {E_b}}}{{k \times T}}}}{C_{TD}}} \right) - P_{{\text{dt}}}^D} \end{array}\right.$](https://content.cld.iop.org/journals/0029-5515/64/4/046011/revision2/nfad280bieqn57.gif)
|
| C |
![$\left\{ \begin{array}{*{20}{c}} {\frac{{\partial {C_{TH}}}}{{\partial t}} = {v_0}{e^{\frac{{ - {E_{\text{d}}}}}{{k \times T}}}}\left( {\frac{{{N_T} - {C_{TH}} - {C_{TD}}}}{{{N_L}}} \times {C_{LH}} - {e^{\frac{{ - {E_{\text{b}}}}}{{k \times T}}}}{C_{TH}}} \right) + P_{{\text{swap}}}^H} \\[5pt] {\frac{{\partial {C_{TD}}}}{{\partial t}} = {v_0}{e^{\frac{{ - {E_{\text{d}}}}}{{k \times T}}}}\left( {\frac{{{N_T} - {C_{TH}} - {C_{TD}}}}{{{N_L}}} \times {C_{LD}} - {e^{\frac{{ - {E_{\text{b}}}}}{{k \times T}}}}{C_{TD}}} \right) + P_{{\text{swap}}}^D} \end{array}\right.$](https://content.cld.iop.org/journals/0029-5515/64/4/046011/revision2/nfad280bieqn58.gif)
|
| D |
![$\left\{ \begin{array}{*{20}{c}} {\frac{{\partial {C_{TH}}}}{{\partial t}} = {v_0}{e^{\frac{{ - {E_{\text{d}}}}}{{k \times T}}}}\left( {\frac{{{N_T} - {C_{TH}} - {C_{TD}}}}{{{N_L}}}{C_{LH}} - {e^{\frac{{ - {E_{\text{b}}}}}{{k \times T}}}}{C_{TH}}} \right) - P_{{\text{dt}}}^H + P_{{\text{swap}}}^H} \\ [5pt] {\frac{{\partial {C_{TD}}}}{{\partial t}} = {v_0}{e^{\frac{{ - {E_{\text{d}}}}}{{k \times T}}}}\left( {\frac{{{N_T} - {C_{TH}} - {C_{TD}}}}{{{N_L}}}{C_{LD}} - {e^{\frac{{ - {E_{\text{b}}}}}{{k \times T}}}}{C_{TD}}} \right) - P_{{\text{dt}}}^D + P_{{\text{swap}}}^D} \end{array}\right.$](https://content.cld.iop.org/journals/0029-5515/64/4/046011/revision2/nfad280bieqn59.gif)
|
Among them, Model A represents the absence of HI exchange. Model B includes only the collision effect ( ) of HI exchange. Model C includes only swapping effect (
 ), and Model D incorporates both collision and swapping effects (
 and
and  ). The distinctions among Model A, B, and C will be examined in this section. Model D will be employed in subsequent discussion (section 5.3). The basic simulation parameters are provided in table 1. It is important to highlight that the collision effect strictly occurs within the depth range of particle implantation. To observe this influence more comprehensively, the depth range of particle implantation need to be expanded. Therefore, an implantation energy of 3 keV for H/D particles was used. The depth distribution of H/D implanted into W is shown in figure 3. A Gaussian peak is observed near 20 nm, extending to approximately 40 nm. The distribution of H and D atoms shows a similar profile, confirming that H can collide with D.

Figure 3. Depth distribution of 3 keV implanted H/D in W calculated by SRIM code.
Download figure:
Standard image High-resolution imageThe depth at which H retained in W behaves a wide exponential range from ∼nm (1 × 10⁻⁹ m) to ∼mm(1 × 10⁻⁶ m), i.e. the near-surface layer (up to a depth of ∼30 nm), the sub-surface layer (from ∼30 nm to ∼1 mm), and the bulk (>1 mm) [57, 58]. It is not feasible to use uniform meshes. Therefore, nonuniform space steps and nonuniform time steps were used in HIDTX. Additionally, to simplify computational complexity, the HIDTX model was constructed as a one-dimensional model.
Simulation procedures are illustrated in figure 4. Firstly, the basic parameters, as listed in table 1, were input into the HIDTX code. Then, intrinsic TS sites with a uniform distribution from the implantation surface to  = 40 nm–0.5 mm were set in the pure W sample with dimensions of 10 mm in length and width, and 0.5 mm in thickness. Since the fundamental exchange mechanisms remain consistent whether the TS site distributions is uniform or non-uniform, a uniform TS distribution was applied in this work. The TS site concentration was 1 × 10⁻⁴ TS/W. The binding energy between TS sites and HIs was set constant as
  = 1.0–1.2 eV, where
  = 1.0 eV corresponds to the trapping by clusters [56], and
  = 1.2 eV corresponds to that by vacancies [9, 56]. The average collision cross-section was
  = 1 × 10⁻²⁰–1 × 10⁻²² cm2.

Figure 4. Simulation procedures for comparative models of multi-component HIs exchange and transport.
Download figure:
Standard image High-resolution imageAfter that, D implantation on W was performed, followed by H implantation on the D-retained W which simulating the HI exchange reactions. During H implantation, different models were selected to compared isotope exchange effects on HIs migration behavior. The materials temperature was set as = 300–400 K, and the implantation fluxes for D and H were set as
  = 1 × 10¹⁸ and
  = 0–1 × 10²⁰ m−2 s−1, respectively. The implantation time for both D and H was 10 000 s. Finally, the influence of various effects on D retention was comprehensively investigated.
4.2. Competitive re-trapping effect
Incorporating multiple HIs into the classical rate model, when one HIs species (e.g. D) is de-trapped from a TS site and enters a LS site, another HIs species (e.g. H) at a LS site has opportunities to occupy this TS site, preventing re-trapping of the first HIs (D). Here, this HI exchange, as observed in the classical rate model, is referred as the competitive re-trapping effect.
To investigate the influence of the competitive re-trapping effect, D removal during H implantation was calculated based on Model A (without HI exchange). The implantation temperature is 400 K, TS site depth  = 0.5 mm, binding energy
  = 1.0 eV, and H implantation flux
  = 0– 1 × 10¹⁹ m−2 s−1. The D retention change during the H implantation process under various conditions is shown in figure 5.

Figure 5. D retention and release ratio during H implantation process considering the competitive re-trapping effect. The temperature  = 400 K, binding energy
  = 1.0–1.2 eV, TS site depth
  = 0.5 mm, and H implantation flux
  = 0–1 × 10¹⁹ m−2 s−1.
Download figure:
Standard image High-resolution imageIt can be seen that after D implantation, the total D retention amount is 2.75 × 10¹⁹ D m−2. When the binding energy of TS sites with HIs  = 1.0 eV, the D retention at TS sites remains nearly unchanged without H implantation (
 = 0). However, when the H implantation flux
  = 1 × 10¹⁸ m−2s−1, the D retention decreases by approximately 13% over 10 000 s. If the flux is further increased to 1 × 10¹⁹ m−2 s−1, the D retention decreases by approximately 20%. This indicates that increasing the H implantation flux can effectively reduce D retention. The reduction amount becomes more pronounced with increasing the H implantation flux.
The schematic of competitive re-trapping effect is illustrated in figure 6. Without H implantation, D is simultaneously and equally undergoing trapping and de-trapping in the material, resulting in a local dynamic equilibrium of D trapping and de-trapping at TS sites as depicted in figure 6(a). As a consequence, the total D retention remains nearly constant. Classical macroscopic rate theory indicates that the trapping probabilities of unoccupied TS sites is determined based on the number of different HIs atoms at neighboring LS sites. However, with increasing H implantation flux, as depicted in figure 6(b), H atoms will extensively occupy LS sites. When a small number of D atoms are de-trapped from TS sites and jump into LS sites, the nearby H atoms at LS sites own a higher probability of preferentially occupying TS sites that have been vacated by the de-trapping D atoms. This is entirely a competitive process of HI exchange through re-trapping, resulting in a reduction of the retained D amount. Furthermore, with increasing the H flux, the amount of H atoms at LS sites significantly increases, thus enhancing the probability for TS sites trapping H. This accelerates the competitive re-trapping effect, leading to a faster reduction rate in D retention.
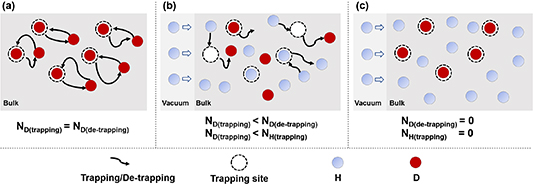
Figure 6. Schematic of the competitive re-trapping effect during hydrogen isotope exchange. (a) The number of D trapped and de-trapped by TS sites is equal; (b) the trapped number of D by TS sites is less than the number of D de-trapped from TS sites, and it is also less than the number of H trapped by TS sits; (c) the number of H and D trapped and de-trapped by TS sites is zero. N represents the number of trapped or de-trapped H/D atoms.
Download figure:
Standard image High-resolution imageTo figure out the influence of binding energy on the competitive re-trapping effect, a comparison was made under the same conditions while the binding energy of TS sites with HIs  = 1.2 eV, as shown in figure 5. The result shows that with the lower binding energy (
 = 1.0 eV), the D retention decreases with increasing the H flux. In contrast, with the higher binding energy (
 = 1.2 eV), the D retention remains unchanged. As depicted in figure 6(c), the energy possessed by D at 400 K can overcome the de-trapping barrier with a binding energy
  = 1.0 eV. However, when the binding energy is increased to 1.2 eV, the energy possessed by D at 400 K is insufficient to overcome this de-trapping barrier. Consequently, D is confined by TS sites at 400 K. There are no vacant TS sites available to be competitive re-trapped by H. Instead, H prefers to diffuse more deeply in the material and be trapped by TS sites at deeper regions.
4.3. Collision effect
When H/D are implanted into W with a certain energy, they still retain relatively high energy within the depth range of particle implantation. If the implanted H/D particles collide with the trapped D/H atoms, there is a certain probability that the trapped D/H would be de-trapped from TS sites. As revealed in section 4.2, at  = 400 K and
  = 1.2 eV, the competitive re-trapping effect does not occur during H implantation. Therefore, in this section, under this specific condition, Model B (including only the collision effect during HI exchange) is ensured not to be influenced by the competitive re-trapping effect, focusing solely on studying the collision effect.
Since the collision effect only occurs within the depth range of HIs implantation, its influence on the overall D retention is approximatively related to the distribution of D retention depth in materials. When the D implantation time is sufficiently short or the concentration of TS sites near the surface is sufficiently high, D is abundant within the implantation depth range. Conversely, the distribution of D retention will extend much deeper than the implantation depth. To better highlight these two cases in Model B, the implantation temperature was set as 400 K, TS site depth  = 40 nm–0.5 mm, binding energy
  = 1.2 eV, collision cross-section
  =1 × 10⁻²¹ cm2, and H implantation flux
  = 0–1 × 10¹⁹ m−2 s−1. D retention and release ratio during and after H implantation process is shown in figure 7.
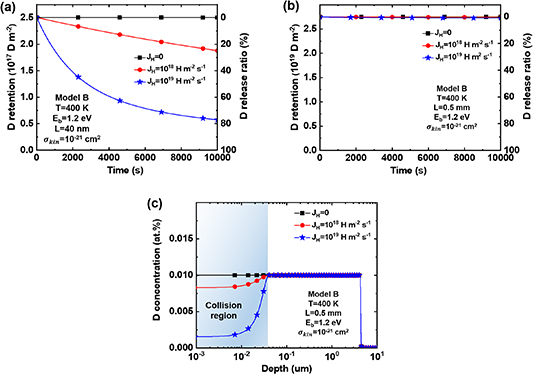
Figure 7. D retention and release ratio during and after H implantation process considering the collision effect. (a) During H implantation, TS site depth  = 40 nm; (b) during H implantation, TS site depth
  = 0.5 mm; (c) depth profile of D trapped by TS sites after H implantation. The temperature
  = 400 K, binding energy
  = 1.2 eV, collision cross-section
  = 1 × 10⁻²¹ cm2, and H implantation flux
  = 0–1 × 10¹⁹ m−2 s−1.
Download figure:
Standard image High-resolution imageWhen implanting D into W with TS sites only existed in the top 40 nm, the total D retention after D implantation is 2.5 × 10¹⁷ D m−2. Subsequently, during the H implantation stage, the total D retention decreases by approximately 25% and 80% at H implantation fluxes of 1 × 10¹⁸ and 1 × 10¹⁹ m−2s−1, respectively, as shown in figure 7(a). It should be noted that the particle implantation depth can reach 40 nm, as shown in figure 3. This indicates that H entered the material can collide with D throughout the D retained depth, causing D to be de-trapped from TS sites. Furthermore, this effect intensifies with the increase of H implantation flux. As defined in the equation (6), with increasing the H implantation flux, the H concentration within the particle implantation region will increase. Consequently, H has a greater probability of undergoing collision effect with D at TS sites, resulting in a significant reduction in the retained D amount.
When implanting D into W with TS sites distributed throughout its entire depth (0.5 mm), the total D retention after D implantation is 2.75 × 10¹⁹ D m−2. However, during the subsequent H implantation process, the total D retention shows no significant change, as shown in figure 7(b). This is mainly because the collision effect only occurs at the surface layer. When TS sites are distributed throughout the entire depth, D can easily occupy TS sites within the surface region during the D implantation stage. At the same time, D can diffuse to the deeper regions, where trapped by deeper TS sites. As shown in figure 7(c), when the D retention depth reaches 5 µm, the reduced D retention in the near-surface 40 nm due to collision effect becomes negligible throughout the entire material.
As expressed in equation (6), the influence of collision effect is closely related to the H/D collision cross-section. However, there is currently limited research available that provides specific values for the H/D collision cross-section in W. Therefore, several values for the average collision cross-section are obtained through simulations for collision effect, as shown in figure 8.
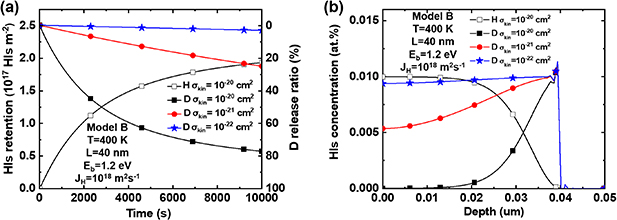
Figure 8. HIs retention with different average collision cross-sections considering the collision effect. (a) HIs retention and D release ratio during H implantation process; (b) depth profile of HIs trapped by TS sites after H implantation. The temperature  = 400 K, binding energy
  = 1.2 eV, collision cross-section
  = 1 × 10⁻²⁰–1 × 10⁻²² cm2, and H implantation flux
  = 1 × 10¹⁸ m−2 s−1.
Download figure:
Standard image High-resolution imageAs illustrated in figure 8(a), when the average collision cross-section is set to  = 1 × 10⁻²⁰ cm2, throughout the entire H implantation process, D release amount remains equal to the retained H. Furthermore, after the H implantation, the depth distribution of D trapped by TS sites is complementary to that of H trapped by TS sites, as depicted in the concentration profiles of figure 8(b). This is because after D is de-trapped from TS sites, the unoccupied TS sites have a higher probability of re-trapping H due to the significant occupancy of neighboring LS sites by H during H implantation process. Ultimately, H will occupy all TS sites after D is de-trapped. As the collision cross-section decreases, after H implantation for 10 000 s, the D release changes to approximately 77%, 25%, and 3% for collision cross-sections of 1 × 10⁻²⁰, 1 × 10⁻²¹, and 1 × 10⁻²² cm2, respectively. This is because as the collision cross-section decreases, the probability of collision event between H and D decreases. Consequently, the D release amount decreases. It can be envisioned that when the collision cross-section is large, H can rapidly collide with all D at TS sites with a low flux or within a short period of time. Conversely, when the collision cross-section is low, it becomes challenging for collision effect to significantly reduce D retention in 10 000 s of H implantation flux
  = 1 × 10¹⁸ m−2 s−1. Therefore, in this study, we will choose the collision cross-section
  = 1 × 10⁻²¹ cm2 for the calculations.
In summary, the collision effect can efficiently remove HIs retained within the particle implantation depth range. According to equation (6), the collision effect is not constrained by temperature and binding energy. This indicates that the collision effect can remove HIs trapped in strong TS at low temperatures.
4.4. Swapping effect
The swapping effect indicates that H/D at LS sites can swap with D/H at TS sites if the swapping activation energy is satisfied. During H implantation, the amount of H atoms at LS sites is much higher than that of D atoms, resulting in a stronger probability of swapping event between H at LS sites and D at TS sites compared to that between D at LS sites and H at TS sites. Therefore, a significant amount of swapping events occurs between H at LS sites and D at TS sites under the influence of the swapping effect, leading to decreasing D retention.
To investigate the influence of different temperatures and numbers of H atoms on the swapping effect, we performed simulations based on Model C (including only the swapping effect during HI exchange). The materials temperature  = 300–400 K, TS depth
  = 0.5 mm, binding energy
  = 1.2 eV, and H implantation flux
  = 1 × 10¹⁸–1 × 10²⁰ m−2 s−1. The variations of D release ratio are shown in figure 9(a). It can be seen that the energy possessed by H and D atoms in the material is insufficient to activate the swapping effect at 300 K. Thus, the amount of retained D remains almost constant with changing the H implantation flux. However, as the temperature increases to 350 and 400 K, the energy of H and D atoms becomes sufficient to activate the swapping effect. Consequently, at 350 K, the amount of retained D decreases by 4.7%, 47%, and 91.7% for
  = 1 × 10¹⁸, 1 × 10¹⁹ and 1 × 10²⁰ m−2 s−1, respectively. When the temperature rises to 400 K, the amount of retained D decreases by 14.5%, 70.5%, and 92.2% for
  = 1 × 10¹⁸, 1 × 10¹⁹ and 1 × 10²⁰ m−2 s−1, respectively. This suggests that the swapping effect between HIs is a thermally activated process, occurring when the activation energy for swapping (
 ) is met, and this effect becomes more pronounced at higher temperatures. Moreover, the swapping effect also becomes more pronounced with increasing the H implantation flux due to the number of H at LS sites increases, thereby enhancing the probability of H at LS sites swapping with D at TS sites.
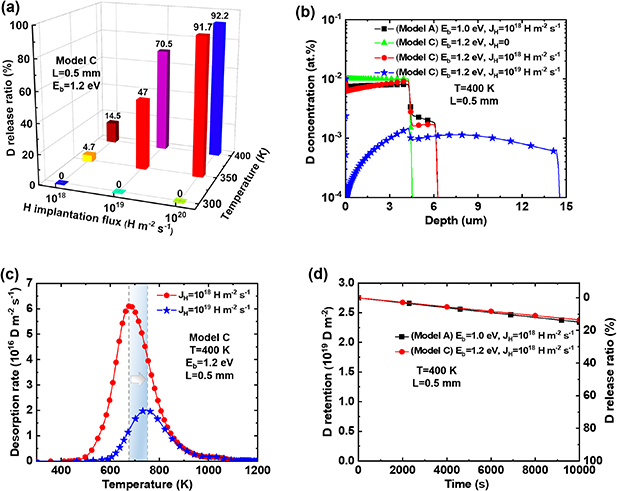
Figure 9. D retention and release ratio considering the swapping effect. (a) D release ratio after H implantation; (b) depth profile of D trapped by TS sites after H implantation; (c) TDS spectra after H implantation; (d) D retention and release ratio during H implantation process. The temperature  = 300–400 K, binding energy
  = 1.0–1.2 eV, TS sites depth
  = 0.5 mm, and H implantation flux
  = 1 × 10¹⁸–1 × 10²⁰ m−2 s−1.
Download figure:
Standard image High-resolution imageFigure 9(b) shows the distribution of D concentration depth before and after H implantation with  = 1 × 10¹⁸–1 × 10¹⁹ m−2s−1 and
  = 1.2 eV at 400 K. It can be observed that with H implantation, the D concentration at TS sites within the top 6 µm decreases, while that within the range of 6–15 µm increases. This is mainly caused by the swapping effect. Some of the D atoms which jump into LS sites diffuse to the implantation surface and are desorbed to the exterior. While another portion of the D atoms diffuses to deeper regions and are re-trapped by deeper TS sites. Due to increasing H implantation flux, the depth-dependent concentration of D at TS sites changes. Consequently, under the same heating rate of thermal desorption spectrometry (TDS), the desorption peak shifts to a higher temperature, as shown in figure 9(c).
Employing Model C and A, we performed calculations with only changing the binding energy  = 1.0 and 1.2 eV. D concentration distribution after H implantation and the amount of retained D during the H implantation are shown in figures 9(b) and (d). It can be seen from figure 9(d) that with the same H implantation flux and fluence, the higher binding energy (
 = 1.2 eV) considering the swapping effect (Model C) can efficiently reduce D retention. This is consistent with the D reduction achieved under the lower binding energy (
 = 1.0 eV) considering the competitive re-trapping effect (Model A). Additionally, the depth distribution of D concentration at TS sites after H implantation in figure 9(b) shows similarities between these two models. This finding suggests that the energy required for the occurrence of the swapping reaction is lower than the de-trapping energy of TS sites.
As discussed in section 4.2, the competitive re-trapping effect manifests as HI exchange behavior in the classical rate model. Its occurrence depends on whether the HIs obtains enough energy for de-trapping. However, at 400 K, when the binding energy is 1.2 eV, the energy obtained by D at TS sites is insufficient for de-trapping. Therefore, it is necessary to reduce the binding energy, e.g. 1.0 eV, to achieve a decrease in D retention. Unlike the classical rate model, the swapping effect represents the position exchange between different HIs atoms. This exchange only requires the HIs obtaining enough energy to meet the activation energy for swapping. Low-temperature experiments have demonstrated that using HI exchange methods can remove approximately 60% of the retained D at 320 K [23], whereas conventional thermal desorption almost cannot remove D at this temperature. Although at 400 K, when the binding energy is1.2 eV, the energy obtained by D at TS sites is insufficient for de-trapping, but it satisfies the swapping activation energy. Thus, the swapping effect can numerically align with the effect of reducing the binding energy between HIs and TS sites of the competitive re-trapping effect.
5. Discussion
HI exchange is an effective method for T removal in fusion materials. In above study, we have established the HIDTX model and simulated H and D exchange behavior, involving the sequential D and H implantation into W. At the subsequent H implantation stage, HI exchange can effectively reduce D retention. In this section, effects of different exchange mechanisms are summarized. The HIs exchange mechanism was further discussed from the view of micro-scale by DFT and MD calculations. Finally, the combination of thermal desorption and HI exchange for tritium removal was evaluated based on the HIDTX model.
5.1. Synergistic effects of HI exchange
There are three synergistic effects affecting the D reduction during the HI exchange process: competitive re-trapping, collision, and swapping effects. Their specific impacts are as follows:
- Competitive re-trapping effect: When D has enough energy to be de-trapped from TS sites, the implanted H will occupy the D-occupied TS sites, thereby preventing D re-trapping by TS sites. The competitive re-trapping effect can occur throughout the material, effectively reducing D retention.
- Collision effect: In the implantation region, the implanted H has a probability of colliding with D which is trapped by TS sites and causing D to be de-trapped from TS sites. The collision effect can only occur near the material surface, effectively reducing D retention in the implantation layer.
- Swapping effect: When the activation energy for swapping is satisfied, H at LS sites can undergo a swapping with D at TS sites, resulting in H entering TS sites and D entering LS sites. This process effectively reduces D retention throughout the material.
The influence of each effect on D removal under different conditions is summarized in table 3. The competitive re-trapping effect is an expression for HI exchange in the traditional rate model. The collision effect only acts within the particle implantation depth. Therefore, the added swapping effect in the HIDTX model best represents the difference in HI exchange from the traditional rate theory. However, the micro-mechanism of the swapping effect is still unclear. More in-depth research on the micro-mechanisms of HI exchange should be conducted to understand the micro-level aspects of the swapping effect.
Table 3. D removal and exchange ratio by H under different effects and conditions.
| Effect | Depth of TS sites distribution, L | Binding energy of TS sites with HIs,  (eV) (eV) | Temperature, T (K) | H implantation flux,  (m2 s−1)
| D release ratio during H implantation (%) | Time for releasing x% retained D (×104 s) | ||||
|---|---|---|---|---|---|---|---|---|---|---|
| After 100 s | After 1000 s | After 10 000 s | x% = 40% | x% = 60% | x% = 80% | |||||
| Competitive re-trapping effect | 0.5 mm | 1 | 400 | 1 × 10¹⁸ | 0.13 | 1.3 | 13.4 | 3.59 | 7.13 | 18.4 |
| 1 × 10¹⁹ | 0.14 | 1.7 | 19.6 | 2.26 | 4.09 | 7.72 | ||||
| 1.2 | 1 × 10¹⁸ | 0 | 0 | 0 | / | / | / | |||
| 1 × 10¹⁹ | 0 | 0 | 0 | / | / | / | ||||
| Collision effect | 40 nm | 1.2 | 400 | 1 × 10¹⁸ | 0.3 | 3 | 24.3 | 1.99 | 4.12 | 12.14 |
| 1 × 10¹⁹ | 3.2 | 24.3 | 77.3 | 0.2 | 0.41 | 1.23 | ||||
| 0.5 mm | 1 × 10¹⁸ | 0 | 0 | 0 | / | / | / | |||
| 1 × 10¹⁹ | 0 | 0 | 0 | / | / | / | ||||
| Swapping effect | 0.5 mm | 1.2 | 300 | 1 × 10¹⁸ | 0 | 0 | 0 | / | / | / |
| 1 × 10¹⁹ | 0 | 0 | 0 | / | / | / | ||||
| 1 × 10²⁰ | 0 | 0 | 0 | / | / | / | ||||
| 350 | 1 × 10¹⁸ | 0.03 | 0.42 | 4.7 | 8.05 | 14.6 | 30.6 | |||
| 1 × 10¹⁹ | 0.43 | 4.9 | 47 | 0.81 | 1.47 | 3.07 | ||||
| 1 × 10²⁰ | 4.94 | 47.2 | 91.7 | 0.08 | 0.15 | 0.31 | ||||
| 400 | 1 × 10¹⁸ | 0.14 | 1.48 | 14.5 | 3.2 | 6.4 | 17.9 | |||
| 1 × 10¹⁹ | 1.4 | 14.7 | 70.5 | 0.32 | 0.65 | 1.8 | ||||
| 1 × 10²⁰ | 14.8 | 70.6 | 92.2 | 0.03 | 0.07 | 0.18 | ||||
5.2. MD simulation for HI exchange
In order to provide detailed insights into the potential mechanisms of the isotopic exchange process, MD simulations were carried out using the Large-scale Atomic/Molecular Massively Parallel Simulator (LAMMPS) code [59]. We employed the embedded atom method (EAM) potential known as 'EAM1' [60] for the W–H–He system. A simulation box with dimensions of 10a × 10a × 10, containing 2000 W atoms was employed. The number of H atoms in a W mono-vacancy at room temperature has been confirmed to be six [33]. To generate the mono-vacancy system, we removed the atom closest to the center and introduced 6D atoms inside the created vacancy to fully saturate it. Additionally, nH atoms were randomly distributed in the tetrahedral interstitial sites around the lattice. The H/D atoms are determined by setting different molar masses of HIs atoms. After initialization, the system was relaxed using the built-in conjugate gradient energy minimization function in LAMMPS. Following the relaxation process, the actual simulation was performed using the Berendsen temperature control method with a time step of 5 fs, and the total simulation time was 40 ns. Finally, the exchange rate of D was determined by studying the number of HIs associated with the mono vacancy. For simplicity, an atom is considered to be trapped by the vacancy if it retained within a cubic region with a side length of 4 Å near the vacancy [39].
As shown in figure 10(a), if there are no H atoms around the vacancy, the number of D atoms in the vacancy decreases from 6 to 4 within 40 ns. However, if there are H atoms around the vacancy, within the same 40 ns, the number of D atoms could decrease to 0. This indicates that if H atoms are present in the tetrahedral interstitial sites, the process of trapped D atoms jumping into tetrahedral interstitial sites will involve not only the de-trapping but also a swapping effect similar to the one mentioned in section 4.4. To confirm our hypothesis, further investigations at the microscopic scale, considering different temperatures and numbers of H atoms, are carried out, as shown in figures 10(b)–(d).
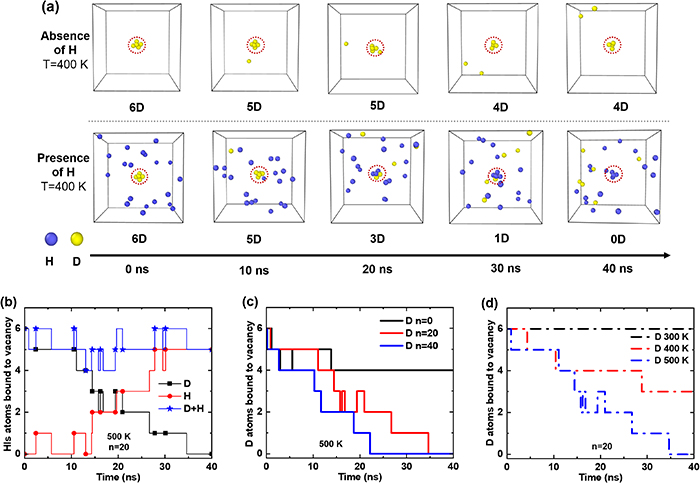
Figure 10. Influence of the surrounding H atoms on the number of D atoms in a mono vacancy. (a) Evolutions of absence and presence of H atoms; (b) at 500 K with 20 surrounding H atoms; (c) at 500 K with 0–40 surrounding H atoms; (d) at 300, 400 and 500 K with 20 surrounding H atoms.
Download figure:
Standard image High-resolution imageAt 500 K and with 20 H atoms (n = 20), the variations of H, D, and total HIs numbers in the vacancy over time were recorded in figure 10(b). The results demonstrate that the number of D atoms de-trapped from the vacancy is consistently similar to the number of H atoms entering the vacancy. While, the total number of HIs in the vacancy remains constant at either 5 or 6 atoms. This suggests HI exchange actually involves the positional exchange of HIs atoms with each other, which corresponds to the introduced swapping effect in the HIDTX model.
The impact of different H concentrations (n = 0–40) nearby is shown in figure 10(c). It can be seen that in the absence of HI exchange (n = 0), the number of D atoms trapped by the vacancy gradually decreases to 4 atoms in the first 15 ns, and then remains constant at 4 atoms. However, when more H atoms are placed surrounding the vacancy (n = 20–40), the number of D atoms in the vacancy gradually decreases at 3–12 ns and continues to decrease over the subsequent time. This indicates that if H atoms are present in the tetrahedral interstitial sites surrounding the vacancy, the D atoms in the vacancy undergo HI exchange with the H atoms at these tetrahedral interstitial positions, leading to D releasing from the vacancy. This mechanism will be further discussed in the following section 5.3. Moreover, this swapping effect intensifies with an increase in the concentration of the other HIs species. It implies that with increasing the number of H atoms, H is more likely to undergo swapping with D atoms in the vacancy, thus enhancing the release rate of D atoms.
At a fixed number of H atoms (n = 20), the impact of different temperatures was investigated, as shown in figure 10(d). It is found D atoms hardly undergo any de-trapping at 300 K, whereas with increasing the temperature, the release rate of D atoms gradually increases. This indicates the swapping effect between HIs is a thermally activated process. It only occurs when the activation energy for swapping is satisfied, and this effect becomes more obvious with increasing the temperature. All these MD simulations results essentially reproduce the macroscopic findings on the impact of the swapping effect, as discussed in section 4.4, thereby validating the feasibility of the HIDTX model.
5.3. Microscopic mechanism of HI exchange
The mechanism by which D atoms are desorbed from the vacancy due to the presence of H atoms in the tetrahedral sites still requires further research. Here, first-principles calculations of H interactions in W were performed using the VASP code [61]. The binding and desorption energies of H to a mono vacancy rely on the presence of H atoms at the neighboring tetrahedral sites. These energies require computationally intensive methods such as nudged elastic band (NEB) to be accurately determined [62–64]. To facilitate these calculations, we employed a 54–1 W atom model to represent the vacancy. Plane-wave cutoff energy was 350 eV and a 3 × 3 × 3 k-point grid sampling was used by the Monkhorst–Pack scheme [65, 66]. Convergence was ensured by setting a force criterion of approximately 0.01 eV Å−1. For W.
The transition state barriers for H moving from the vacancy site (i) to the neighboring tetrahedral sites (ii) and (iii) were calculated, as shown in figure 11(a). The binding and de-trapping energies of the vacancy with H for different models were obtained, as shown in figure 11(b). ① and ② presents the cases where H transitions from the vacancy to the neighboring tetrahedral sites (ii) and (iii) without and with an adjacent H atom present (red H atom in (ii), labeled as ②).
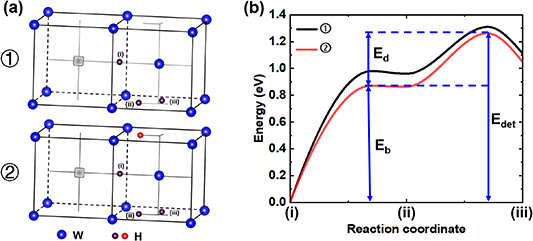
Figure 11. Transition state barriers with the presence of H atoms at tetrahedral interstitial sites around a vacancy. (a) Diffusion pathway of H from the vacancy to the tetrahedral site; (b) transition state barriers obtained from the NEB calculations.
Download figure:
Standard image High-resolution imageThe binding energy ( ) and de-trapping energy (
 ) are defined in figure 11(b), where
  . It can be found that if there are no H atoms present in the tetrahedral site surrounding the H-occupied vacancy,
  is 0.99 eV, and
  is 1.31 eV, consistent with the results calculated by Fernandez et al [33]. If there is an H atom present in the tetrahedral site surrounding the H-occupied vacancy,
  is 0.89 eV, and
  is 1.25 eV. This indicates that the presence of an H atom in the tetrahedral site surrounding the vacancy reduces the binding energy between the vacancy and H, consequently decreasing the de-trapping energy.
From the above analysis, it is concluded that the micro-mechanism of HI exchange can be divided into two steps, as depicted in figure 12. At the first step, when H atoms are implanted into the D-retained material, they initially occupy the solute LS sites around the D-occupied TS sites. At this stage, the de-trapping energy of TS sites will decrease. D atoms have opportunities to be de-trapped from TS sites and move to LS sites. Subsequently, following the competitive re-trapping effect in isotope exchange, due to the higher concentration of H at LS sites, the vacant TS sites own a greater probability to trap H again. As a result, D atoms are de-trapped from TS sites and then move to LS sites, while H atoms at LS sites are trapped by TS sites. This reverse direction of microscopic H and D swapping processes is consistent with the mechanism of the above introduced swapping effect in the HIDTX model. When H atoms are present in the tetrahedral interstitial positions surrounding the vacancy, the binding energy between the vacancy and H will be reduced, thereby decreasing the de-trapping energy of H from the vacancy. This validates the finding obtained in section 4.4, i.e. the swapping effect numerically agrees with the competitive re-trapping effect obtained by decreasing the binding energy between H and TS sites.

Figure 12. Microscopic schematic of hydrogen isotope exchange.
Download figure:
Standard image High-resolution imageIn this study, choosing 0.7 eV as the swapping activation energy instead of subtracting the reduced activation energy (0.1 eV) from the binding energy (1.0–1.2 eV) to obtain 1.1 eV or 0.9 eV is based on the following reasons: (1) hydrogen isotope exchange is an effective method for D removal at low temperatures. If the swapping activation energy is too high, it may hinder the exchange process at low temperatures. (2) The conditions required for swapping are more stringent compared to de-trapping. It not only needs to satisfy the swapping activation energy but also requires the presence of another type of HIs in the vicinity of the HIs in the TS being exchanged. Therefore, the value of the swapping activation energy should not be a simple deduction from the binding energy minus the reduced activation energy. It needs additional reduction based on this value.
5.4. Combination of thermal desorption and HI exchange
With comprehensive investigations of HI exchange mechanisms, the potential influence of HI exchange on T removal in PFMs is worth further discussing. Currently, the commonly used method for removing retained T is thermal desorption, or called as baking [13–15]. In order to reduce the thermal load and stresses on internal components, thermal desorption must be controlled at a lower temperature. However, PFMs accumulate significant irradiation damages by 14.1 MeV high-energy neutrons. Most of these damages are strong TS, which can only be effectively removed through high-temperature baking (∼900 °C). Such high temperatures are quite risky for the fusion reactors. In our previous experimental study [30], it is found that HI exchange could decrease the temperature of T desorption in C–W mixed materials. It means the combination of thermal desorption and HI exchange can achieve a synergistic enhancement in T removal efficiency.
To investigate the combination effect of thermal desorption and HI exchange on the D retention, based on Model D (involving collision and swapping effects during HI exchange) shown in table 2, sequential D and H implantation were performed at the temperature  = 400–600 K, TS sites depth
  = 0.5 mm, binding energy
  = 1.2 eV, collision cross-section
  = 1 × 10⁻²⁰–1 × 10⁻²² cm2, and H implantation flux
  = 0–1 × 10¹⁹ m−2 s−1. The case with
  = 0 can be considered as only thermal desorption. The changes in D retention are shown in figure 13.
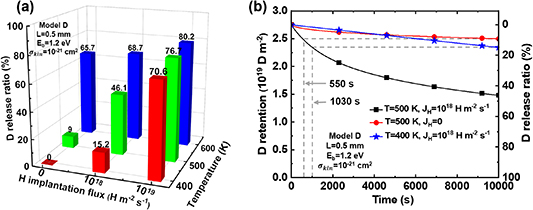
Figure 13. D retention and release ratio considering the combination of thermal desorption and hydrogen isotope exchange. (a) D release ratio after H implantation; (b) D retention and release ratio during H implantation process. The temperature  = 400–600 K, binding energy
  = 1.0–1.2 eV, TS sites depth
  = 0.5 mm, collision cross-section
  = 1 × 10⁻²¹ cm2, and H implantation flux
  = 0–1 × 10¹⁹ m−2 s−1.
Download figure:
Standard image High-resolution image
It can be seen that the HIs removal efficiency by thermal desorption depends strictly on the temperature. If the temperature is too low, D atoms trapped at TS sites do not obtain sufficient energy to overcome the de-trapping barrier. Therefore, at 400 K, thermal desorption has little effect on reducing D retention. As the temperature increases to 500 K, thermal desorption can remove 9% of the D retention, as shown in figure 13(a). This is mainly because the D atoms trapped at TS sites gradually gain enough energy to break through the de-trapping barrier and enter LS sites, from where they diffuse to the surface and release. Further increasing the temperature to 600 K allows thermal desorption to remove 68.7% of D retention. This is because, at 600 K, the D atoms trapped at TS sites have significantly higher energy than needed for de-trapping, and they will de-trap from TS sites at a faster rate.
As described above, thermal desorption has no significant impact on D retention at 400 K. Therefore, HI exchange at this temperature can rule out the effect of the thermal desorption. It can be observed that, unlike thermal desorption at 400 K, HI exchange can still achieve non-negligible D removal. This is because both the collision and swapping effects on HI exchange still occur at 400 K. What's more, their effects become more pronounced with increasing the H implantation flux. For example, at an  = 1 × 10¹⁸ m−2s−1, the D retention decreases by 15.2%. When it increases to 1019 m−2s−1, the D retention decreases by as much as 70.6%. This removal efficiency is higher than that achieved by thermal desorption at 600 K.
At 500 and 600 K, thermal desorption can be effective in decreasing D retention. Therefore, HI exchange at 500 and 600 K can be considered as a combination of thermal desorption and HI exchange. As described in sections 4.2 and 4.4, when the temperature increases, the competitive re-trapping and swapping effects on isotope exchange are enhanced. This implies that simultaneous thermal desorption and HI exchange can synergistically strengthen T removal. For example, at 600 K and  = 1 × 10¹⁸ and 1 × 10¹⁹ m−2 s−1, the combination method increases the removal ratio by 53.5% and 9.6% compared to that by only HI exchange (at 400 K). When
  = 1019 m−2 s−1, the temperatures are 500 and 600 K, and the removal ratio is increased by 67.7% and 14.5% as shown in figure 13(a). Furthermore, from the variation of total D retention and release ratio in figure 13(b), it is evident that the combination method can lead to a reduction of D removal time by approximately 95% compared to that by only thermal desorption.
It should be pointed out that when HI exchange is combined with thermal desorption, to enhance T removal efficiency in PFMs, efforts need not be limited to increasing the T removal temperature. Instead, increasing the implantation flux of another HIs species can also be considered. This provides great convenience for the T removal.
6. Conclusion
HI exchange is an effective method for T removal in fusion reactor materials. This study employed a multi-scale approach to investigate the HI exchange mechanism. The HI exchange model has been successfully developed to confirm its significant capability in mitigating T retention. The main conclusions are summarized below.
- (1)Built upon the classical macroscopic rate model and integrating microscopic HI exchange mechanism, a multi-component HIDTX was developed. This model enables the simulation of migration and exchange behaviors among various HIs species. The simulation results were compared and validated against experiments, demonstrating the reliability of the HIDTX model.
- (2)Reduction of D retention by HI exchange can be explained by three synergetic effects: competitive re-trapping, collision, and swapping effects. Among them, the collision effect can efficiently reduce the D retention within the particle implantation depth. The competitive re-trapping and swapping effects can effectively reduce the D retention within the entire material. Moreover, all these three effects magnify as the H particle implantation flux increases.
- (3)Through microscopic simulations, it is observed that the presence of H atoms in the tetrahedral interstitial sites around vacancies leads to a reduction of 0.1 eV in the binding energy between the vacancy and H. This reduction results in a decrease of 0.06 eV in the de-trapping energy for H within the vacancy, ultimately, making it easier for D to be de-trapped from TS sites.
- (4)The combination method of thermal desorption and HI exchange can significantly decrease the temperature required for the removal of HIs and enhance the removal rate. Particularly, at 400 K, the combination method can decrease D retention with a ratio of 67.7% compared to that by only thermal desorption. At 500 K, the D removal time can be shortened by approximately 95% compared to that by only thermal desorption.
This work provides a multi-scale explanation of HI exchange behavior and can support the T removal design in future fusion reactor materials. However, it should be noted that using isotope exchange in ITER for T removal may lead to T diffusing to deeper layers and being trapped by strong TS. These aspects might become crucial points for our further research.
Acknowledgments
This work is supported by the National MCF Energy R&D Program (No. 2022YFE03200400), National Natural Science Foundation of China (Nos. 12105069, 12305192, 12222510), and JSPS Kakenhi 20H01885, Japan. The computation is completed on the HPC Platform of Hefei University of Technology.
Conflict of interest
The authors declare no conflict of interest.
Appendix: Supplementary tables
Table S1. Glossary of coefficients used in the HIDTX model.
| Symbol | Parameter |
|---|---|

| Diffusion coefficient of HIs in materials |

| Concentration of HIs at LS |

| Concentration of HIs at TS |

| External source of HIs |

| Pre-exponential factor of diffusion coefficient |

| Diffusion activation energy |

| Boltzmann constant |

| Temperature |

| Diffusion coefficient of H |

| Mass of HIs |

| Mass of H |

| Jumping frequency |

| Total concentrations of TS |

| Total concentrations of LS |

| Binding energy of HIs with TS sites |

| Reflection coefficient |

| Implantation flux of HIs |

| Depth distribution of the implanted HIs particles |
| i, j | HIs species, i.e., H, D, and T |

| Collision effect |

| Swapping effect |

| Depth at a specific point in HIs implantation range |

| Maximum depth of HIs implantation |

| Average collision cross-section |

| Oscillation frequency of HIs moving between TS and LS sites |

| Probability of neighboring sites being occupied by HIs-j at LS site |

| Probability of the neighboring sites being occupied by HIs-i at LS sites |

| Swapping activation energy |

| De-trapping energy |
Supplementary data (0.1 MB PDF)