


Abstract
The type of edge turbulence transition from resistive ballooning modes (RBM) to drift-type ion temperature gradient (ITG) modes has been observed in the gas puffing modulation experiments and also simulations at the HL-2A tokamak. The experimental evidence on RMB and ITG characteristics is given by Langmuir probe and Doppler reflectometry data. In the low temperature region (Te < 80 eV), the variation of turbulence intensity is in phase with that of the parallel resistivity, consistent with RBM features. However, in the high temperature region (Te > 80 eV), the turbulence intensity is enhanced with increasing temperature and reduction of the parallel resistivity, implying a drive by drift wave type ITG modes. By numerical simulations with drift resistive inertial ballooning model, the dependence of the growth rate on the electron temperature for the most unstable mode has been investigated based on experimental parameters. Both experiments and simulations have suggested that the dominating instability transits from RBMs in the low Te regime to ITG modes in the high Te regime.
Export citation and abstract BibTeX RIS
1. Introduction
Characterizing the nature of micro-instabilities is crucially important for understanding the underlying physics of turbulent transport in magnetically confined plasmas. The quantitative prediction of turbulent transport level still remains the most challenging problems in plasma theory and the design of future fusion devices, especially in the plasma edge [1]. Theories and experiments both indicate that the drift-wave turbulence in tokamak plasmas is a highly complex nonlinear system involving multi-scale instability modes, such as large-scale ion temperature gradient (ITG) mode [2, 3], short-wavelength electron temperature gradient (ETG) mode [4] and meso-scale trapped electron modes (TEM) [5], which are responsible for ion heat transport, electron heat transport and electron particle/heat transport, respectively [6]. While temperature gradient driven modes are primary candidates in explaining the anomalous transport in the plasma core [7, 8], resistive modes drive the turbulence in the more collisional and steeper gradient edge [9]. In general, the edge fluctuations make a transition from resistive pressure gradient driven instabilities to [10–12] temperature gradient driven turbulence when moving from the scrape-off layer towards the core.
A type of magnetic-hydro-dynamic (MHD) instabilities referred as the resistive ballooning mode (RBM) [13–17] has been known to play a significant role in driving turbulence near the plasma edge, for which the collisional resistivity and current diffusion are important. Recent study shows that the experimentally measured electron heat diffusivity is in agreement with Carreras–Diamond predictions [18], in which the RBM plays a key role in edge transport. It has been accepted that the edge instabilities have considerable importance on L–H transition. RBMs have been studied for a long time [19–21] and found to qualitatively agree with experiments. The earlier work suggested that RBMs are responsible for the electron diffusivity and density limit [20]. According to the theory, the growth rate spectrum of the RBM and ITG have opposite dependence on the electron temperature (Te), with the former peaks moving from low to intermediate wavenumber range as Te increases, while the ITG spectrum is nearly independent of Te and peaked in the intermediate wavenumber, which indicates a possibility of the transition from RBM to ITG mode as Te increases. Recent fluid and kinetic simulation studies have found the linear stability changes from the RBM to ITG dominated one when the temperature gradient increases [21, 22]. Gyrokinetic simulations using DIII-D and Tore Supra L mode edges parameters [23], as well as the onset of H mode for JET-ILW have shown that the RBMs are linearly unstable [24]. The RBMs can grow in the edge region of tokamak due to the relatively low electron temperature, hence high electron resistivity, and moderately high plasma density, which is considered to be a quite robust instability for typical edge plasma with relatively high collision rate.
In the tokamak edge region, the ITG mode is sensitive to the ratio of the ion temperature scale length LTi to the density scale length Ln though the parameter ηi = Ln/LTi. The ITG mode becomes a strong drive of turbulence with increasing ηi. Besides, the resistive ballooning turbulence greatly exceeds the drift-wave turbulence in the low temperatures and with increasing temperature the RBM is completely stabilized by diamagnetic effects [25]. Recent simulations have suggested the edge turbulence transition from RBM to ITG mode as the electron temperature exceeds a critical value [21, 22, 26]. On the experimental side, the L–H transition was found to qualitatively agree with the RBM model [20] of in Alcator C-Mod [27]. Experiments have found a different transport response between the edge region and the core in TCV L mode plasmas [28]. Although most of the recent studies have shown a reasonable agreement between experimental investigations and fluid or gyrokinetic simulations, there is still a lack of direct experimental evidence on the turbulence type transition from RBM to ITG with the increasing electron temperature, which is the goal of the present paper. On the other hand, theory and simulation have suggested that GAM can be driven by ITG turbulence. The GAM is the high frequency branch of zonal flow which can be driven by drift wave turbulence and in turn suppress the turbulence by tearing the large turbulence eddies apart hence reducing the radial transport, which is important for L–H transition [29].
In this paper, we first report the experimental observation of the unstable modes transiting from the RBMs to ITG modes with increasing electron temperature in the HL-2A edge plasma during gas puffing modulation experiments. The parametric dependences show a reasonable agreement with theoretical predictions. The experimental results agree well with drift-resistive-ballooning mode simulations. The reset of the paper is organized as follows. The experimental setup is presented in section 2. The comparison between experimental results and simulation is demonstrated in section 3. Finally, the conclusions are drawn in section 4.
2. Experimental setup
The experimental investigation on the relation between the turbulence type and electron temperature have been carried out on the HL-2A tokamak by gas-puffing modulation experiments [30] in ohmiclly heated deuterium plasmas with following parameters R = 1.65 m, a = 0.4 m, Bt = 1.1–1.3 T, Ip = 160–170 kA, the line-averaged density nel = (0.5–1.5) × 1019 m−3. Langmuir probe array with a diameter of 2.5 mm, length of 2 mm, adjacent separation of 3 mm, sampling rate of 1 MHz is used to study the GAMs activity [31], limit cycle oscillation [32] and L–I–H trigger mechanism [33] using the local electron temperature, density and floating potentials. A five-tip probe array was installed on a reciprocating manipulator with a scanning speed of 1.0 m s−1. The turbulence decorrelation time τd is deduced from electron density fluctuation ñe. Typically, the probe array is localized at Δr = −20–30 mm, where Δr is radial displacement of a tip away from the last closed flux surface (LCFS), with Δr < 0 donating inside the LCFS. In the inner region, a Doppler reflectometry is employed to measure the density fluctuations localized 45 mm inside the LCFS and an ECE diagnostic to detect the local Te, from which the characteristics of zonal flows has been reported [34].
3. Experiments results
3.1. Local electron temperature modulation with multiple gas-puffing
In the HL-2A tokamak discharges with multiple gas puffing, the edge density and temperature are modulated. Scanning the electron temperature of a plasma with central line averaged density of  = (0.5–1.5) × 1019 m−3, Ip ≈ 170 kA and gas puffing duration time of 7 ms. The typical evolution of the discharge waveform of gas-puffing modulation experiments is shown in figure 1. The curves shown from top to bottom are the plasma current (Ip), line-averaged electron density (
 ) and multiple gas-puffing signal. In the edge region, the probe array measures the electron density, temperature, floating potential at different radial position for the entire time range.
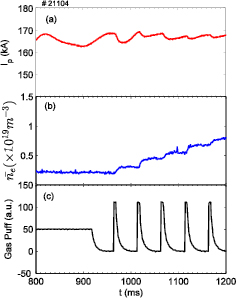
Figure 1. Typical temporal evolution of gas puffing modulation experiments: (a) plasma current Ip, (b) line-averaged electron density  , and (c) multiple gas puff signal.
Download figure:
Standard image High-resolution image3.2. Dependence of turbulence decorrelation time on the electron temperature
The dependence of turbulence decorrelation time τd is explored during the gas puffing which is defined as the e-folding time of the turbulence auto-correlation function (ACF)  , i.e. the width of the ACF is taken to be the decorrelation time of the local turbulence. According to the theory [35], the nonlinear turbulent energy transfer is proportional to density fluctuation amplitude and turbulent decorrelation time. In general, the turbulence evolution includes two terms: linear driving and nonlinear saturation which is given by
  , where γL is the linear growth rate of the dominating instability and αNL is the nonlinear coupling coefficient which has a less variation. Employing the turbulence decorrelation time τd,
  , we can obtain the linear growth rate
  . Hence the variation of turbulence decorrelation time represents that of the linear growth rate directly. E.g. the linear growth γL increases with increasing turbulence decorrelation time τd.
Figure 2 summarizes the experimental waveforms measured by probe at a fixed radial position Δr = −30 mm. Each puffing induces a quick increase in ne and a reduction in Te. After the gas puff, both ne and Te recover gradually, as shown in figures 2(a) and (b). Figure 2(c) plots the time evolution of the electron density fluctuation ñe, from which the τd is calculated, as illustrated in figure 2(d). The electron density gradually increases after each gas puffing, which is thought to be responsible for the increasing of fluctuation level. It is shown that τd decreases with the increasing temperature both during and after the gas puffing. Statistical analysis clearly shows the decrease of τd with increasing Te. At higher temperature, the dependence of τd on Te is derived from the reflectometry and ECE data. The results are plotted in figure 3(a) for both the probe and reflectometry data, where the measuring positions of probe and reflectometry are 3 cm and 4.5 cm inside the LCFS, respectively. If the Te < 80 eV, both probe and reflectometry measurements indicate that the increase of Te cause a reduction of resistivity, hence a decrease of τd. The modes are stabilized and are speculated as being RBMs, as marked by the red arrow. At higher range of Te > 80 eV, reflectometry data shows that the modes are destabilized as the Te increases and the collisionality is reduced, together with the increase of τd, which is consistent with ITG turbulence. The dependence of electron density fluctuation level  and the parallel resistivity
  on Te is shown in figure 3(b). As
  scales as
  ,
,  decreases with Te. However, while the
  decreases in the range of Te < 80 eV, it increases with larger Te, suggesting a different type of turbulence in the low and high Te range. According the theory, the growth rates and
  of RBM and ITG have opposite dependence on Te, resulting a minimum level at a typical electron temperature. Thus it is concluded that the turbulence is driven by RBM in the range of Te < 80 eV, and ITG in the higher Te range.

Figure 2. Temporal evolutions of (a) gas puff signal (b) density (blue line) and temperature (red line) (c) electron density fluctuation and (d) turbulence decorrelation time τd, respectively.
Download figure:
Standard image High-resolution image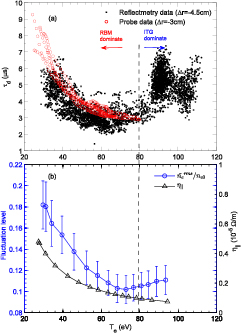
Figure 3. Dependence of (a) τd, black dots and red circles are τd measured by reflectometry and probe, respectively, (b) electron density, temperature fluctuation level and parallel resistivity, shown by blue circle and black triangle, respectively on the electron temperature.
Download figure:
Standard image High-resolution imageThe electron temperature profiles from ECE also demonstrate that in the RBM regime, the edge temperature is lower than that of the ITG regime, but inversed in the core plasma, as shown in figure 4. As the system is self-organized and transits into a new regime with steeper Te profile, following the increase of Te gradient at the plasma periphery induced by the gas puffing. The nonlocal transport may account for the rise of Te in the core and drop of Te at the edge, as previously studied by supersonic molecular beam injection [36]. Due to the lack of ion temperature (Ti) measurement, we have assumed that Ti = Te. Although experiments have shown that Ti > Te in the scrape-off layer, the ratio of Ti to Te is close to unity in the edge plasma [37], thus it is reasonable to be supposed that Ti is roughly equivalent to Te in the region of interest.
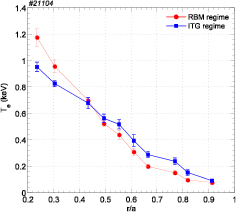
Figure 4. Electron temperature profiles at the time slices of RBM and ITG regimes, shown by red solid circles and blue squares, respectively.
Download figure:
Standard image High-resolution image3.3. Frequency spectrum of RBM and ITG regimes
In this study, we have attempted to analyze the spectrum characteristics of turbulence during the low and high temperature phases using the fluctuation data measured by Doppler reflectometry and Langmuir probes. Although in the frequency spectrum a Doppler shift appears in the electron and ion diamagnetic drift direction, respectively, at the low and high Te stage, it is difficult to distinguish whether such a frequency shift is induced by the mean E × B flow or the phase velocity of the turbulence mode in the plasma frame since the experimental measurement executed in the laboratory frame includes both components. Therefore, we cannot draw conclusion on the turbulence propagation direction with respect to the RBMs/ITG modes. To further investigate turbulence features in the RBM and ITG regimes, we have calculated the frequency spectrum of perpendicular velocity fluctuations ( ) detected by the Doppler reflectometry during the low and high temperature phases. The perpendicular velocity is proportional to the Doppler frequency shift, i.e.
  , where S(f, t) and fD(t) are the fluctuation power and the power-weighted frequency shift at time t, respectively. Figure 5 shows the frequency spectrum of
  in the low (red) and high (blue) Te phases. In case of low Te the power spectrum changes smoothly whereas in the high Te regime a clear peak is observed at the frequency ~14.5 kHz. It is verified that this peak at the high temperature stage is the GAM zonal flow, which has been widely studied at the HL-2A tokamak by both probes and reflectometry [31, 34]. For the ITG regime, theory and simulation have pointed out that the GAM zonal flow can be driven by ITG turbulence and in turn regulating the latter, for which the coherent excitation of GAMs can be realized by nonlinear coupling between the ITG pump wave and the side band [38, 39]. An increase in temperature gradient would therefore enhance ITG turbulence and GAM zonal flows. This description is consistent with our experimental observations. For the RBM regime, the absence of GAMs might be linked to the strong damping of flows in the low Te (high ne) scenarios, suggesting the possible role of collisionality on zonal flows [40].

Figure 5. Frequency spectrum of perpendicular velocity fluctuations measured by Doppler reflectometry. Red and blue curves denote RBM and ITG regimes, respectively.
Download figure:
Standard image High-resolution imageShown in figure 6 is the time evolution of the floating potential frequency spectrum measured by Langnuir probes along with the density and temperature fluctuation amplitudes across the RBM and ITG stages. In the RBM dominated regime within low temperature range, the GAM amplitude is very small, as shown between black and red dashed lines. The frequency spectrum appears to broaden at Te ≈ 40–60 eV and is saturated in the ITG dominant phase when Te > 80 eV. The origin of the spectrum broadening is not clear at present and will be further surveyed in the future. In the high Te range, the turbulence type has been translated into ITG turbulence with a broad band spectrum together with the GAM enhancement, as shown between blue and black dashed lines in figure 6(b). The temperature fluctuation level  is higher than density fluctuation level
  in the RBM regime, but inversed in the ITG regime. Besides, the temperature fluctuation level itself is decreased in the ITG regime (see figure 6(c)), implying an enhancement of heat confinement in the high Te ITG regime than the low Te RBM regime, which is consistent with theory predictions [26].
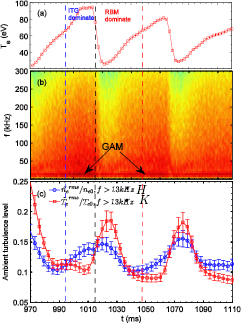
Figure 6. Temporal evolutions of (a) electron temperature Te, (b) frequency spectrum of floating potential and (c) ambient turbulence level  and
and  , respectively.
Download figure:
Standard image High-resolution imageSince resistive ballooning mode and ITG mode turbulence can exit simultaneously, the transport is not dominated by the mode with largest growth rate. According to [21], the transverse scale length  and
and  are important for RBM and ITG mode, with the reasonable hypothesis that in the case of RBM, transport is dominated by the longest wavelength modes, which results the condition for transport by ITG driven turbulence dominate that due to RBM expressed as
  , where
  ,
,  ,
,  ,
,  ,
,  the safety factor at normalized radius ρ = 0.95, R the major radius, Lp and Ln the pressure and density scale length, respectively. The notation νei donates the electron–ion collision rate, Cs the sound speed, Te0 and Ti0 the equilibrium electron and ion temperature, respectively. The ratio derived through experimentally measured parameters as a function of electron temperature is shown in figure 7. The horizonal black dashed line donates the ratio is unity, above which is the condition for ITG turbulence dominates that of RBM. The experimentally measured ratio is about 1.1 at Te ≈ 80 eV, as shown by the vertical red dashed line, which is in qualitatively agreement with theoretical prediction. It is hinted that there is a transition zone where RBM and ITG mode can coexist and compete with each other, as sketch by the red zone, implying that the dominating instability has transformed from RBM to ITG mode with increasing electron temperature.

Figure 7. Dependence of experimentally measured condition for the transition between the RBM and ITG mode on the electron temperature.
Download figure:
Standard image High-resolution image3.4. comparison between experimental and simulation results
In order to understand these observations, we have carried out simulations based on the experimentally measured parameters. The model used in our simulation is an integrated drift-resistive-inertial-ballooning model (DRIBM) which combines both pressure-driven ballooning instability and gradient-driven drift wave instabilities such as ITG modes and TEMs [41]. Based on [41], this model includes the effect of electron inertia, electromagnetic perturbations, diamagnetic effects, parallel ion dynamics, transverse particle diffusion, perpendicular gyroviscous stress, electron–ion temperature gradients, and improvements on the role of effective charge Zeff, from which we could derive the growth rate of drift waves and pressure gradient driven modes. Detailed model equations are provided in appendix.
The set of parameters used in the simulation is shown in figure 8, which is derived during one period of the gas puffing from Langmuir probe data. The density decreases while the temperature increases, and vice versa, as shown in figure 8(a). During the decrease of the density gradient, the temperature gradient shows a steep increase if the temperature is larger than about 50 eV, as illustrated in figure 8(b). Accordingly, gn = R/Ln decreases gradually while  suddenly increases for larger Te, resulting a sudden increase in ηe,i (=dlnTe,i/dlnn), which is responsible for temperature gradient driven modes such as ITG modes. Figure 8(c) shows the collision rate νei normalized by the electron magnetic drift frequency ωDe = 2kθCs/R. The mean poloidal wavenumber kθ used in figure 8(d) is derived by the 'two-point' method [42]. It is noticed that the value of kθρs is quite small in our case, especially in the high temperature scenario when Te > 80 eV, due to probably insufficient precision of probe data detected at high Te. Nevertheless, it is not essential in our simulation work, e.g. simulation has showed that the RBMs are unstable at kθρs = 0.05 and ITG modes unstable at kθρs ⩾ 0.1, respectively [23]. It is interesting to see that in the high temperature range, ηe,i increases abruptly when Te > 50 eV, and reaches 2/3 at about Te ~ 80 eV, as shown in figure 8(e). Here we have assumed that Ti = Te and ηi = ηe. In theory, although the growth rate of RBM increases as Ti/Te increases, it is nonessential under the assumption of Ti = Te in our model. It is seen that ITG modes would be motivated as ηi > 2/3, which further suggested that the turbulence type is mainly drift wave ITG modes at high Te. The results indicate a transition of edge instability from RBMs to ITG modes with the increasing of electron temperature, as previously shown in figure 3(a).
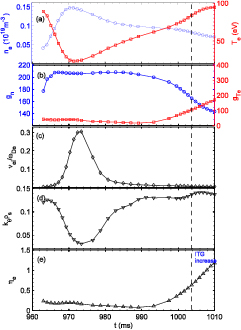
Figure 8. Time evolutions of (a) density (blue) and temperature (red) (b) gn (blue) and  (red), (c) collision νei normalized by electron magnetic drift frequency ωDe (d) wave number kθρs and mean kθ versus Te in the inset and (e) ηe within a gas puffing period. The vertical dashed line indicates ηe ≈ 0.64.
Download figure:
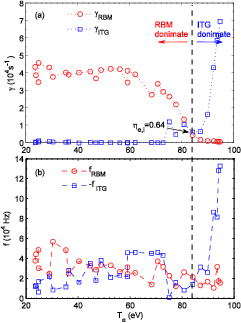
Standard image High-resolution imageThe simulated growth rate of turbulence versus the local temperature is depicted in figure 9, where figures 9(a) and (b) are γ and mode frequency of the most unstable mode estimated by simulation. In the lower temperature range Te < 70 eV, the growth rate of RBM is nearly constant about  while ITG modes growth rate is
  , suggesting that the turbulence type is mainly RBM. A competition between RBMs and ITG modes accrue when
  , with ITG modes unstabilized due to increasing of ηi and RBM stabilized due to the decrease of resistivity. As Te > 80 eV, ITG modes show a fast growth while RBM is suppressed, suggesting a transition of turbulence type from MHD to drift wave, as shown in figure 9(a) by the vertical dashed line (ηi,e ~ 0.64). The ITG modes and RBMs drift in the opposite direction (ion diamagnetic for ITG modes and electron diamagnetic for RBMs, respectively). The frequencies of RBM and ITG depend on typical parameters and show a qualitatively agreement with frequency spectrum obtained by Doppler reflectometry, as previously shown in figure 5. While drift-type ITG modes are dominating, GAMs are driven which is consistent with present theory, as shown in figure 6. It is interesting to see that similar simulation results have been obtained in [24] for the JET-ILW data, even in various effective charge (Zeff) cases.
Figure 9. Dependence of (a) growth rate γ and (b) mode frequency for RBM (red circle) and ITG (blue square) on electron temperature Te, respectively. The vertical dashed line indicates ηi,e ~ 0.64.
Download figure:
Standard image High-resolution image
4. Conclusions
In this work, the transition from resistive pressure driven mode (RBM) to gradient-driven drift wave instability (ITG) is investigated by gas puffing modulation experiments in the HL-2A tokamak. It has been found that in the low temperature range of Te < 80 eV, with increasing electron temperature and hence a reduction of resistivity, both the probe and reflectometry data show that the turbulence decorrelation time τd decreases. These modes are consistent with RBM feathers. However, in the high temperature range Te > 80 eV, as the temperature gradient and ηe,i increases, the τd increases, meanwhile GAMs are enhanced, which is consistent with ITG turbulence. Frequency spectrum indicates that RBM and ITG drift in electron and ion diamagnetic direction, respectively. The measured parameter for ITG turbulence dominating that of RBM shows a well agreement with theoretical prediction. To further understand our observations, simulations based on drift-resistive-inertial ballooning model using experimental parameters have been carried out. The RBM growth rate decreases with the temperature, while the ITG modes growth rate increases if Te > 80 eV, leading to a transition from MHD to drift wave at the plasma edge. In summary, experiments and simulations have suggested the transition of the dominate instability from RBM in the low Te regime to drift-type ITG mode in the high Te range, which is useful for understanding the edge turbulence nature and its role on the H mode.
Acknowledgment
This work is partly supported by Chinese National Fusion Project for ITER under grant Nos. 2014GB108001, 2015GB106005, 2013GB112008, 2014GB107000 and the National Natural Science Foundation of China under Grant Nos. 11375054, 11505048 and 11575057.
Appendix. Eigen equations of drift-resistive-inertial-ballooning model
Here we present the linearized model equations as follows:

The following notation is used in these equations,  ,
, 
 ,
,  ,
,  are dimensionless forms of the perturbed density, parallel ion velocity, electron/ion temperature, electrostatic potential, and parallel component of vector potential, e the unit charge, respectively. Here
  and
and  are electron diamagnetic drift frequency and magnetic drift frequency, respectively. In addition,
  ,
,  ,
,  ,
,  and
and  are the temperature ratio of ion to electron, the sound velocity, the ion Larmor radius, effective collisional ratio and the ratio of electron pressure to magnetic pressure, respectively. Te,i0, n0,
  and
and  are equilibrium electron/ion temperature, electron density, radial gradients of electron/ion temperature and density, respectively. ω is the frequency of perturbations,
  , and
, and  , where
  ,
,  , and
, and  are the density gradient, the ITG, and the ETG, respectively. Function
 ![$g(\theta)=\cos (\theta)+[\hat{s}\theta -\alpha \sin (\theta)]\sin (\theta)$](https://content.cld.iop.org/journals/0029-5515/58/3/036002/revision2/nfaaa2a9ieqn054.gif) implies inhomogeneity of magnetic field.
implies inhomogeneity of magnetic field. 
 characters the plasma pressure gradient,
  the poloidal angle,
  the magnetic shear, q the safety factor, R the major radius of a tokamak, and r the radial coordinate. For a shifted circular equilibrium model, the ballooning transformation is applied, thus we have
  ,
, ![$k_{\bot}^{2}\rho _{s}^{2}=k_{\theta}^{2}\rho _{s}^{2}[1+{{(\hat{s}\theta -\alpha \sin (\theta))}^{2}}]$](https://content.cld.iop.org/journals/0029-5515/58/3/036002/revision2/nfaaa2a9ieqn060.gif) , where
, where  denotes the poloidal wave vector of perturbations. The set of equations is solved by eigenvalue method, from which the growth rate γ and real frequency f of dominating instability are estimated.