


Abstract
This paper presents for the first time a statistical validation of predictive TRANSP simulations of plasma temperature using two transport models, GLF23 and TGLF, over a database of 80 baseline H-mode discharges in JET-ILW. While the accuracy of the predicted Te with TRANSP-GLF23 is affected by plasma collisionality, the dependency of predictions on collisionality is less significant when using TRANSP-TGLF, indicating that the latter model has a broader applicability across plasma regimes. TRANSP-TGLF also shows a good matching of predicted Ti with experimental measurements allowing for a more accurate prediction of the neutron yields. The impact of input data and assumptions prescribed in the simulations are also investigated in this paper. The statistical validation and the assessment of uncertainty level in predictive TRANSP simulations for JET-ILW-DD will constitute the basis for the extrapolation to JET-ILW-DT experiments.
Export citation and abstract BibTeX RIS
Introduction
The EUROfusion Consortium is planning deuterium–tritium (D–T) experimental campaigns in 2019 in JET with the ITER-like wall (ILW) to address physics issues which are important for ITER D–T experiments [1]. To achieve the scientific objectives, JET operation should demonstrate 10–15 MW of fusion power for at least 5 s, a performance never attempted before in fusion research history. Previously, JET and TFTR produced a peak fusion power of 16.1 MW in 1997 [2] and 10.7 MW in 1994 [3] respectively, but steady state operation with such a high fusion power has never been achieved. In order to prepare these unprecedented JET operational scenarios with D–T mixtures, reliable predictive simulations are of crucial importance. However, the current capability to predict plasma temperature evolution and the resultant fusion power is still limited. This is mainly due to the incompleteness of turbulent transport models and the uncertainties of the input data (e.g. pedestal top temperature, radiation, rotation profiles, etc). In addition to these issues limiting the present prediction capability, the D–T mixture would add even further uncertainties resulting from hydrogenic isotopes and alpha particles physics. Quantification of the impact of the foreseen uncertainties on reproducing the present discharges has therefore a high priority in preparation for the extrapolation to JET D–T experiments. In this paper, the current prediction capability of Te, Ti, and neutron yields with predictive TRANSP [4, 5] simulations where the turbulent transport is calculated by GLF23 [6, 7] and TGLF [8, 9] is assessed statistically over 80 baseline H-mode discharges at JET-ILW. In order to take into account the uncertainties due to the input data and assumptions, all discharges were simulated using identical default simulation settings. Based on these reference simulations, the impact of collisionality regime, pedestal top temperature, radiation profile, and toroidal rotation on temperature profile predictions are investigated by modifying an input or an assumption in the reference simulation settings. The above statistical validation of predictive TRANSP simulations at JET-ILW-DD will constitute the basis for the extrapolation to JET-ILW-DT experiments.
The database of the baseline discharges and the inputs and assumptions used for the reference simulations are introduced in section 1. In section 2, the Te prediction capability of TRANSP-GLF23 or TRANSP-TGLF are assessed via a comparison with the Te measured by high resolution Thomson scattering (HRTS) [10], and the impacts of the input data and assumptions used on the Te predictions are investigated. In section 3, the Ti prediction capability is also assessed by comparison with the Ti measured by charge exchange (CX) spectroscopy [11]. In section 4, the impact of the predicted Ti on the resultant neutron yield calculation is investigated by comparing the calculated neutron yields to the neutron yields measured by fission chamber [12, 13]. The conclusion of the paper is provided in section 5.
1. Input and assumptions
The database consists of 80 baseline H-mode discharges with JET-ILW which cover a large range of the engineering parameters as well as the dimensionless plasma parameters.
- 46 discharges selected for ITPA database [14]: low q95(=2.7–3.3) experiments for 2012–2014, stationary state for 5 confinement times (τE) in baseline H-mode (i.e. βN > 0.85 βN, max), rotation profile available, Ip (=2–3.5 MA), Bt (=1.9–3.2 T), Pheat (=10.8–27.7 MW), Te0 (=2.2–6 keV), 〈ne〉 (=4–10.2 × 10¹⁹ m−3), βN (=1–2)
- 22 discharges selected for dimensionless plasma parameter scanning [15]:
 = 0.04–0.15 at ( = 0.4), * = 0.003–0.005
 - 10 discharges selected for comparative confinement study [16]: Ip (=2.5 MA), Bt (=2.7 T), Pheat (=14–17 MW), 〈ne〉 (=7.1–10.2 × 10¹⁹ m−3)
- 2 reference discharges selected for the task of DT scenario extrapolation at JET (called T15-01) i.e. 87215 and 87412


For the 80 reference predictive simulations, core temperatures Te and Ti are predicted over the radial regions  = 0–0.9, and the boundary condition for temperature profile computation was given by experimental data at
  = 0.9. The input settings and assumptions used in the reference simulations are the following:
- Te boundary condition is prescribed by the experimental measurement of HRTS at = 0.9
- Ti boundary condition is assumed to have Ti = Te at = 0.9
- Whole profile of electron density ne (i.e. = 0–1) is prescribed by experimental measurement of HRTS [10]
- Turbulent transport for = 0–0.9 is computed by GLF23 [6, 7] or TGLF [8, 9]
- Neoclassical transport for = 0–0.9 is computed by NCLASS [17]
- Uniform radiation profile is prescribed by bolometry measurement (i.e. BOLO/TOBU) [18]
- Uniform Zeff profile is prescribed by bremsstrahlung [19] assuming Be is the only impurity.
- Toroidal rotation profile is prescribed by the measurement of CX spectroscopy [11]
- Heating and particle source terms calculated consistently by NUBEAM [5, 20] and TORIC [21, 22]


2. Prediction of the electron temperature
In this section, the impacts of collisionality regime with different turbulent transport solver (i.e. GLF23 or TGLF), Te boundary condition, radiation profile input, and toroidal rotation prediction on predicting Te in TRANSP were individually investigated by modifying only one simulation setting from the reference settings defined in section 1.
2.1. Impact of collisionality regime
The current Te prediction capability with TRANSP-GLF23 for baseline H-mode JET-ILW discharges is presented in figure 1(a) where the predicted Te values are compared to the Te measured by HRTS. Each symbol indicates Te averaged over different radial windows i.e. black circles ( = 0.3–0.5), red diamonds (
 = 0.5–0.7), and blue squares (
 = 0.7–0.9). As the line of sight of HRTS measurement in the discharges is deviated from the magnetic axis, Te data for
  = 0–0.3 is not available to compare in figure 1(a). Overall, TRANSP-GLF23 simulations reproduce Te with a Pearson correlation coefficient7 of 0.714 [23]. From the edge region to the core region (i.e. blue squares, red diamonds, and black circles in order), the predicted Te becomes more deviated from the HRTS measurement, as the boundary condition of Te is given by the Te measured at
  = 0.9. Furthermore, a number of the predicted core Te (
 = 0.3–0.5) are under-predicted, as indicated by the green dashed ellipse in figure 1(a). These discharges have low core collisionality
  (<0.08) in common, and figure 1(b) shows more clearly that the core Te reproducibility with TRANSP-GLF23 is subject to core
  i.e. under-prediction at low core
  and over-prediction at high core
  .
.

Figure 1. (a) Te predicted by TRANSP-GLF23 using the reference simulation settings is compared to Te measured by HRTS. The comparison is made over 80 baseline H-mode JET-ILW discharges. The radial windows in which Te is averaged are indicated by blue squares ( = 0.7–0.9), red diamonds (
 = 0.5–0.7), and black circles (
 = 0.3–0.5). Te predicted by TRANSP-GLF23 shows a Pearson correlation coefficient of 0.714. (b) The impact of
  on the ratio of the predicted Te to the measured Te is shown. Te and core
  are averaged over
  = 0.3–0.5.
Download figure:
Standard image High-resolution imageThe same analysis has been done with 'Trapped' GLF (TGLF), which is a more complete turbulent transport model solving gyro-Landau-fluid (GLF) equations [24] with better accuracy than GLF23 [25]. While GLF23 solves an 8 × 8 matrix eigenvalue problem i.e. 4 moments equations with 2 species +1 poloidal basis function, TGLF solves a 120 × 120 matrix eigenvalue problem i.e. 15 moments (12 for passing particles and 3 for trapped particles) with 2 species +4 poloidal basis functions [9]. This enables modelling of trapped particles in a more complete way in TGLF. While a more completed approach for this should be possible with gyrokinetic simulations, the computation of transport with gyrokinetic simulations for a large radial region is too expensive for routine use. Although TGLF is also computationally much more expensive than GLF23, it is still affordable to routinely perform simulations for a large radial region i.e.  = 0 ~ pedestal top, together with a consistent source calculations of heat and particles from NBI and ICRH. The consequence of the main improvement in TGLF is indeed shown in figure 2(a). The Te predicted by TRANSP-TGLF shows better agreement with the measured Te having a Pearson correlation coefficient of 0.869, and the under-prediction of the core Te at low core
  is much less significant (see figure 2(b)).

Figure 2. (a) and (b) Te is predicted by TRANSP-TGLF. Otherwise, it is the same analysis as in figures 1(a) and (b). Te predicted by TRANSP-TGLF has a Pearson correlation coefficient of 0.869.
Download figure:
Standard image High-resolution imageThe dependencies of core Te prediction (i.e. for  = 0.3–0.5) on core
  in TRANSP-GLF23 and TRANSP-TGLF are compared with the discharges selected for
  scan where the other dimensionless parameters (i.e.
  * and βN) are maintained. Figure 3(a) clearly shows that the under-prediction of Te at low core
  is much less significant in TRANSP-TGLF than in TRANSP-GLF23.

Figure 3. (a) Comparison of Te predicted with TRANSP-GLF23 (red squares) and TRANSP-TGLF (black circles) over the discharges of  scan database where the other dimensionless parameters do not vary. (b) The impact of core
  on core Te prediction in TRANSP-GLF23 and TRANSP-TGLF is shown. Te and core
  are averaged over
  = 0.3–0.5.
Download figure:
Standard image High-resolution imageRecalling that  is the ratio of the effective collision frequency for trapped particles to the frequency of their bounce orbit,
the likelihood of a particle completing a bounce orbit increases in the low  regime, and the model of trapped particle physics therefore becomes important. The under-prediction of Te at low
  implies that the turbulent heat fluxes associated with the trapped particles are over-calculated. Figure 3(b) shows that when the other dimensionless parameters are maintained the dependency of Te prediction on
  is more visible, and under-calculation of Te is more significant in GLF23 where the trapped particle model is more simplified than TGLF.
2.2. Impact of Te boundary condition
Neither GLF23 nor TGLF includes the transport in the edge transport barrier (ETB), and the steeper Te profile in the ETB region is therefore not calculated correctly using the present core turbulent transport models. This requires the pedestal top Te as a boundary condition. For present discharges a correct pedestal top Te can be found from measurements, but for future discharges it requires assumptions. The impact of Te boundary condition on core Te prediction therefore needs to be investigated. For this investigation, the Te boundary condition in the simulations is given by the fitted HRTS profiles at  = 0.8, and the temperature predictions are made for
  = 0–0.8. In figure 4(a), the TRANSP-GLF23 predictive simulation results with this modified setting are compared against the reference simulations where the Te boundary position was
  = 0.9. Note, the inputs and assumptions in these two simulation groups are identical, apart from the Te boundary position. Figure 4(a) shows that in some discharges the predicted values of core Te are increased by setting the boundary Te at
  = 0.8. This is due to the fact that in those discharges the width of the ETB region is wider than
  = 0.9–1. One of the typical discharges with such a wide ETB region is shown in figure 4(b) where the Te profile measured by the HRTS and the Te profiles predicted with different Te boundary position are compared. As the radial position
  = 0.9 of the Te boundary condition is not inner enough to exclude the ETB region, the steep gradient of the Te profile in the ETB region is not reproduced in the simulations. As a result, the Te predicted at
  = 0.8 with the Te boundary condition given at
  = 0.9 is lower than the measured Te at
  = 0.8, and the predicted core Te with the Te boundary condition at
  = 0.9 is thus also lower than that with the Te boundary condition given at
  = 0.8. However, it is worth noting that the gradient of the core Te profile is not significantly modified by different Te boundary conditions. Although it is not shown in this paper, the same feature is also observed in TRANSP-TGLF. This feature implies that the predicted core Te can be changed by different assumptions of Te boundary condition, but not more than the difference in the assumed boundary Te.

Figure 4. (a) The impact of the Te boundary position on Te prediction with TRANSP-GLF23 is shown. The notation of the symbols are the same as figure 1(a). (b) One of the typical discharges where the ETB region is wider than  = 0.9–1 is shown. The Te profiles predicted with GLF23 using the Te boundary condition given at
  = 0.9 (blue) or
  = 0.8 (black) are compared. The experimental data of HRTS measurement with error bars and the fitted profile are also shown.
Download figure:
Standard image High-resolution image2.3. Impact of radiation profile
In the bolometry measurement system at JET, the total radiated power is automatically produced by inter-shot analysis. While the total radiated power can be used as an input data in predictive simulations assuming a uniform radiation profile, there was a concern about the profile effects of radiated power on Te prediction. However, as there is no automatic routine available to reconstruct radiation profiles, the radiation profile data can only be produced manually, requiring considerable human effort. This is not desirable to build a large database of predictive simulations. The impact of radiation profile is assessed by comparing 80 TRANSP-GLF23 simulations with reconstructed radiation profiles to the reference simulations with the default setting (i.e. with uniform radiation). As shown in figure 5(a), for a vast majority of predictive simulations, the impact of the profiles of radiated power is negligible. The impact is only visible in discharge #87412, but it turned out that in this discharge the total radiated power differs significantly between uniform radiation and radiation profile (see figure 5(b)). Hence, the profile effect of radiated power is not important for the predictive simulations of JET-ILW baseline discharges, as long as the estimate of the total radiated power is correct. This enables one to assume only total radiation power when predicting future discharges, rather than having to assume a more complicated radiation profile.

Figure 5. (a) The impact of the radiation profile on Te prediction with TRANSP-GLF2. The notation of the symbols is the same as figure 1(a). (b) Uniform radiated power (BOLO/TOBU) and radiation profile (BOLT/AVFL) in #87412 are compared.
Download figure:
Standard image High-resolution image2.4. Impact of toroidal rotation frequency
The toroidal rotation frequency has an impact on predicting temperature profiles as it determines the ExB flow shear stabilisation of turbulent heat flux. In GLF23, the turbulence quench rule,  , is adopted [7] where
  is the maximum growth rate of the drift-wave instabilities, and
  (=
(= ) is E × B flow shearing rate.
  is a coefficient to adjust the level of E × B flow shear stabilisation. In this paper, a fixed value of
  = 1 is used for all simulations. In TRANSP-GLF23, the poloidal E × B flow velocity
  is calculated by
  where Er is a radial electric field and Bt is a toroidal magnetic field. The Er is calculated by using a zero'th order formula derived from an assumed force balance between the electrostatic force due to Er and the Lorentz force (i.e.
  ) [26], and here Vt is given by the toroidal rotation frequency. The toroidal rotation frequency can be obtained by analysing CX spectroscopy or by solving the internal momentum transport equation in TRANSP-GLF23 or TRANSP-TGLF. The impact of the toroidal rotation predicted by TRANSP-GLF23 on Te prediction is shown in figure 6(a) by comparing the simulation results against the reference simulations where the rotation frequency was given by CX spectroscopy. Note, in this comparison, the only difference in simulation setting between the two simulation groups is the toroidal rotation i.e. predicted rotation frequency or measured rotation frequency. In a majority of discharges, the Te predicted with predicted rotation frequency is calculated to be higher than that with measured rotation frequency. As shown by the comparison between the measured rotation and the predicted rotation in figure 6(b), this is because TRANSP-GLF23 significantly over-predicts the rotation frequency compared to the CX-measured value, thereby resulting in the excessive E × B flow shear stabilisation. This indicates that, for predicting future JET-ILW baseline discharges, reasonable assumption of toroidal rotation will be necessary as the rotation prediction is not reliable for the current version of TRANSP-GLF23. The comparison with TRANSP-TGLF simulation results couldn't be made due to the limitation of CPU available, resulting from the expensive computation cost of TGLF.

Figure 6. (a) The impact of predicted rotation frequency on Te prediction with TRANSP-GLF23. (b) Comparison of toroidal rotation between CX measurement and TRANSP-GLF23 prediction.
Download figure:
Standard image High-resolution image3. Prediction of the ion temperature
Ti predicted by TRANSP- GLF23 or TRANSP-TGLF over the 80 baseline H-mode discharges are compared against Ti measured by CX spectroscopy in figures 7(a) and (b), respectively. The comparison of core Ti is limited up to  = 0.4–1 as the CX data is not available. This is because CX spectroscopy analysis has been difficult due to the issue of weak signal since the replacement of the plasma facing components to ILW i.e. Be and W. While a significant uncertainty level of Ti prediction with TRANSP-GLF23 is observed (Pearson correlation coefficient = 0.696), Ti prediction with TRANSP-TGLF has a better accuracy (Pearson correlation coefficient = 0.801). It should be noted that in both GLF23 and TGLF simulations the reproduced Ti include the uncertainty of the Ti boundary condition as it is given at
  = 0.9 assuming Ti = Te for all the predictive simulations. As discussed before, for some discharges this boundary position is not enough to exclude the ETB layer. The number of discharges with under-predicted Ti would be reduced if the Ti boundary position was shifted into the core e.g.
  = 0.8.
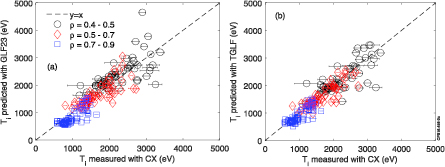
Figure 7. (a) Ti predicted by TRANSP-GLF23, i.e. the reference simulations, is compared against Ti measured by CX (Pearson correlation coefficient = 0.696). (b) Ti prediction with TRANSP-TGLF is compared against Ti measured by CX (Pearson correlation coefficient = 0.801).
Download figure:
Standard image High-resolution image4. Prediction of the neutron yields
The level of Ti prediction accuracy affects neutron yield calculation as the fusion cross-section is a strong function of Ti. Figure 8(a) compares the neutron yields calculated by interpretive TRANSP analysis using the HRTS-measured Te profiles against the neutron yields measured by the fission chamber [12], which was calibrated in 2013 [13]. Here, Ti = Te is assumed as CX-measured Ti is not available within  < 0.4. This assumption can be justified as all discharges in this paper are baseline H-mode discharges where the equilibration between electrons and ions is high due to high ne. As can be seen by the formula for neutron yields calculation,
the scattering of the data points in figure 8(a) results from the uncertainty of the input data e.g. Te, Zeff, ne, fast ion parameters such as  and
and  , etc. The data points would be even more scattered if predicted Ti were used in the calculation. The neutron yield calculated with the Ti predicted by TRANSP-GLF23 (i.e. reference simulations) and by TRANSP-TGLF are compared against the measured neutron yields in figures 8(b) and 9, respectively. While the Pearson correlation coefficient of calculated neutron yields has significantly decreased by replacing the measured Ti with the Ti predicted by TRANSP- GLF23 i.e. from 0.942 in figure 8(a) to 0.825 in figure 8(b), the decrease is much smaller when replaced with Ti predicted by TRANSP-TGLF i.e. from 0.942 in figure 8(a) to 0.910 in figure 9. The higher accuracy of Ti predictions in TRANSP-TGLF enables much smaller impact on the neutron yields calculation.

Figure 8. (a) In the 80 baseline H-mode discharges, the neutron yields calculated by interpretive TRANSP analysis with HRTS Te profiles assuming Ti = Te are compared to the neutron yields measured by the fission chamber. (Pearson correlation coefficient = 0.942). (b) The neutron yields are calculated with Te and Ti predicted by TRANSP-GLF23 i.e. the reference predictive simulations (Pearson correlation coefficient = 0.825).
Download figure:
Standard image High-resolution image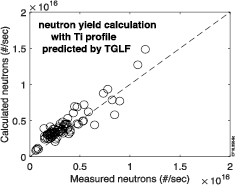
Figure 9. The neutron yields are calculated with Te and Ti predicted by TRANSP-TGLF. (Pearson correlation coefficient = 0.910.)
Download figure:
Standard image High-resolution image5. Conclusion
Predictive simulations using TRANSP-GLF23 and TRANSP-TGLF of a large number of baseline H-mode discharges have been carried out to assess the present prediction capability for electron temperatures and ion temperatures in line with JET-DT preparation. A dependency of the Te predictions on the collisionality regime is found in the TRANSP-GLF23 simulations i.e. under-prediction at low core  and over-prediction at high core
  . The impact of core
  is less significant in the TRANSP-TGLF simulations where the trapped particle physics is modelled in a more complete way. As a result, the Te prediction accuracy of TRANSP-TGLF is much improved compared to TRANSP-GLF23. The value of the core Te predicted with GLF23/TGLF depends on the Te boundary value, while neither GLF23 nor TGLF can model the transport in the ETB region. This means the radial position of the boundary value should be defined far enough into the core to exclude the ETB region in predictive simulations. It was also observed that the gradient of the predicted Te profiles is not sensitive to the boundary Te value (due to stiffness of the transport model). A uniform profile input of radiated power does not significantly change the results of TRANSP-GLF23/TGLF simulations for JET baseline H-mode discharges compared to the simulations with reconstructed radiation profile input as long as the total radiated power is correct. The ExB stabilisation model in GLF23/TGLF is a function of toroidal rotation, but in the 80 baseline H-mode discharges, TRANSP-GLF23 over-predicts the rotation significantly, so reliable rotation input and assumptions are necessary for JET-DT prediction. While the uncertainty in the Ti predictions with TRANSP-GLF23 significantly adds further uncertainty to neutron yields predictions, Ti predictions with TRANSP-TGLF have much better agreement with Ti measurements, thereby enabling better predictions of fusion power.
Acknowledgment
This work has been carried out within the framework of the EUROfusion Consortium and has received funding from the Euratom research and training programme 2014–2018 under grant agreement No 633053. The views and opinions expressed herein do not necessarily reflect those of the European Commission.
Footnotes
- 7
Pearson correlation coefficient is defined as
where cov(X, Y) is the covariance, and and are the standard deviation of X and Y, respectively.


