


Abstract
In this paper we present a conceptual design of a back scattering neutron time of flight spectrometer (BackTOF) for use at ITER. The proposed BackTOF design aims at fulfilling the requirements set on a neutron spectrometer system to be used for inferring the core fuel ion ratio in a DT plasma. Specifically we have investigated the requirements on the size, energy resolution, count rate capability, efficiency and signal to background ratio. These requirements are a compact size that fits in roughly 1 m3, an energy resolution of 4% or better, a count rate capability of at least 100 kHz, an efficiency of at least 10−5 and a signal to background ratio of 1000 or better.
Using a Monte Carlo model of the BackTOF spectrometer we find that the proposed BackTOF design is compact enough to be installed at ITER while being capable of achieving a resolution of about 4% FWHM with a count rate capability of 300 kHz and an efficiency at 1.25 · 10−3. This is sufficient for achieving the requirements on the fuel ion ratio at ITER. We also demonstrate how data acquisition systems capable of providing both timing and energy information can be used to effectively discriminate random background at high count rates.
Export citation and abstract BibTeX RIS
1. Introduction
Neutron emission spectroscopy (NES) in fusion research can provide information on several important plasma parameters, including an estimate of the fuel ion ratio (nt/nd) in the core of a burning plasma, which is described in detail in [1]. The estimate of the fuel ion ratio is, today, the primary motivation for considering a High Resolution Neutron Spectrometer (HRNS) at ITER. In short, the method relies on separate measurements of the thermonuclear and beam-target neutron emissions. These are here referred to as RTH and RBT, respectively, and scale as
where nd and nt, are the core averaged deuterium and tritium densities, and  denotes the reactivity. In a burning plasma, RTH is by far the dominating source, and an optimum is located at nd = nt. Any deviation from the optimal fuel ion mix will lower the fusion power. For efficient burn control, it is therefore important to know the fuel ion ratio in order to plan the plasma fueling. At ITER, the fuel ion ratio is considered essential for plasma control [2]. However, by only measuring the total neutron rate, or fusion power, it is not possible to tell if nt/nd is increasing or decreasing since there are two unknowns and only one measurement. On the other hand, the combined measurement of RTH and RBT provides an equation system with two measurements. If the reactivities and the beam ion density (nb) are also calculated, as was done in [1], it is possible to infer nt/nd from the data.
The energy spectrum of the thermonuclear emission is well approximated by a Gaussian centered around 14 MeV and with a width given by the fuel ion temperature [3]. The spectrum of the beam-target emission depends mainly on the properties of the slowing distribution of the beam and is typically obtained with a Monte Carlo calculation [4]. By fitting the two spectral components to the measured data from a HRNS it is possible to spectroscopically separate them and obtain measurements of RTH and RBT individually. This is a well-established procedure that has been tested with several different neutron spectrometers, see e.g [5]. where data from the magnetic proton recoil spectrometer MPR [6] and the time of flight spectrometer TOFOR [7] were used.
However, performing the measurement at ITER is a very challenging task, and none of the presently demonstrated systems can simultaneously fulfill all requirements set on a HRNS for determining the fuel ion ratio. The main requirements are summarized in the bullet list below and motivated in more detail in the following paragraphs:
- a relatively compact size and low weight (the entire spectrometer should fit within roughly 1 m3),
- an intrinsic energy resolution (prior to any unfolding techniques) of about 4%,
- a count rate capability of at least 100 kHz,
- an efficiency of at least 10−5,
- a signal to background ratio of at least 1000, and
- being able to withstand the harsh environment close to a burning fusion plasma. This concerns both magnetic fields in the order of one Tesla as well as strong neutron radiation.
The size and weight restrictions are the main reasons that an MPR system is difficult to use at ITER.
In [1] it was found that an energy resolution of about 4% was needed for an accurate separation of the thermonuclear and beam-target emission components. With a worse energy resolution, the measured data will be dominated by the spectrometer response function and not the incoming neutron energy spectrum. The effect is that even small uncertainties in the response function and the modeled spectral components can result in large systematical errors in the analysis.
The required count-rate capability stems from the required statistical accuracy and time resolution of the nt/nd measurement at ITER, i.e. 20% and 100 ms, respectively. Note however that ITER has no specific requirements on the fusion power range for the determination of the fuel ion ratio. This has a few implications on the required count rate capability and efficiency, which we discuss here.
In [8] it was concluded, from an error propagation using synthetic data, that in order to estimate the fuel ion ratio with 20% accuracy RBT must be measured with at least 10% accuracy. This in turn was found to require about 10 000 counts in each spectrum from the HRNS. To achieve the desired time resolution at ITER (100 ms) a total count rate of at least 100 kHz is therefore required.
The count rate capability of the HRNS then defines the range in fusion power over which the ITER requirements on the fuel ion ratio determination can be met. For example, if the count rate capability is 300 kHz and a collimation is arranged for such that this count rate is obtained at maximum fusion power, the requirements for the fuel ion ratio estimate can be met down to 1/3 of maximum fusion power. At lower fusion power the HRNS would count below 100 kHz, and the requirements for accuracy and time resolution can no longer be met simultaneously. The range in fusion power over which the ITER requirements on the fuel ion ratio can be met would therefore be 3 in this example.
A similar discussion can be made for the required efficiency. Assuming an efficiency of 10−5 it is reasonable to arrange for a collimation at ITER that achieves a count rate of 100 kHz at maximum fusion power. In order to reach 300 kHz at maximum fusion power, as was used in the example above, an efficiency of 3 · 10−5 is therefore needed. Since there are no specific requirements on the fusion power range for the determination of nt/nd, we specify the requirements as at least 100 kHz count rate capability with an efficiency of at least 10−5. It should also be noted that for spectrometers with a large fraction of non-information carrying events, such as the low energy tail in diamond and compact spectrometers [9–11], the minimum count rate capability and efficiency is increased accordingly.
Further, the burning plasma conditions at ITER will result in a beam-target emission with an intensity of only a few percent in relation to the thermonuclear emission. The signature of the beam-target emission can be found on the high-energy side of the thermonuclear emission, around 17 MeV [8]. This means that any interference on the high-energy side in the data, either directly in the response function or from a background, should not exceed 1/1000. Otherwise the determination of the beam-target fraction will be impeded.
We present in this paper a conceptual design of a back scattering neutron time of flight spectrometer (BackTOF) that aims to fulfill all requirements for measuring the fuel ion ratio at ITER. The BackTOF was first conceptually studied in [12], but no detailed investigation of the response function was made.
2. The backscattering TOF spectrometer
2.1. Design and motivation
In a neutron time of flight spectrometer (TOF), information on the neutron energy is typically obtained from the time difference between elastic scattering in two sets of organic scintillator detectors. The first scattering takes place in the primary detector set (D1), and the secondary detector set (D2) subsequently catches a fraction of the neutrons that first scattered in the D1.
The back scattering time of flight spectrometer (BackTOF) works in a similar way as the traditional forward scattering TOF [9]. The difference is that the traditional TOF relies on forward scattering on hydrogen in the D1, while the BackTOF relies on backwards scattering on deuterium. The need for a deuterated D1 comes from the fact that neutron scattering on hydrogen cannot produce a backscattered recoil neutron since their masses are about equal, and the kinematics of the reaction does not allow for neutrons being scattered at angles larger than 90° in the lab frame. See figure 1 for a geometrical description of the two configurations. A forward TOF spectrometer is described in detail in [7]. We note here that a scattering angle around 30° is used, and the neutron recoil energy is therefore  ≈ 0.75 · En. In a BackTOF spectrometer, the scattering angle is close to 180°, and the recoil energy is
  ≈ 0.11 · En.

Figure 1. Geometry of a forward scattering TOF (left) and a backward scattering TOF (right). The symmetry axes are shown with dash-dot lines. The primary and secondary detectors (D1 and D2) are marked as well as the incoming and scattered neutrons (n and n').
Download figure:
Standard image High-resolution imageThe efficiency of a TOF spectrometer is given by the fraction of the incoming neutrons that scatter in the D1, into the solid angle covered by the D2, times the catching efficiency of the D2. Design parameters that affect the efficiency are the area and thickness of the D2 (AD2 and dxD2, respectively) as well as the distance from the D1 to the D2 (L). Increasing AD2 or decreasing L results in an increased solid angle covered by the D2, and hence a higher efficiency. Similarly, increasing dxD2 increases the catching efficiency of the D2, which also results in a higher total efficiency. A similar argument can be made for the count rate capability. The limiting factor here is the rate in the D1. Therefore, any design change that increases the efficiency also increases the maximum count rate capability.
The main contribution to the resolution of a TOF spectrometer is the fact that, due to the finite size of the D1 and D2 detectors, there is no 1:1 mapping from incoming neutron energy to flight time, tTOF. Instead, there is a distribution of flight times, which is typically simulated with Monte Carlo codes. The main contributing factors are the area and the thickness of the D2 detector. Since the velocity of a neutron (assuming classical kinematics) scales as √E, the energy resolution of the spectrometer scales as dE/E = 2 · dttof/ , where dttof is the standard deviation of flight times from incoming mono-energetic neutrons, and
  is the mean value of the flight times. Increasing AD2 or dxD2 improves the efficiency and count rate capability, but also results in a higher dttof and hence degraded resolution. Similarly, decreasing L improves the efficiency and count rate capability, but reduces
  , which also degrades the resolution. This illustrates the trade-offs between resolution, efficiency and count rate capability.
The forward scattering TOF is well suited for measurements of neutrons from the DD reaction with energies around 2.5 MeV. Consider a typical example; assuming a flight path of L = 1.25 m, the energy of the recoil neutron is around 1.9 MeV, which gives a  of 65 ns. A well-designed spectrometer will have a dttof of about 2 ns, and the energy resolution then becomes 2 · 2/65 = 6%, which is acceptable for analysis of the DD emission. However, for 14 MeV neutrons
  is reduced to 27 ns, and the energy resolution degrades to 14%, which is not acceptable for analysis of the DT emission. These figures are representative of the TOFOR spectrometer [9] in operation at JET. To improve the resolution of a forward TOF without sacrificing the efficiency and count rate capability requires a significant scale up of the spectrometer size, which precludes it from being used at ITER.
On the other hand, in the backscattering geometry, a 180° scattering of a 14 MeV neutron results in a recoil energy of 1.6 MeV. With a 125 cm flight path this gives a resolution of 5.5% if dttof is kept at 2 ns. For 14 MeV neutrons, this is almost three times better than forward scattering spectrometer despite the same physical dimension of the instrument. Further, the geometrical contribution to dttof in a BackTOF is smaller than for a forward scattering TOF, and the energy resolution can be expected to improve further. The exact numbers will be examined in section 3 with Monte Carlo calculations.
2.2. Background discrimination at high count rates
The dominating background in all time of flight spectrometers of the type studied here is that due to random coincidences between uncorrelated neutrons. Since the neutron emission from a fusion plasma is random in time, the random background signal will appear as a flat line in the spectrum, see e.g. the discussion in [7] concerning the TOFOR spectrometer. Modern data acquisition systems can record both the timing and energy deposition of each elastic scattering in the D1; it is therefore possible to define adaptive energy intervals that can discriminate parts of the random background. See e.g. [13–15], where this is implemented for the TOFOR spectrometer.
Consider an example, if a coincidence between two events in the D1 and D2 detectors is recorded, there is an interval of acceptable energy depositions in the D1 that is compatible with the time difference between the two events. If the energy deposition does not fall within this interval, the coincidence can be discarded as random background. On the other hand, if the energy deposition falls within this interval, it can be either a true coincidence or a part of the random background. The part of the random background where the energy deposition in the D1 overlaps with the allowed energy deposition for a true event cannot be discriminated in this way.
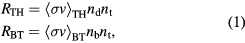
The efficiency of the adaptive energy thresholds to discriminate the random background therefore scales with the width of the acceptable interval compared to the energy span of all possible events. The BackTOF has very favourable properties in this regards. In figure 2 the acceptable interval for a forward as well as a BackTOF system is illustrated for 14 MeV neutrons as a function of scattering angle α. In both cases, an interval of α = ±10° is assumed. In the case of the forward TOF, the acceptable interval has a width of 4 MeV, which is about 30% of the entire range (0–14 MeV). On the other hand, for the BackTOF the interval is only 0.4 MeV wide, or about 3% of the entire range (0–12.5 MeV). The possibility to discriminate the random coincidences in the BackTOF is therefore enhanced by about 10 times compared with the forward TOF. The reason is that the geometry of the BackTOF is designed around an interval in the scattering angle where the energy deposition in the D1 varies slowly with the scattering angle. The opposite is true for the forward TOF.
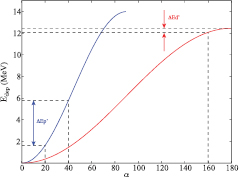
Figure 2. Illustration of the energy deposition a 14 MeV neutron makes as it scatters elastically on protons (blue) and deuterons (red) as a function of scattering angle.
Download figure:
Standard image High-resolution imageFinally, measurements of the energy deposition in the D1 detector can also be used to discriminate multiple scattering events in a D1 detector. For example, if the 180° scattering of a neutron in the D1 is divided into two scatterings (each less than 180°) the total energy loss will be lower compared to a single 180° collision. This will result in a shorter tTOF when compared to a single scattering. This can then be discriminated since the energy deposition in the D1 is no longer compatible with the shorter flight time.
2.3. MCNP model
In this paper, a MCNP model of a backscattering time of flight spectrometer has been used to simulate the instruments response to the neutron emission from a DT plasma. The model is based on a circular D2 detector of diameter 1.0 m and thickness 2 cm. A circular hole with diameter 15 cm is left in the middle of the D2 detector to allow for the neutron beam to reach the D1 detector. The D2 detector is further separated into 3 concentric rings. The separation of the D2 in 3 rings is in part a question of manufacturability, but it also allows for improved performance. Each ring will span a different interval of recoil angles, α in figure 1(b), and this will result in different lengths of the flight path (L), and hence different tTOF, for the same incoming neutron energy. By compensating for this difference the energy resolution of the spectrometer can be improved somewhat. Figure 3 shows an illustration of a possible detector arrangement using hexagonal detectors. The photo multiplier tubes are assumed to be mounted on the back.
Figure 3. Geometry of the detectors for the backTOF design studied in this paper. The D1 is shown to the left and the D2 to the right. Note that the D1 and D2 are not shown to scale.
Download figure:
Standard image High-resolution imageThe D1 detector is separated in 5 layers along the z-axis of the spectrometer, with each layer being 7 mm thick. To reduce the count rate in the D1 detectors, each layer was further divided in 4 equal parts. An illustration of a possible D1 assembly is shown in figure 3. The PM tubes are mounted on the side of each D1 detector with a light guide in between that converts the rectangular shape of the D1 detector to the circular shaper of the PM tube.
To simulate the spectrometer response to incoming neutrons we made use of the PTRAC option in MCNP. This allows for a detailed output of each interaction made by the Monte Carlo particles, including exactly where they interacted and with which timing. This is referred to as the neutron history. Synthetic data for the D1 and D2 detectors are subsequently made using the interactions recorded in the PTRAC file and a spectrometer response is calculated. Two different types of MCNP simulations were made.
In the first simulation, only neutron histories that contain at least one interaction in the D2 detector were written to the PTRAC file. This filters out e.g. neutrons that scatter in the forward direction in the D1 and never reaches the D2 to make a coincidence. This simulation was used to generate the instrument response function with no random background included. In each simulation 128 million particles were launched.
In the second simulation, all neutrons histories were written to the PTRAC file, even if they never interacted in the D2 to make a coincidence. This simulation was used to generate synthetic data that includes the random background between uncorrelated neutrons. This is important since the random background originates from coincidences between different neutrons. It is therefore not necessary for a neutron to interact in the D2 in order to contribute to the random background. In order to keep the size of the PTRAC file manageable, the simulation was limited to 6.4 million neutron histories. A time trace of synthetic data was then constructed by adding a random starting time to each neutron history. By adjusting the range of random starting times, different intensities of the flux on the D1 can be simulated. For example, to simulate an area integrated neutron flux at the D1 of 108 s−1, the simulated neutron histories are distributed randomly between 0 and 6.4 · 106/108 s = 0.064 s. Subsequently, a time of flight histogram is created from all possible coincidences in the simulated data.
3. Simulation results
3.1. Response function
In figure 4, the time of flight histogram for the simulated spectrometer response to 14 MeV neutrons is shown. The results are based on an MCNP simulation with 128 million neutron histories. The total response without the kinematic energy cuts is shown in solid blue. The main peak is located at ttof = 74 ns, and dttof = 1.6 ns. The energy resolution at full width half maximum is therefore 4.3%. As can be seen, there are prominent structures at a level of a few percent in intensity on both sides of the main peak. The structures are due to neutrons colliding multiple times in the D1 detectors, either on deuterium or on carbon.

Figure 4. Calculated response function from 14 MeV neutrons showing total response with no kinematic cuts (solid blue), the contributions from scattering on carbon and multiple scattering on deuterium (dash-dot green and dashed red, respectively) as well as the total response with kinematic cuts (dotted black).
Download figure:
Standard image High-resolution imageAlso shown in figure 4 are separate tTOF histograms from histories where the incoming neutron has either scattered on carbon-12, or multiple times on deuterium in the D1. These are shown in red dashed and green dash-dot, respectively. From this analysis it is clear that the structure on the high-energy side (tof < 74 ns) is predominantly due to neutrons scattering on carbon. The higher mass of the carbon nuclei causes the neutrons to loose less energy in the recoil compared to scattering on deuterium. Therefore they can travel the distance from D1 to D2 faster and produce a lower time of flight. Multiple scattering on deuterium in the D1 mainly shows up on the low-energy side of the main peak. Such multiple scattering typically causes a larger energy loss compared to the single scattering, and the time of flight is therefore increased.
The response function after the kinematic cuts have been applied is also shown in figure 4 in the dotted black line. The kinematic cuts are effectively discriminating the structures on both the high- and low-energy sides of the main peak, which remains near-Gaussian for at least three orders of magnitude. Of particular importance is the lack of structures on the high-energy side (low flight time) of the main peak, which could otherwise have interfered with the determination of the beam-target component as explained in section 1. Integrating the spectrum after the kinematic cuts gives an efficiency of 1.25 · 10−3.
In addition to the response function shown in figure 4, d(n, 2n)p breakup reactions can also introduce a background component. In contrast to elastic scattering, where it is possible to define kinematic cuts with a 1:1 relationship between the flight time of the scattered neutron and the energy of the recoil nucleus, this is a three-body reaction, and there is a continuous spectrum of events where the flight time of one of the emitted neutrons is compatible with the energy of the recoil proton. Such reactions are not included in the MCNP model described above. Instead we have estimated the impact of this background using the methodology for three body reactions as described in chapter 47 in [16]. It was found that for incoming neutrons at 14 MeV the maximum energy of neutrons that are emitted in the backwards direction, i.e. towards the D2-detector, is about 0.9 MeV. This results in flight times longer than 100 ns. Therefore the background from d(n, 2n)p breakup reactions does not interference with the main response peak at 74 ns (figure 4). Instead the background is found on the low energy side of the spectrum, which is dominated by backscattered neutrons [17] of no relevance to the fuel ion ratio measurement. Further, if the emission of the reaction products are assumed to be isotropic in the center-of-mass reference frame, only about 0.1 percent of the total number of d(n, 2n)p reactions result in neutrons emitted towards the D2-detector. This makes this contribution from d(n, 2n)p reactions vanishingly small compared to that from backscattered neutrons.
3.2. Background at high count rates
The results from the second simulation, including random coincidences, are shown in figure 5. It was found that the saturation load on a single D1 detector (here assumed to be 2 MHz) was reached for a total area integrated neutron flux on the D1 assembly of 2.6 · 108 s−1. The 6.4 million events simulated are therefore equivalent to 25 ms data taking at maximum load.

Figure 5. Simulated random background at saturation load of D1-detectors without kinematic cuts (dashed red) and with kinematic cuts (dash-dot green). True coincidences are shown as solid blue.
Download figure:
Standard image High-resolution image
The simulated spectrum contains about 8'000 true coincidence events, which are shown in solid blue. Random coincidences without adaptive energy thresholds are shown in the dashed red line. The peak signal to background is about 3. The random coincidences after the adaptive thresholds have been applied are shown in dash-dot green. As can be seen, the energy cuts are very effective at reducing the background. On the low energy side (tof > 74 ns) the signal to background is improved by a factor of 50, and on the high-energy side (tof < 74 ns) the background is discriminated entirely except for a shoulder above tTOF = 70 ns.
4. Discussion and conclusions
The back scattering time of flight spectrometer presented in this paper is one of the high-resolution neutron spectrometer designs that aim to fulfil the ITER requirements for determining the fuel ion ratio in the core of a burning DT plasma. In order to perform this measurement the spectrometer must meet a number of strict performance requirements. In this paper we have shown that the design can meet the following requirements: it
- is compact enough to fit within the 1 m3 size constraint,
- can fulfill the requirement of 4% energy resolution,
- has a high enough efficiency to meet the required time resolution for performing fuel ion measurements at ITER,
- has a high enough count rate capability to (300 kHz), and
- has a signal to background in the response function of about 5 orders of magnitude on the high-energy side, where the important information lies (see figure 4).
We have also shown how adaptive kinematic thresholds can be used to improve both the response function of the spectrometer, and make it near Gaussian over about 3 to 4 orders of magnitude, as well as significantly reduce the background. This is a very important observation since the spectrum in burning plasma relevant conditions will have a rather small contribution from beam-target reactions at about 1% in relation to the thermonuclear contribution.