

Abstract
Objective. In a previous study we demonstrated continuous translation, orientation and one-dimensional grasping control of a prosthetic limb (seven degrees of freedom) by a human subject with tetraplegia using a brain−machine interface (BMI). The current study, in the same subject, immediately followed the previous work and expanded the scope of the control signal by also extracting hand-shape commands from the two 96-channel intracortical electrode arrays implanted in the subject's left motor cortex. Approach. Four new control signals, dictating prosthetic hand shape, replaced the one-dimensional grasping in the previous study, allowing the subject to control the prosthetic limb with ten degrees of freedom (three-dimensional (3D) translation, 3D orientation, four-dimensional hand shaping) simultaneously. Main results. Robust neural tuning to hand shaping was found, leading to ten-dimensional (10D) performance well above chance levels in all tests. Neural unit preferred directions were broadly distributed through the 10D space, with the majority of units significantly tuned to all ten dimensions, instead of being restricted to isolated domains (e.g. translation, orientation or hand shape). The addition of hand shaping emphasized object-interaction behavior. A fundamental component of BMIs is the calibration used to associate neural activity to intended movement. We found that the presence of an object during calibration enhanced successful shaping of the prosthetic hand as it closed around the object during grasping. Significance. Our results show that individual motor cortical neurons encode many parameters of movement, that object interaction is an important factor when extracting these signals, and that high-dimensional operation of prosthetic devices can be achieved with simple decoding algorithms. ClinicalTrials.gov Identifier: NCT01364480.
Export citation and abstract BibTeX RIS
1. Introduction
Spinal cord injury or disease prevents the brain's command signals from reaching muscles below the level of the injury. Brain−machine interfaces (BMIs) offer the possibility of bypassing the damaged tissue by decoding movement intention and controlling assistive devices such as computer cursors [1], and, more recently, robotic arms [2–4]. To accurately extract a subject's intention, it is important to calibrate the BMI properly [5], which may be difficult if the intention is covert. This issue becomes very important for object manipulation, during which the intended action on the object may not be explicit on an instant-by-instant timescale. The actor can choose a range of solutions, namely reach trajectories and hand configurations, to achieve an acceptable result. Similarly, the actor adapts to dynamics as an object is grasped or transported [6]. Real-world BMIs must account for these changes to maintain performance.
Our previous work using intracortical microelectrodes demonstrated that a BMI could provide seven-dimensional (7D) control (3D translation, 3D orientation and 1D grasp) of an anthropomorphic robotic arm and hand (Johns Hopkins University, Applied Physics Laboratory) [7] to a woman with tetraplegia [3]. While a single continuous grasp dimension allowed the participant to grasp and transport objects, adding the capacity for hand shaping in such a device would allow for a wider range of interactions, from gestures for communication, to more dexterous manipulation of objects, expanding the range of possible independently performed activities of daily living (ADLs). Dexterity, defined as the ability to coordinate finger movement to shape the hand and to move the fingers independently, is a prime feature of human behavior. Several groups working with both non-human primates and humans have investigated motor cortical tuning properties during imagined and overt movements of individual fingers [8–11] or muscles [12]. Others have investigated encoding schemes where hand shape is described with reduced dimensionality [13, 14].
For this study, a 4D hand shape basis set was chosen a priori as a compromise between increasing functional utility of the hand and maintaining a relatively low-dimensional control space to reduce calibration time. We investigated 10D control by adding four hand shapes to our previous six dimensions of endpoint translation and orientation. Since 10D control had never been investigated, it was unclear whether neural units would respond primarily to a single control domain (translation, orientation, hand shape), or simultaneously to all domains with true 10D preferred directions. In addition to quantifying high-dimensional neural tuning, we evaluated the participant's ability to control the robotic arm in ten dimensions and to perform functional tasks. The participant demonstrated the ability to control all ten dimensions in order to achieve targeted endpoint positions, orientations, and hand postures. However, her ability to manipulate objects was inconsistent. While the addition of hand shaping allowed for additional dexterity compared to a single grasp dimension, the effect of object manipulation on neural activity also became more pronounced, which motivated changes to our calibration paradigm. Specifically, we switched to a virtual reality environment for calibration, which allowed us to incorporate objects into the grasp and transport phases of movement. The subject's subsequent ability to interact with objects significantly improved and we were able to quantify her performance on clinical tests of upper limb function across multiple days. A follow-up experiment was conducted in order to formally compare the effect of using a virtual environment and virtual objects during calibration. In order to allow for within-day comparisons, a 7D BMI, which required less training time than the full 10D model, was determined using multiple calibration paradigms. Specifically, we compared BMI performance and function using (1) our traditional calibration paradigm based on observing the movement of a robotic arm in space, (2) a virtual training paradigm that allowed us to present virtual objects to the subject during training, and (3) a virtual training paradigm that did not use virtual objects.
2. Methods
2.1. Ethics
This study was conducted under an Investigational Device Exemption (IDE) granted by the US Food and Drug Administration and with approval from the Institutional Review Boards at the University of Pittsburgh and the Space and Naval Warfare Systems Center Pacific. This trial is registered on clinicaltrials.gov (http://clinicaltrials.gov/ct2/show/NCT01364480). No adverse events have been observed to date.
2.2. Participant
The subject was a 52-year old female with tetraplegia who was diagnosed with a variant of spinocerebellar degeneration without cerebellar involvement [15]. The subject had complete loss of upper limb motor control, scoring 0/5 on the manual muscle test [16]. Clinical examination revealed mild sensory deficits and some hypersensitivity. Informed consent was received verbally from the subject; her legal representative signed all consent documents.
Two 96-electrode microarrays (4 × 4 mm2 footprint, 1.5 mm shank length, Blackrock Microsystems, Salt Lake City, UT, USA) were implanted in the participant's left motor cortex on 10 February 2012. Brain mapping based on structural and functional MRI was used for stereotactic image guidance (Brainlab, Westchester, IL, USA) during array placement.
2.3. Neural recording
The subject used the BMI over a period of 280 calendar days (see table 1). The first 95 calendar days of experiments were performed in 7D and are reported in [3]. 10D experiments which were the focus of this study, were performed on days 119–236 post-implant, for a total of ten weeks. Testing sessions were typically held three times per week and lasted about 4 h. During sessions, threshold crossings were recorded using the NeuroPort data acquisition system (Blackrock Microsystems, Salt Lake City, UT) and firing rate, timing and spike snippets were saved. Neural firing rates were calculated for each 30 ms bin and processed to generate command signals for the MPL at 33 Hz. At the beginning of each test session, thresholds were set to −5.25 times the baseline root-mean-square (RMS) voltage on each of the 192 channels and then manually adjusted if necessary. Single units that showed large separation from others were isolated using time-amplitude windows which allowed for recording of more than one 'unit' per channel. Sorting single units can result in decoding errors if the waveforms changed shape slightly over 4 h of testing, as they would fall out of the defined time-amplitude window. For that reason, after day 135 we tended to use a less aggressive sorting approach, only isolating units that were easily distinguishable and windows could be set large enough to account for noise and slow variations. For testing sessions after day 135, less than ten units were distinguished from the thresholded activity across both arrays. Both single- and multi-unit activity were considered as 'units' for the decoding paradigm and the tuning analysis [17].
Table 1. Study timeline.
| Study phases | 7D from [3] | 10D Study | 10D Study | 7D Paradigm Comparison Study |
|---|---|---|---|---|
| Days post-implant | 32–95 | 119–189 | 192–236 | 266–280 |
| Number of sessions | 24 | 23 | 17 | 6 |
| Calibration paradigm(s) | 7D Sequence Task | 10D Sequence Task | 10D VR Object Task | 7D VR Object Task, 7D Sequence Task, 7D VR Sequence Task |
| Testing paradigms | 7D Sequence Task | 10D Sequence Task | 10D VR Object Task | 7D Sequence Task |
| Testing conditions | Computer assisted and full brain control | Computer assisted and full brain control | Computer assisted only | Full brain control only |
| Functional evaluations (full brain control) | ARAT | none | ARAT | Box and Blocks-like task |
ARAT: Action Research Arm Test.
2.4. Modular prosthetic limb (MPL) control
The MPL (Johns Hopkins University, Applied Physics Laboratory) [7] replicates many of the movements performed by the human arm and hand. When operated in endpoint-control mode, 16 degrees of freedom can be operated independently: 3D translation and 3D orientation of the hand, as well as 1D flexion/extension of each finger, ab/adduction of the index finger, combined ab/adduction of the little and ring fingers, and 4D control of the thumb. For this study, the robot's ten hand-based degrees of freedom were projected into a 4D 'hand shape' space. The four hand shape basis functions were: pinch, scoop, finger abduction, and thumb opposition (figure 1(A)). Pinch involves flexion of the thumb, index finger, and middle finger. Scoop involves flexion of the ring and pinky fingers. Finger abduction allowed for abduction of the index, ring, and little finger away from a neutral (adducted) posture. Thumb opposition allowed the participant to move between thumb opposition (against the palm) and extension (lateral position). 4D hand shape was combined with 6D endpoint velocity for a total of ten simultaneously controllable dimensions. All controlled dimensions were decoded as velocity signals that were sent directly to the MPL in velocity-space rather than positional space.

Figure 1. Experiment setup and equipment. (A) Four hand shape postures, clockwise from top left: finger abduction, scoop, thumb extension, and pinch (B) MPL experiment setup. The MPL is shown with a vertical board and nine LEDs that are used to indicate the translation target during testing. (C) A screenshot of the virtual testing environment used for the 10D VR Sequence Task. (D) Each movement phase for a sample 10D Sequence Task trial is shown. (See section 2.5 for a full description of movement phases). (E) Each movement phase for a sample 10D VR Object Task trial is shown. (F) Objects used in the Action Research Arm Test (ARAT).
Download figure:
Standard image High-resolution image2.5. Calibration procedures and paradigms
Throughout the study, a two step calibration method was used as previously described [3]. Briefly, in the first step, the computer controlled the MPL to automatically complete each trial while the subject observed and imagined performing it herself. This method elicited observation-driven neural activity [18–20] that was used to calculate the initial neural tuning functions (equation (1)). After approximately 10 min of data collection, a decoder was trained based on the smoothed (450 ms window) neural activity and computer-generated kinematics. An exponential window with 3 dB cutoff at approximately 1 Hz was used for smoothing to bias the neural activity towards the most recent samples. The 10D linear encoding model relating observed firing rates [21] to training-set kinematics is shown in equation (1).
where f is the square root transformed firing rate for a given unit, v is the velocity in the indicated dimension and b is the coefficient relating that velocity to the firing rate. The dimensions, in order, were translation (x,y,z), orientation (about each translational axis centered at a point 4 cm normal to the surface of the palm, θx,θy,θz), pinch (p), scoop (s), finger ab/adduction (f), and thumb opposition/extension (t). The four hand shape dimensions were chosen to maximize the usability of the robot while being easily explained to the subject and were not intended to mimic natural hand synergies [22]. The hand shape dimensions were continuous. No classification or discretization of these dimensions was performed. The B coefficient matrix was solved using indirect optimal linear estimation (OLE) [23] with variance correction [3] and ridge regression [24]. Only neural units with firing rates higher than one event/minute and that fit the encoding model with an R2 greater than a predefined threshold (0.001–0.005) were included in the decoder and subsequent analysis. The B matrix is then pseudo-inverted as described in [3, 23, 24] to find the decoding weights W. Decoding is then performed by multiplying the observed neural firing rates vector F by the weights matrix W resulting in a vector estimating the intended kinematics. The calibration and decoding procedure is further described in the appendix.
The decoder trained during observation was then used to complete the second step of calibration during which the participant performed the tasks under brain-control with assistance (ortho-impedance) which attenuated the brain-command component perpendicular to the ideal trajectory by 100%, essentially restricting the MPL to a movement path directly towards or away from the target [18]. Ortho-impedance was applied to the 10D control signal generated by the subject before being sent to the MPL. After 10–15 min of data collection for the ortho-impedance assisted calibration, a second decoder was trained using neural activity and the user-generated kinematics recorded during constrained brain control. This decoder was then used to complete all testing trials for a given session.
Two different 10D calibration paradigms, the 10D Sequence Task and 10D VR Object Task, were used in this study (videos 1, 2), as shown in the 10D section of table 1. The 10D Sequence Task used the physical MPL (figure 1(B)) and involved achieving specified endpoint positions, orientations, and hand shape configurations based on LED patterns or verbal commands. No physical targets were presented. The 10D VR Object Task used the virtual MPL and environment (figures 1(C) and (E)) and involved grasping and manipulating virtual objects. The virtual MPL was created using Unity 3D (Unity Technologies, San Francisco, CA) and viewed via a shutter-based 3D television. The virtual MPL used the same control system, inverse kinematics model, and dynamics as the physical MPL [25]. For a given input signal the motion of the virtual and physical MPL was nearly identical, making the virtual MPL a valuable tool for calibration. The same custom software was used to specify target locations, success criteria, and control settings for both the virtual and physical MPLs that were commanded in velocity-space and provided position and velocity feedback to our system. For both paradigms, a trial consisted of multiple phases during which the target for a subset of commanded dimensions was specified as described below. The subject had access to all ten dimensions at all times, however phases were used to segment each trial and within each of these segments the non-specified degrees of freedom had to be kept constant. Successful completion of the current phase was required before the target for the next phase was presented. If the subject exceeded the 10 s timeout on any phase the trial failed and the MPL returned to its starting position. In both paradigms, for all domains, the target for each phase was pseudo-randomized on a set-by-set basis. The possible targets for each control domain (translation, orientation, and hand shape) are described below. At the beginning of each set, a random permutation of numbers was generated by the computer and used to select the targets from a list for each movement phase independently.
2.5.1. 10D Sequence Task (figure 1(D), video 1)
Translate phase: an LED (or combination of LEDs) indicated the position target at the beginning of the Translate phase. The MPL hand was required to reach one of ten possible locations arranged in two vertical planes 35 and 52 cm in front of the shoulder [3].
Orient phase: computerized verbal prompts were used to provide the orientation target after successful completion of the Translate phase. The MPL hand was required to reach one of seven orientations: ±45° of pronation/supination, ±45° of wrist flexion/extension, ±20° of ulnar-radial deviation or 0° on all three axes. Orientation control was in extrinsic (yaw, pitch, roll) space measured as angular velocity about a point 4 cm off the center of the palm.
Hand phase: computerized verbal prompts instructed the subject to reach targets in one of the hand shape dimensions: pinch, scoop, finger abduction, and thumb opposition. The MPL had to move to a new target in one of these dimensions while holding the others constant. For example, in figure 1(D), the target specified thumb extension, while maintaining the pinch posture. Note that the subject had continuous velocity-based control over the hand shape basis functions. No classification or discretization of the space was performed.
2.5.2. 10D VR Object Task (figure 1(E), video 2)
Reach phase: at the start of the Reach phase, the position, orientation, and hand pre-shaping (finger ab/adduction or thumb opposition/extension) targets are cued simultaneously by the shape and location of a red object in the VR workspace. The shape of the object (capsular, cylindrical, ellipsoid) provided the cue for hand pre-shaping (thumb-extension/finger-adduction, thumb-opposition/finger-adduction, thumb-opposition/finger-adduction, respectively). Translation and orientation targets for the Reach and Carry phases were pseudo-randomly chosen from the same set of positions and orientations as in the 10D Sequence Task.
Grasp phase: during the Grasp phase a computerized verbal prompt instructed the participant to pinch, scoop, or grasp (combination of pinch and scoop) in order to grasp the object.
Carry phase: the virtual MPL was required to 'carry' the virtual object to a new position and orientation target signified by the location and orientation of a green plane in the VR workspace.
Release phase: the virtual MPL was required to reach the fully-open state in the pinch and scoop dimensions in order to release the virtual object.
2.6. Domain-specificity in encoding model
Neural and kinematic data collected during the observation phase of calibration over the 10D portion of the study were used to determine the domain-specificity of the encoding model (equation (1)). Observation data was used to get an initial daily estimate of neural tuning independent of the influence of closed-loop training with the neural decoder. Neural tuning was estimated daily using data from the entire observation training session, not single phases. Three control domains were considered: translation, orientation, and hand shape. The translation and orientation models included three independent variables (3D velocity), while the hand shape model included four independent variables (four hand shape dimensions). For this analysis, the p-value of the fit was used to determine significance, rather than use the R2 thresholds used during online experiments. Tuning was considered significant when the p-value of the regression model fit was less than 0.05.
2.7. BMI testing
BMI testing consisted of evaluations designed to test the subject's ability to control all ten degrees of freedom. The 10D Sequence and 10D VR Object Tasks used for calibration were also used to evaluate the subject's performance over time. As listed in table 1, during the first phase of 10D (control), BMI calibration and testing were completed with the 10D Sequence Task, while during the second phase of 10D control, the 10D VR Object Task was used for calibration and testing. During testing, the subject controlled all available dimensions simultaneously but was instructed to only modulate the appropriate dimensions for each phase, moving to the target while keeping unneeded dimensions constant. In order to pass each phase, the subject was required to achieve the instructed 10D target (specified endpoint position, orientation, and hand shape) within given error bounds in 10 s. Error bounds were set prior to the experiment at a level that we felt was reasonable given the abstract cues (LEDs and sound) used in the 10D Sequence Task, though minor adjustments were made over the course of the experiment. Investigators could also manually mark a phase as a success, for example if the subject over-rotated the hand in the desired direction. This same procedure was used previously [3] to minimize frustration. A trial was considered successful if all movement phases were achieved successfully. Generally, the subject had the most difficulty controlling finger ab/adduction that had a small range of motion (ROM) or she tended to over-rotate in the roll dimension which had a large range of motion. The final MPL position for each dimension fell within the following criteria for >90% of all successful trial phases (manually marked or auto-judged by the computer): <9 cm from the translation target, <28° from the orientation target, and <34% of the full ROM for hand shape. For hand shape, the ROM for each dimension was scaled from 0 to 100% with targets at both ends of this range.
In order to aid learning and to keep the subject engaged, two types of computer assistance, stabilization and ortho-impedance, were used as previously described [3]. When stabilization was set to 100% the non-targeted dimensions during the current phase were controlled by the computer. For example, during the 10D Sequence Task the computer would hold orientation constant during the translation phase and vice versa. A smaller percentage of stabilization resulted in a blending of the brain control command signal and the computer generated command signal for the non-targeted dimensions. In this case, the subject could still control all dimensions but in a subset of these dimensions a centering velocity returning the MPL to the target would be blended with the brain-control signal [3, 18]. Ortho-impedance restricted movements to the correct 10D trajectory, either directly toward or directly away from the target, but did not automatically move the MPL. The components of the command trajectory that were orthogonal to the ideal trajectory were reduced by a specified percentage that was varied by the experimenter. Note that these assistance values were calculated based on the 10D position and velocity vectors, not individually for each domain (translation, orientation, or hand shape). Ideal trajectories were defined as the 10D vector difference between the current position and the target position. Test sessions completed using computer assistance are identified in the results. No assistance of any kind was used during 'full brain control' trials. Table 1 specifies for each study phase whether testing was completed with some form of computer assistance, under full brain control, or both.
Success rate, completion rate, and path efficiency were computed as measures of BMI performance. Success rate was the percentage of trials with all phases completed successfully for a given block of trials (10–20 repetitions). Completion rate was computed as the number of trials completed per minute. Target presentation phases, during which the MPL was not allowed to move, were not included in this calculation. Path efficiency was calculated as the distance the hand traveled during the trial divided by the distance from starting point to end-point (equation (2)) [3]. Each domain was treated individually and then averaged. This value was then averaged over each set of trials and inverted to produce a metric between 0 (an infinitely inefficient path) and 1 (ideal path). Note that this metric was insensitive to speed or pauses, responding only to the efficiency of the path itself.
where Δdx is the change in dimension x over the course of a trial, vx is the instantaneous velocity in dimension x during the trial, t is time where t = 0 at the beginning of each trial, and N is the number of trials per set. Thus if the hand moved directly to the target with no deviations in any dimension, the path efficiency was one. In all other cases, the path efficiency was less than one.
Normalized performance metrics were computed in order to allow for comparisons between different test paradigms and to be able to include trials that incorporated some amount of computer assistance. In order to determine task difficulty, the chance level of successful completion was calculated for each task. This was done by creating a random walk command signal (velocity controlled by a normally distributed random variable in each dimension) that matched the actual command signal's average speed in each domain. For example, if the subject moved with a RMS orientation velocity of 0.2 rad/s on a given trial, the random walk over the three orientation dimensions would be scaled to have an RMS velocity of 0.2 rad/s as well. For trials that used computer assistance, the same assistance was added to the randomly generated command signal used in the actual trials. Each trial was simulated 200 times using this method to generate the chance level of success and the 95% confidence interval. The effective success thresholds in translation, orientation and hand shape used for the chance level estimation were based on the subject's distance from the target location in each domain at the time the trial was marked as a success (either by the computer or the experimenter). A performance metric was then generated by dividing the subject's success rate by the chance level (equation (3)). Path efficiency and completion rate were normalized by calculating the median path efficiency and completion rate using the computer-controlled MPL for each paradigm and then dividing the actual results by this value (equation (4)). Path efficiency for the computer-controlled MPL was less than one due to anatomic constraints and limitations of the inverse-kinematics model.


2.8. Functional evaluation
To test functional performance, the subject used the BMI-controlled MPL to complete nine subtasks from the Action Research Arm Test (ARAT) [26]. For 10D control, ARAT testing was only completed while calibration was performed with the 10D VR Object Task. Table 1 denotes the study periods during which the ARAT was completed and the subtasks are listed in figure 5 and table 3. The ARAT subtasks chosen were the same as in [3] since the other standard ARAT subtasks require some degree of compliance in the fingertips which was not possible with the robotic arm at the time. The ARAT has been used to quantitatively assess upper limb function and is indicative of the ability to perform ADLs [26]. The task was executed and scored as in [3]. Briefly, three attempts were permitted for each object during each session and the subject was informed that only the best trial would be included which allowed her to explore different strategies. Each attempt generated both a score on a 0–3 scale, and a completion time. The completion time was measured on a stopwatch by an experimenter. The best score of the three attempts is reported. The definition of each score is as follows:
- 0. Unable to attempt the trial.
- 1. Touched object, but could not complete trial.
- 2. Completed trial abnormally or with time longer than 5 s.
- 3. Normal performance.
2.9. Assessing the effect of object interaction and VR
It was observed that the subject often had difficulty interacting with physical objects, regardless of the performance on non-object tasks such as the 10D Sequence Task. In fact, when the neural decoder was trained during the 10D Sequence Task, performance on object-based tasks was inconsistent enough that we did not formally attempt the functional evaluation with the ARAT. We hypothesized that altering the training paradigm to include objects might improve her ability to interact with objects. This motivated the switch to the 10D VR Object Task on day 189 post-implant, which allowed us to easily present virtual objects in various positions and orientations. During this second phase of 10D control, both calibration and BMI performance testing were done in the virtual environment using the 10D VR Object Task, however the primary focus was on the functional evaluation using the ARAT with the physical MPL since her ability to interact with objects was significantly improved. We attributed this improvement in performance to the change in calibration paradigm, although we could not rule out the possibility that she simply became more proficient with the BMI over time.
As a follow-up study conducted on days 266–280 post-implant, we attempted to quantify the effect of using VR and incorporating objects into the training paradigm. BMI performance was assessed for three distinct calibration paradigms described below: (1) calibration with the MPL without objects (7D Sequence Task), (2) VR calibration without objects (7D VR Sequence Task), and (3) VR calibration with virtual objects (7D VR Object Task). These comparisons were made using 7D control (3D translation, 3D orientation, 1D grasp) since it required less training time than 10D allowing multiple calibration paradigms to be investigated and compared in each experimental session. Calibration was performed with two steps (observation and ortho-impedance) as described in section 2.5.
2.9.1. 7D Sequence Task (supplemental video 3)
Translate phase: An LED (or combination of LEDs) indicated the position target at the beginning of the Translate phase. The MPL hand was required to reach one of ten possible locations arranged in two vertical planes 35 and 52 cm in front of the shoulder [3].
Orient phase: Computerized verbal prompts were used to provide the orientation target after successful completion of the Translate phase. The MPL hand was required to reach one of seven orientations: ±45° of pronation/supination, ±45° of wrist flexion/extension, ±20° of ulnar-radial deviation or 0° on all three axes.
Hand phase: Computerized verbal prompts instructed the subject to grasp or open the hand (simultaneous flexion/extension of all fingers and thumb).
2.9.2. 7D VR Sequence Task (supplemental video 4, figure 1(C)):
The 7D VR Sequence Task is the same as the 7D Sequence task reproduced in the VR environment.
2.9.3. 7D VR Object Task (supplemental video 5)
Reach phase: The virtual MPL hand was required to reach one of ten possible locations arranged in two vertical planes 35 and 52 cm in front of the shoulder [3] cued by the appearance of a virtual object.
Orient phase: Once the MPL was at the correct position, the virtual object rotated to specify a new orientation target selected from the following set: ±45° of pronation/supination, ±45° of wrist flexion/extension, ±20° of ulnar-radial deviation or 0° on all three axes. Orientation control was in extrinsic (yaw, pitch, roll) space measured as angular velocity about a point 4 cm off the center of the palm.
Grasp phase: The virtual MPL had to reach the fully closed state in the grasp dimension. Note that grasp velocity was a 1D continuous measure that was integrated to control grasp position, not a discrete mode switch.
Carry phase: The virtual MPL had to carry (translate) the now-grasped object to a new position. This position was randomly selected from the same set as in the original translation phase.
Reorient phase: The virtual MPL had to rotate the object into a new orientation randomly selected from the same set as the original Orientation phase.
Release phase: The virtual MPL had to reach the fully open state in the grasp dimension.
Two of the three calibration paradigms were determined each day, over six total testing days for a total of four sessions with each. The order of training was pseudo-randomized, and all combinations were tested. BMI performance was assessed for the two neural decoders each day using success rate on the 7D Sequence Task. Functional performance testing for two decoders in the same day required a faster task than the ARAT. A simplified 'Box and Blocks' [27]-like task was used during these 7D decoder comparison experiments (video 6). During this task, the subject was instructed to pick up a 7.5 cm cube from the left half of a 90 × 60 cm table top, move it over a 12 cm high barrier, and set it down on the right half of the table. This task was performed on a table located about 40 cm below the shoulder. The initial position of the cube was 20 cm left of the barrier. After each successful release, the experimenter replaced the block at the starting position. Each trial lasted 2 min during which the number of successful transfers was recorded. The average number of transfers per minute and the 7D Sequence Task success rate achieved with each decoder were each compared using an ANOVA with post-hoc pairwise comparisons where appropriate.
3. Results
3.1. Neural recordings
Figure 2(A) presents the number of units recorded each day. The number of units increased steadily until we switched to the conservative method of sorting discussed in section 2.3 on day 135. After this point the number of units was relatively stable. The conservative approach to sorting reduced variability in the recorded signals by making the analysis more tolerant to the smaller delineations between units caused by lower spike amplitudes (shown in figure 2(B)). Conservative sorting resulted in a higher ratio of multi-unit activity to single-unit activity, but more stability over the testing period. Figure 2(B) shows the median peak-to-peak voltage of the largest unit on each electrode. Between days 60 and 200 post-implant, the median spike amplitude decreased from 75 μV to 50 μV and then remained fairly constant. Figure 2(C) shows the number of units whose firing rates were significantly predicted by the encoding model (equation (1), 7D or 10D), defined as having a predicted R2 > 0.005. The distribution of predicted R2 values for those units, grouped by study period, is shown in figure 2(D). The first 7D period represents data already presented [3]. The second 7D period includes data from the secondary investigation of the effect of VR or including objects in the calibration paradigm (see table 1). Predicted R2, computed with ten fold cross validation, was used in order to allow for more direct comparison of unit tuning for across study periods that had different numbers of independent variables (seven or ten) in the encoding model. The number of tuned units declined in the second half of the study using this fairly liberal criteria (predicted R2 > 0.005) that includes units whose firing rate variance is only weakly captured by the encoding model. The distribution of R2 values for the tuned units, however, remained fairly constant (figure 2(D)).

Figure 2. Neural signal characteristics over the study period. (A) Number of manually online sorted units on each day of testing. Grey dots denote data previously presented in [3]. (B) Median spike amplitude showing an increasing trend over the first two weeks and then a slow decline towards stability at about 50 μVpp. The shaded region represents the spike amplitude inter-quartile range. (C) Number of units tuned to the kinematic encoding model, defined as having a predicted R2 > 0.005. Although variable, the number of well-tuned units appeared to steadily decrease beginning around day 150. (D) Distribution of encoding model fits (R2 for each unit) over different phases of the study. The black lines denote the 95% confidence intervals, and the shaded areas the interquartile range, while the horizontal black lines mark the medians.
Download figure:
Standard image High-resolution image3.2. Presence of hand shape tuning
Clear single/multi-unit tuning to hand shape was observed. Units had preferred directions that spanned the 4D hand shape space. Figures 3(A) and (B) provide examples of these preferred directions for a given recording session in a 2D subspace, calculated using linear regression (equation (1)) on observation-related neural data for each individual unit collected during the Hand phase of the 10D Sequence Task calibration. Figures 3(C)–(J) shows spike rasters for single units responding to positive and negative targets along the basis vectors of the hand shape space from this single day's data. Figure 3 is representative of neural activity recorded on any given day.
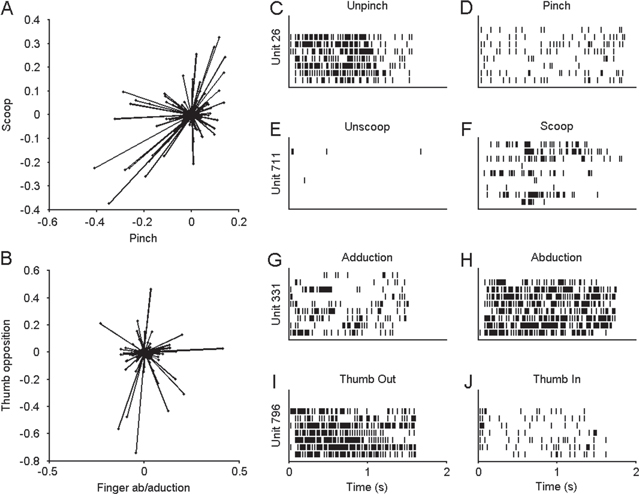
Figure 3. Neural tuning to hand shape in primary motor cortex. Data shown in this figure was based on 64 trials of observation activity collected during the 10D Sequence Task on day 179 post-implant. (A) Projection onto the Scoop-Pinch plane of preferred directions in 4D hand shape space. Each line represents a unit with the length indicating modulation depth. (B) Projection onto the thumb opposition−finger Ab/adduction plane of preferred directions in 4D hand shape space. A and B show that units had preferred directions that sampled the hand shape space although the depth of modulation of these units was variable. (C)–(J) Raster plots for single units showing response to positive and negative velocities along each dimension of hand shape space. Each row represents a single observation trial, where the command to move is given at t = 0. Each vertical line represents a single action potential from the unit listed on the Y-axis.
Download figure:
Standard image High-resolution image3.3. Domain-specificity in encoding model
Neural and kinematic data collected during the observation phase of calibration over the 10D portion of the study was used to determine the domain-specificity of the encoding model. As summarized in figure 4 of the 7255 single and multi-units recorded over the study, 22.1% showed significant tuning to at least one domain. 96.2% of units that showed significant (p < 0.05) tuning in one domain also showed significant tuning in another. 80.4% of units that showed significant tuning to at least one domain were significantly modulated to all three domains. For reference, this distribution remained stable after the calibration paradigm was changed to the VR environment. 79.9% and 80.2% of units showed significant tuning to all three domains for data collected during calibration with the 10D Sequence Task and 10D VR Object Task respectively.
3.4. 10D BMI control performance
Success rate, normalized performance, path efficiency, and normalized trial completion rates were computed as measures of BMI performance as shown in figure 5. All 10D BMI control data were included for sessions that were tested with the 10D Sequence Task and 10D VR Object Task. We have also reproduced previously reported 7D data collected prior to day 98 post-implant for comparison [3]. Full brain-control testing was not performed for the 10D VR Object Task since the subject reported difficulty operating the virtual MPL because of limited depth perception even with the 3D display and difficulty visualizing small changes in hand posture, particularly ab/adduction. Also, during this phase of the study, the focus was on functional use of the MPL, measured primarily with the ARAT that comprised most of the session testing time. Computer assistance, either stabilization or ortho-impedance, was used during testing with the 10D VR Object Task to maintain success rates in a range that kept the participant motivated (see table 1).
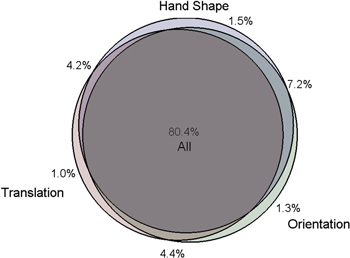
Figure 4. Venn diagram of the percentage of units significantly tuned to each domain or combination of domains over the 10D study duration. Most of the units (80.4%) recorded during this study have been significantly (p < 0.05) tuned to all three domains.
Download figure:
Standard image High-resolution imageSuccess rate on the BMI testing tasks, shown in figure 5(A), varied considerably over the course of the study ranging from approximately 60–100%. During the previously reported 7D BMI experiments [3], a median success rate of 85.0% [IQR 80.0–90.0] was achieved on full brain-control trials (filled markers, no computer assist). A lower, but still well above chance, median success rate of 70.0% [IQR 62.5–75.0] was achieved during the first segment (up to day 189) of 10D full brain-control when the physical MPL was used for calibration. During this same 10D testing period, the normalized performance metric was often higher than for 7D control although it was more variable with a median of 14.09 [IQR 9.8–555.5] during 10D control versus 9.0 [IQR 5.3–18.8] during 7D control. The performance metric accounted for the increased difficulty of the 10D task captured by the chance level estimate. Combining all of the full brain control data showed that the subject's performance increased exponentially (linearly on the semi-log scale with p = 0.002) as she learned to use the BMI first in 7D and then in 10D (figure 5(B)). Normalizing to chance level allowed us to include trials that were not collected under full brain control (where stabilization or ortho-impedance assistance was used) in our assessment of BMI proficiency (open markers). Therefore, success rates and normalized performance metrics were shown for the 10D VR Object Task as well. Since various levels of computer assistance were used for this testing, the chance levels were higher causing the resulting performance metric (ratio of success rate to chance level) to be lower.
Path efficiency and completion rates are charted over the entire experiment in figures 5(C)–(E), with each point normalized to the ideal command signal. The ideal command velocity calculated under computer control always pointed directly toward the target with a magnitude proportional to the distance to the target. Limits were placed on maximum velocity and acceleration so that the start and end of each movement was smooth. This ideal command signal was calculated for each trial collected over the course of the study, and the median value for all trials of a given paradigm was used for normalization. Variability under computer control arose due to the inverse kinematics and dynamics generated to achieve the pseudo-randomized target positions. Normalization allowed for comparison between tasks that would otherwise not be possible. Since the median value was used for normalization, it was possible for normalized path efficiency or completion rate to be greater than one. Translational path efficiency was relatively constant for full brain control trials with a median of 0.54 [IQR 0.49–0.59] in 7D [3] and 0.55 [IQR 0.49–0.60] 10D control as evaluated by the 10D Sequence Task. For all BMI tasks, the raw (un-normalized) performance metrics, including orientation and hand shape path efficiency, for full computer-control and full brain-control are shown in table 2. Orientation and hand shape efficiencies are lower than translation efficiency even under full computer control due to the smaller ROM and greater sensitivity to small movements in an untargeted dimension (which could occur due to the inverse kinematics of the MPL) or sensor noise. Normalizing the brain-control data to the computer-control data reduced the impact of inefficiencies not related to BMI performance. As a result of this normalization, the translation, orientation, and hand shape domains contribute equally to overall path efficiency (7 or 10D).
Table 2. Median and IQR of performance metrics for each BMI testing task: Subject performance (full brain-control) compared to automatic control of the modular prosthetic limb (full computer-control). Variability under full computer control was due to the randomized sequence of targets used coupled with the dynamics and inverse kinematic performance of the MPL.
| Full brain-control (no assistance) | Full computer-control | |||||||||||
|---|---|---|---|---|---|---|---|---|---|---|---|---|
| Path efficiency | Path efficiency | |||||||||||
| Paradigm | Success rate (%) | Performance | Completion rate (trials/min) | Translation | Orientation | Hand shape | 7 or 10D | Completion rate (trials/min) | Translation | Orientation | Hand shape | 7 or 10D |
| 7D Sequence task [3] | 85.0 [80.0–90.0] | 9.00 [5.33–18.75] | 9.27 [8.37–10.54] | 0.54 [0.49–0.59] | 0.35 [0.29–0.39] | 0.22 [0.14–0.29] | 0.36 [0.33–0.41] | 23.9 [21.8–25.9] | 0.89 [0.84–0.92] | 0.39 [0.32–0.46] | 0.57 [0.38–0.98] | 0.61 [0.56–0.71] |
| 10D Sequence task | 70.0 [62.5–75.0] | 14.09 [9.77–555.47] | 5.37 [4.99–5.91] | 0.55 [0.49–0.60] | 0.42 [0.36–0.47] | 0.26 [0.18–0.31] | 0.40 [0.36–0.45] | 16.8 [15.1–18.0] | 0.83 [0.74–0.91] | 0.70 [0.63–0.77] | 0.41 [0.32–0.53] | 0.61 [0.58–0.72] |
| 10D VR Object Taska | — | — | — | — | — | — | — | 7.6 [7.2–7.8] | 0.97 [0.96–0.98] | 0.90 [0.89–0.92] | 0.58 [0.57–0.59] | 0.81 [0.80–0.83] |
aFull brain-control trials were not attempted for the 10D VR Object Task due to time constraints and a focus on performance with the physical MPL. Computer-controlled values are shown for reference.
ARAT scores from 11 days of 10D BMI testing using neural decoders trained with the 10D VR Object Task are shown in table 3. Task 7 'Pour water from glass to glass' was never fully completed during a scored session. We have included it in the results because it was attempted each day and was included in the total possible score. Anecdotally, the subject did successfully complete the task twice during unstructured practice sessions. Figure 6(A) illustrates the number of days in which each object (task) was successfully completed. As previously stated, the subject's ability to interact with objects was inconsistent and frustrating for the subject during the portion of the study that used the 10D Sequence Task for training. Thus no ARAT testing was performed until calibration with the 10D VR Object Task started on day 192 post-implant. While using the 10D BMI trained with the 10D VR Object Task, the subject achieved an average score of 15.5 (range 12–17) out of a possible 27 on the modified ARAT. This was not significantly different from previously reported performance [3] with 7D control on days 80–98 post-implant (average score = 16, range 15–17), as shown in figure 6(B). Similarly, the average movement time per item on the test was 23 s (SD 11) in 10D which was not significantly different (ranksum p > 0.1) from the original 7D testing, 17 s (SD 5).
Table 3. ARAT completion times and scores.
| ARAT completion time during 10D control (s) | |||||||||||
|---|---|---|---|---|---|---|---|---|---|---|---|
| Object | Day 196 | Day 199 | Day 200 | Day 203 | Day 207 | Day 210 | Day 217 | Day 220 | Day 221 | Day 228 | Day 229 |
| 1. Block, 10 cm cube | 43.3 | 15.9 | 25.7 | 8.5 | 16.0 | 14.0 | 33.1 | 102.0 | 22.0 | 9.0 | 42.7 |
| 2. Block, 2.5 cm cube | 12.6 | 13.3 | 13.1 | — | 13.2 | 43.6 | — | 70.0 | — | 56.5 | — |
| 3. Block, 5 cm cube | 26.5 | 100.0 | 17.2 | 7.3 | 14.5 | 6.5 | 10.1 | 74.0 | 10.4 | 17.0 | 14.2 |
| 4. Block, 7.5 cm cube | 40.7 | 12.6 | 10.5 | 7.0 | 11.6 | 5.8 | 14.0 | 12.0 | 7.0 | 10.4 | 41.9 |
| 5. Ball, 7.5 cm diameter | 20.7 | 23.5 | 13.1 | 10.0 | — | 6.2 | — | — | 7.1 | 8.0 | — |
| 6. Stone, 10 cm × 2.5 cm × 1 cm | 58.0 | 16.2 | 10.3 | 9.5 | 22.7 | 24.1 | — | 19.6 | 9.6 | 7.2 | 19.6 |
| 7. Pour water from glass to glassa | — | — | — | — | — | — | — | — | — | — | — |
| 8. Tube, 2.5 cm × 16 cm | — | 16.6 | 18.7 | 7.3 | 12.6 | 75.0 | — | 11.9 | 48.3 | 8.2 | 10.7 |
| 9. Tube, 1 cm × 16 cm | 23.8 | 20.2 | 13.5 | — | 8.2 | — | — | — | 61.0 | — | — |
| Average time/Item (s) | 32.2 | 27.3 | 15.3 | 8.3 | 14.1 | 25.0 | 19.1 | 48.3 | 23.6 | 16.6 | 25.8 |
| Total ARAT score | 16 | 17 | 17 | 15 | 16 | 16 | 12 | 15 | 16 | 16 | 14 |
aTask 7 'Pour water from glass to glass' was never fully completed during a scored session, but was attempted each day.
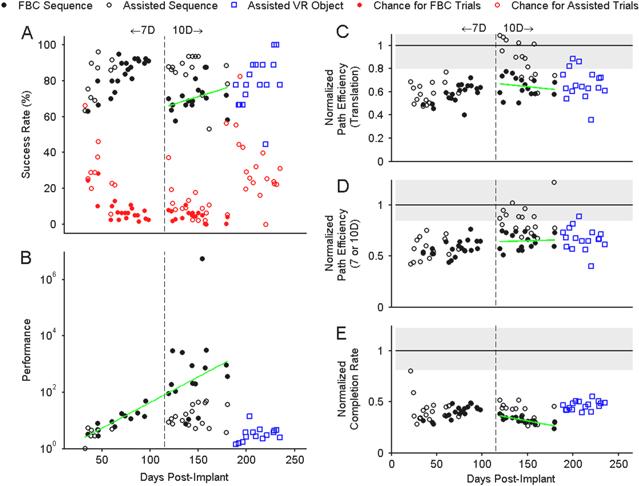
Figure 5. Sequence and VR Object Task performance over the study with previously reported 7D data [3] shown to the left of the dashed vertical line and 10D data shown to the right. Gaps indicate days when no 7D or 10D testing was performed. Filled markers represent full brain control (FBC) data, while empty markers indicate some level of stabilization or ortho-impedance. The green lines represent linear regression fits. Only performance and completion rate had slopes fits that were significantly (p < 0.05) different from zero. (A) Success rate and median chance level (red) for each day of testing data over the study. Red circles represent the overall chance level for each day. (B) Normalized performance metric, defined as the ratio of user success rate to median chance level. (C) Path efficiency for 3D translation only. In C−E all results were normalized to the median value for each task under automatic control by the computer with the interquartile range (IQR) shaded in grey. (D) Path efficiency averaged over all three domains. (E) Normalized completion rate, where the un-normalized value is expressed as number of trials per minute.
Download figure:
Standard image High-resolution image3.5. Effect of calibration paradigm
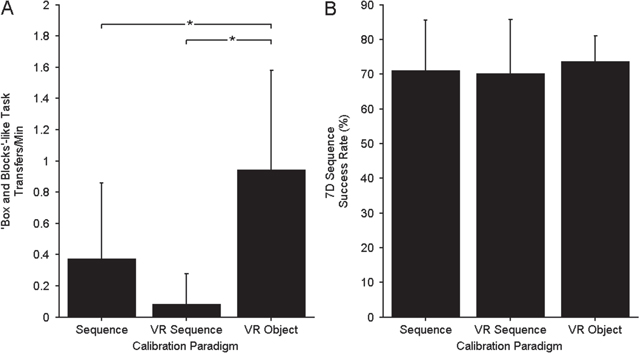
During early 10D control the subject often had difficulty interacting with physical objects, even when performance on the 10D Sequence Task was very good. It was hypothesized that context-sensitive factors associated with object manipulation were interacting with the kinematic decoding model, rendering the model ineffective when the object was to be grasped. As such, after day 189 post-implant, we switched to a VR environment that allowed for interaction with virtual objects during training. Almost immediately this improved the participant's ability to interact with physical objects, allowing for consistent ARAT scores during the second half of 10D testing (table 3, figure 6). In a secondary experiment, three calibration paradigms were investigated over six testing sessions (two decoders per session, pseudo-randomized) using 7D control to objectively quantify the effect of including objects and using the VR environment for calibration: the 7D Sequence Task, the 7D VR Sequence Task, and the 7D VR Object Task. The subject's BMI performance using the different decoders was quantified using the 7D Sequence Task (eight blocks per decoder each consisting of 20 trials collected across four days) and a Box and Blocks-like task as summarized in figure 7. The subject's performance on the functional Box and Blocks-like test was significantly better when using a decoder calibrated with the 7D VR Object Task compared to 7D Sequence Task (rank sum p = 0.035) or 7D VR Sequence Task (rank sum p = 0.0008) calibration paradigms (figure 7(A)). However, on the 7D Sequence Task, a task that did not include objects, the subject performed equally well using the decoders from the three different calibration paradigms (figure 7(B)). All results shown in figure 7 were collected while the BMI was under full brain-control (no computer assistance).
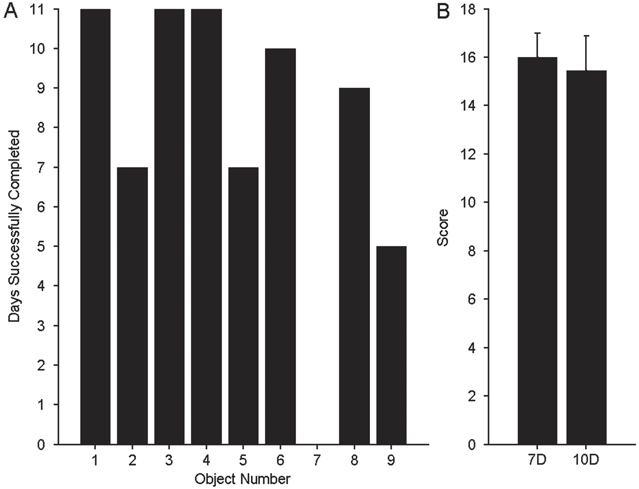
Figure 6. Summary of physical-object ARAT results. (A) Count of the number of 10D ARAT sessions during which the subject successfully completed each object (task), out of a total of 11 possible sessions. The object numbers refer to the order listed in table 3 where Object 1 is the 10 cm cube. Task #7 (pouring water from glass to glass) was attempted, but never fully completed during a scored session. (B) Comparison of mean ARAT score between 7D (n = 7 sessions) [3] and 10D (n = 11 sessions) BMI control. The vertical lines represent one standard deviation.
Download figure:
Standard image High-resolution image4. Discussion
This study demonstrates 10D BMI control of a robotic anthropomorphic arm by a subject with chronic tetraplegia. Examined over the full study period, the larger number of degrees of freedom available increased the median performance on full brain control BMI testing tasks relative to chance levels approximately 1.5 times compared to the 7D control from [3]. An initial increase in success rate of 10D trials completed under full brain control was observed, similar to our original 7D training [3]. When success rate was corrected for task difficulty, as in figure 5(B), we saw that performance increased exponentially (linearly on the semi-log scale, p = 0.002) from the beginning of the study until the VR experiments began, showing that learning took place consistently over a long period of time. Performing the task in VR was comparatively difficult and required greater computer-assistance to maintain a reasonable success rate and is probably why the consistent long-term performance increase was no longer apparent at this point in the study. The fact that performance increased during the transition from 7D to 10D despite the larger number of controllable dimensions and the novelty of the hand shaping dimensions is somewhat surprising. This suggests that the learning identified in [3] was transferred to the higher dimensional space, resulting in a similar level of BMI proficiency. Perhaps the subject's learning was accelerated because six of the control dimensions (translation and orientation) remained the same throughout the experiment. As discussed below, BMI proficiency on the 10D Sequence Task, however, was not initially sufficient to achieve reliable performance on tasks that required object manipulation. By changing the calibration paradigm, the subject was able to demonstrate consistent performance on clinical evaluations involving object transport.
The overall number of units and mean peak-to-peak amplitude decreased over time (figure 2), so the fact that we saw consistent or improving performance despite this drop in signal level suggests that the population was working more efficiently. This could happen in a number of ways, including a redistribution of preferred directions, conscious re-aiming by the subject to account for common mistakes, and improved unit tuning [5]. Figure 2 also shows a significant drop-off in the number of units once we switched to a more conservative sorting protocol on day 135 post-implant, which did not seem to affect BMI performance as shown in figure 5. Anecdotally, our within-session stability was substantially increased by switching to a more conservative sorting protocol. While this result was not rigorously tested, it is in keeping with others who have argued that aggressive sorting may not be ideal in BMIs [17].
Robust tuning to hand shape velocity (as linear combinations of joints) was observed in primary motor cortex. This is consistent with several other studies which have identified finger-based tuning [9–11], and hand shape-based tuning [13, 14]. We further demonstrated that the preferred directions of the recorded motor cortical units in 10D space were not significantly segregated into translation-only, orientation-only or hand shape-only groups. This result implies that within the context of higher dimensional control, units are not modulated by a single dimension or domain, and so training paradigms must be designed to accurately estimate preferred directions within a larger n-dimensional space. While we were able to identify neural units with strong responses to positive or negative velocities in one dimension of the hand shape space, as a general rule neural units weakly encoded multiple movement-related parameters. This is summarized in figure 4 with more than three-quarters of the neural population showing significant tuning to all three control domains. Population decoding can be used to accurately extract weak, but consistent contributions from a recorded sample of units.
Figure 7. Comparison of BMI performance using three calibration paradigms: 7D Sequence Task, 7D VR Sequence Task, and 7D VR Object Task. Bars represent mean values while lines show one standard deviation above the mean. (A) Transfers per minute for 'Box and Blocks'-like functional test. * indicates a significant difference (p < 0.05) between calibration paradigms. (B) Success rate on 7D Sequence Task.
Download figure:
Standard image High-resolution image
While this investigation was limited to a single human subject, our results are comparable to lower dimensional studies of neural tuning and robotic arm BMI performance in non-human primates [5, 18] in that firing rate predicted velocity-related information. Further, we demonstrated consistent and at times improved, performance over nearly one year of testing. The hand shape basis functions used here, were chosen based on the recommendation of an occupational therapist and constraints of the robotic hand even though other movement primitives [13, 14, 22, 28, 29] may have provided a more natural basis for control. The fact that our primitives showed robust neural correlates (figure 3) suggests that even a sub-optimal choice of control parameters may be useful in achieving high-performance BMI outcomes.
Our primary goal was to demonstrate proficient BMI performance on functional tasks. While the subject showed good 10D performance on the 10D Sequence Task, this did not translate to consistent performance during object manipulation. Once the 10D VR Object Task calibration paradigm was implemented, the subject demonstrated an ability to grasp and transport objects with the physical MPL which enabled ARAT testing across multiple days. ARAT 10D performance was fairly constant and similar to that observed during the initial 7D period, showing that the subject was able to maintain a high level of performance while controlling a more complex system. Some of the performance limits we observed were likely linked to our experimental design. A subset of ARAT tasks (9 of 19 tasks) was chosen that could be performed using both seven- and ten-dimensional control. The subject's 7D performance in [3] was very good, suggesting she may have reached a performance ceiling effect for these particular tasks. The more difficult fine motor tasks of the ARAT, such as grasping a marble, were not included. Obviously these tasks require very precise placement of the MPL hand. With conventional robotic devices, the effector must be precisely positioned with respect to the object as they interact, even for larger objects. Any mismatch imparts forces which will damage the robot or the object and/or displace the target object. This accuracy constraint can be relieved by a compliant effector or a soft object. For instance, we adjust the compliance of our own fingers to compensate for unknown weight distributions of objects or to match the softness of the object [30, 31]. The MPL hand has limited compliance and this may have contributed to the overall difficulty our subject experienced when grasping and moving physical objects, or limited the way that she was able to grasp the objects. This was perhaps most notable when she tried to pick up a cup and pour it into another container. Controllable compliance is an active area of robotics [32]. Despite limitations, the subject was able to establish novel strategies to simplify these tasks. For instance, she learned to 'scoop' the 2.5 cm cube with the pinky finger during 7D control by curling it around the cube as the whole hand closed. She generally maintained this strategy, instead of pinching the cube between the thumb and fingers when this capability was added in 10D control. We noticed that while the subject was proficient with the additional hand shape control available in 10D (as judged by performance on the 10D VR Object task) allowing more varied grasp strategies on some objects, the subject seemed to prefer using her 7D strategies during the 10D trials. Since all ten dimensions were being controlled simultaneously in these later trials, the subject was often regulating the extra dimensions to make the hand operate as if it was controlled with a single command signal, conforming to her previous strategies. This suggests that the selection of these strategies was learned from previous experience.
Interaction with physical objects is relatively new in the BMI field, though several studies have demonstrated this with some success [2, 3, 12, 18] most of which operated in a lower dimensional (<4 DOF) space. The object sets were typically limited to those included during the calibration procedures, which was not the case in our study. Although it was important to perform the calibration with objects, once the tuning functions were established, a variety of novel objects could then be grasped. When the tuning functions were established in the absence of objects, the subject had subsequent difficulty completing the physical grasp in the testing phase of the trial. This typically manifested as a repelling velocity away from the object, pushing through the object as a grasp was attempted, and the inability to initiate or maintain a grasp when an object was present, demonstrated in video 7. This was observed occasionally during the 7D control portion of the study reported in [3] but seemed to be remedied by consistent practice with objects after the BMI calibration phase. The object interaction problem was more pronounced in the 10D trials. For example, we often found that the prosthetic hand and target object behaved as if there was a repelling force field between them: if an object was moved toward the hand, the hand would back away, despite the subject's stated intention to grasp the object. When the subject closed her eyes she was able to close the hand on the object. Subsequently, successful 10D ARAT testing took place after using a VR calibration paradigm with virtual objects, demonstrated in video 8. This showed that inclusion of objects in the calibration procedure was a critical factor in achieving satisfactory 10D prosthetic performance and was further confirmed by within-day 7D testing. Adapting our calibration paradigm to include virtual objects significantly improved her performance on the functional 'Box and Blocks'-style object interaction task (ranksum p = 0.035) without decreasing performance on the 7D Sequence Task. Importantly, we saw this benefit even though the objects used during calibration (virtual cylinders, spheres, and capsules) were different from the physical objects manipulated during testing (e.g. blocks during the 'Box and Blocks'-style task) in size, shape, color and weight. We chose to use VR because it allowed us to easily present objects of various shapes at many locations and orientations without the need for a robotic target presentation system as has been used previously [18]. We are encouraged that calibration using VR translates to functional performance with the physical MPL as this is something that can be implemented in a person's home since it just requires a 3D TV. Future studies that plan to use force-control may need to incorporate weighted objects and realistic dynamics into the calibration paradigm. In our case, using velocity-control, weight compensation was handled by the internal controller of the physical MPL.
Although we did not pursue this issue explicitly, our results suggest that seeing an object elicits a component or factor that interacts with our kinematic model, acting as a modifier to the control signal. By including objects in the calibration, the resulting coefficient estimation, at least partially 'accounted for' this unknown factor. Such factors may be related to a coordinate system shift (e.g. to an object-centered frame), a perceived increase in accuracy constraints, the introduction of object-related force and expectations of tactile feedback. The BMI paradigm, with explicit control models, anthropomorphic actuators, large-scale single unit recording and an engaged human subject makes it possible to design experiments that can address these and many other speculative control factors. Tool use, object identity and intended action are prominent aspects of grasping and finger movement. Engineering approaches mixed with neurophysiology and psychophysics can lead both to revolutionary therapies and to exciting advances in understanding the basic brain processes that govern the complex interactions we have with our surroundings.
5. Conclusions
This study demonstrates, for the first time, BMI control of an anthropomorphic prosthetic arm that includes continuous control of multiple dimensions of hand shape. This success was based on the observation that context affects performance, specifically the presence of physical objects as targets, and we found it important to include these in the calibration paradigm. The results generated with this subject greatly extend the sophistication of previous BMI demonstrations and show that highly coordinated, natural arm and hand movement can be restored to people with upper limb paralysis.
Acknowledgments
This study is funded by the Defense Advanced Research Projects Agency's (Arlington, VA, USA) Revolutionizing Prosthetics program (contract number N66001-10-C-4056), Office of Research and Development, Rehabilitation Research and Development Service, Department of Veterans Affairs (Washington DC, USA, grant numbers B6789C, B7143R, and RX720), and UPMC Rehabilitation Institute (Pittsburgh, PA, USA). This study was done under an investigational device exemption granted by the US Food and Drug Administration. We thank Jan Scheuermann for her extraordinary commitment and effort in relation to this study and insightful discussions with the study team; Karina Palko for her participation as an honorary research team member and support of the study; Elizabeth Skidmore (Occupational Therapy) for discussions regarding functional grasp postures; Elke Brown (Physical Medicine and Rehabilitation) for assistance with BMI testing sessions; Debbie Harrington (Physical Medicine and Rehabilitation) for regulatory management of the study; Steven Chase for helpful discussions regarding statistical analysis; the University of Pittsburgh Clinical and Translational Science Institute and the Office of Investigator-Sponsored Investigational New Drugs and Investigational Device Exemption support for assistance with protocol development and regulatory reporting and compliance; the volunteer members of the DSMB for their continued monitoring of this study; the Johns Hopkins University Applied Physics Laboratory (Laurel, MD, USA) and Blackrock Microsystems (Salt Lake City, UT, USA) for coordination efforts and technical support in relation to this project. The views expressed herein are those of the authors and do not represent the official policy or position of the Department of Veterans Affairs, Department of Defense, or US Government.
Appendix.: Calibration and decoding
The following model was used to relate unit activity to MPL movement velocity [33]:
where f is the square root transformed firing rate of a unit during movement described by ten-dimensional velocity vector V (vx,vy,vz,vθx,vθy,vθz,vp,vs,vf,vt) and b0, bx, by, bz, bθx, bθy, bθz, bp, bs, bf, bt are the coefficients that vary for each unit. Units that were not tuned to any direction of movement velocity (R2 ≤ threshold) were excluded from further processing. Over the course of this study the threshold varied between 0.001–0.005. In matrix form, this relationship is written as

where t is the number time points used for decoding, n is the number of neural features and d is the number of kinematic dimensions. Indirect optimal linear estimation (OLE) [34] with ridge regression [35] was used to solve for the coefficient matrix B as follows:

where λ1 is the optimization parameter for ridge regression and I is a d × d identity matrix. The decoding weights, W, which directly map neural firing rates, F, to kinematic command signals, V, satisfy the following equation:

and were solved for using ridge regression and variance correction [33] as below:

where + is the Moore-Penrose pseudoinverse and Σ is a diagonal matrix with values equal to the inverse variance of the residuals for each neural unit. Essentially this weights units that carry more information about movement velocity higher, and reduces the contribution from units that carry less, or more variable, information.
Decoding is then performed by multiplying the new feature vector F'[1×n] by the weight matrix W to find an estimate of the intended kinematics vector V'[1×d] as in equation (A4).
Movie 1. (7.48 MB, MP4) 10D Sequence Task.
Movie 2. (6.48 MB, MP4) 10D VR Object Task.
Movie 3. (7.61 MB, MP4)7D Sequence Task.
Movie 4. (3.83 MB, MP4) 7D VR Sequence Task.
Movie 5. (3.09 MB, MP4) 7D VR Object Task.
Movie 6. (6.97 MB, MP4) Simplified 'Box and Blocks' like task.
Movie 7. (24.6 MB, MP4) Difficulty completing the physical grasp in the testing phase of the trial.