
Abstract
Objective. To improve the quality of artificial vision that arises from retinal prostheses, it is important to bring electrically-elicited neural activity more in line with the physiological signaling patterns that arise normally in the healthy retina. Our previous study reported that indirect activation produces a closer match to physiological responses in ON retinal ganglion cells (RGCs) than in OFF cells (Im and Fried 2015 J. Physiol. 593 3677–96). This suggests that a preferential activation of ON RGCs would shape the overall retinal response closer to natural signaling. Recently, we found that changes to the rate at which stimulation was delivered could bias responses towards a stronger ON component (Im and Fried 2016a J. Neural Eng. 13 025002), raising the possibility that changes to other stimulus parameters can similarly bias towards stronger ON responses. Here, we explore the effects of changing stimulus duration on the responses in ON and OFF types of brisk transient (BT) and brisk sustained (BS) RGCs. Approach. We used cell-attached patch clamp to record RGC spiking in the isolated rabbit retina. Targeted RGCs were first classified as ON or OFF type by their light responses, and further sub-classified as BT or BS types by their responses to both light and electric stimuli. Spiking in targeted RGCs was recorded in response to electric pulses with durations varying from 5 to100 ms. Stimulus amplitude was adjusted at each duration to hold total charge constant for all experiments. Main results. We found that varying stimulus durations modulated responses differentially for ON versus OFF cells: in ON cells, spike counts decreased significantly with increasing stimulus duration while in OFF cells the changes were more modest. The maximum ratio of ON versus OFF responses occurred at a duration of ~10 ms. The difference in response strength for BT versus BS cells was much larger in ON cells than in OFF cells. Significance. The stimulation rates preferred by subjects during clinical trials are similar to the rates that maximize the ON/OFF response ratio in in vitro testing (Im and Fried 2016a J. Neural Eng. 13 025002). Here, we determine the stimulus duration that produces the strongest bias towards ON responses and speculate that it will further enhance clinical effectiveness.
Export citation and abstract BibTeX RIS

Original content from this work may be used under the terms of the Creative Commons Attribution 3.0 licence. Any further distribution of this work must maintain attribution to the author(s) and the title of the work, journal citation and DOI.
Introduction
Outer retinal degenerative diseases such as retinitis pigmentosa (RP) and age-related macular degeneration (AMD) can cause profound dysfunction of retinal neurons, and ultimately lead to blindness. No cure is currently available. Many inner retinal neurons survive the degenerative processes that occur in the outer retina and can therefore be targeted by implanted electrode arrays with the hope of inducing a neural signal that provides useful visual information (Zrenner 2002, Weiland et al 2011). Proof of principle for this approach has been repeatedly demonstrated in clinical testing (Humayun et al 2003, Rizzo et al 2003, Fujikado et al 2007, Zrenner et al 2011, Stingl et al 2013, da Cruz et al 2013, Shivdasani et al 2014, 2017, Hornig et al 2017) but unfortunately, the quality of vision elicited is still far removed from that which occurs naturally (Zrenner et al 2011, Stingl et al 2013, da Cruz et al 2013). Somewhat surprisingly, implants with a large number of densely packed electrodes provide only a modest improvement in visual acuity or in the ability to recognize objects, as compared to devices that have fewer and more widely-spaced electrodes (Zrenner et al 2011, Stingl et al 2013, da Cruz et al 2013). This suggests that further improvements in the quality of elicited vision will require advances beyond mere increases to the quantity and/or density of independent stimulating channels.
To elicit the highest levels of artificial vision, the neural activity created by the prosthesis should precisely match the neural activity that arises normally in the healthy retina (e.g. in response to visual stimuli). However, perfect replication is quite challenging given the large number of different types of retinal neurons (Masland 2001, Rockhill et al 2002, Sane and Masland 2015, Baden et al 2016) and the diversity of signaling patterns utilized by each (DeVries and Baylor 1997, Masland 2001, Roska and Werblin 2001, Roska et al 2006). For example, ON types of retinal ganglion cells (RGCs) report luminance increments by spiking when a 'bright' stimulus is presented within their receptive field while adjacent OFF RGCs remain quiet in response to the same stimulus. When the stimulus is turned off, or when a luminance decrease is presented to the cell's receptive field, OFF cells respond strongly while ON cells remain quiet. Thus, a prosthesis that activates both ON and OFF types simultaneously creates a signal in the retina that is non-physiological and may therefore not appropriately signal the downstream visual circuits that underlie perception. The thresholds for direct activation of ON and OFF RGCs are quite similar (Sekirnjak et al 2008, Fried et al 2009, Tsai et al 2009, Jepson et al 2013) and so simultaneous activation is likely to occur for commonly-used stimulation paradigms (Behrend et al 2011, Weitz et al 2015).
In an earlier study, we showed that for electric stimuli that activate neurons presynaptic to RGCs (indirect activation), as opposed to stimuli that directly activate the RGC itself, the spike trains that arise in a given RGC more closely match some aspects of the light-elicited responses that arise naturally in the same RGC (Im and Fried, 2015). Thus, for example, indirect activation results in higher firing rates in ON brisk transient (BT) cells than in ON brisk sustained (BS) cells, similar to the differences that arise in response to light. Interestingly, the match between electrically-elicited and physiological patterns was better in ON cells than in OFF cells, suggesting an electric stimulation paradigm that preferentially activates the ON system would produce a neural signal that is a closer match to physiology and might therefore be easier for the brain to interpret. Subsequent testing revealed that the ratio of ON to OFF responses was sensitive to the rate at which stimulation was delivered (Im and Fried 2016a), and thus the sensitivity of ON signaling along with the corresponding increase in correlation to physiological signaling could be modulated by changes to the stimulus rate. Intriguingly, the rates at which the ON to OFF ratio was strongest corresponded closely to the rates preferred by subjects during clinical testing (Zrenner et al 2011, Stingl et al 2013, Chuang et al 2014, Stingl et al 2015). This raises the possibility that the psychophysical preferences for certain stimulation rates arise from a closer resemblance to physiological signaling brought on by enhanced selectivity in targeting ON cells and thus suggests that further enhancements to percept quality may be achievable by optimizing other parameter sets that increase the selectivity with which ON cells are activated.
In the present study, we explore whether changes to the duration of the stimulus alter the selectivity for targeting ON versus OFF cells. Our results show that changes to the duration do indeed modulate the selectivity for ON versus OFF responses, suggesting that the match to physiological signaling can be further enhanced by careful selection of this parameter.
Methods
Preparation of retina
The care and use of animals followed all federal and institutional guidelines. All protocols were approved by the Institutional Animal Care and Use Committees of the Boston VA Medical Center and the Massachusetts General Hospital. New Zealand White rabbits (~2.5 kg) were anesthetized with a subcutaneous injection of xylazine/ketamine and subsequently euthanized with an intracardial injection of pentobarbital sodium. Immediately after death, the eyes were removed. All subsequent procedures were performed under dim red illumination. After hemisection of the eye ball, the front half was removed and the vitreous was eliminated. The retina was then separated from the retinal pigment epithelium and mounted, photoreceptor side down, on a 10 mm square piece of Millipore filter paper (0.45 µm HA membrane filter) using vacuum grease applied between the filter paper and the recording chamber (~1.0 ml volume). A circle at the center of the Millipore filter paper, approximately 2.1 mm in diameter, allowed light transmission from below to be projected onto the photoreceptor layer.
Electrophysiology
Cell-attached patch clamp was used to record spikes from retinal ganglion cells (RGCs) in the rabbit retina explant. Small holes, typically smaller than 100 µm in diameter, were made in the inner limiting membrane using patch pipettes. Then, RGCs with large somata (diameter > 20 µm) were targeted for recordings so as to avoid the possibility of including displaced amacrine cells. Spiking was recorded with a patch electrode (4–8 MΩ) filled with Ames medium. Two silver chloride-coated silver wires served as the ground for recording electrode and were positioned at opposite edges of the recording chamber, each ~15 mm away from the targeted cell. Data were recorded and low-pass filtered at 2 kHz using an Axopatch 200B amplifier (Molecular Devices, Sunnyvale, CA), and digitized at 10 kHz by NI-DAQ (PCI-MIO-16E-4, National Instruments, Austin, TX). During the recordings, the retinal tissue was continuously perfused at 4 ml min−1 with Ames medium (pH 7.4) at 36 °C, equilibrated with 95% O2 and 5% CO2.
Light stimulation (RGC type classification)
Targeted ganglion cells were classified as either ON or OFF by their response to stationary flashed bright spots (diameter range: 100–1000 µm, presentation duration: 1 s) on a gray background, which were repeated at least three times with at least 1 s interval between consecutive presentations. The flashed spots were centered on the targeted soma and projected from below onto the photoreceptor outer segments using an LCD projector (LP120, InFocus, Portland, OR). Only those cells that generated brisk responses (Caldwell and Daw 1978, Amthor et al 1989) were targeted for further study. ON cells were further classified as brisk transient (BT) if they exhibited doublets (or triplets) in their spontaneous activity or in their weakest light responses (DeVries and Baylor 1997, Hu and Bloomfield 2003). Brisk ON cells that were not BT were classified as brisk sustained (BS) cells. All ON cells were also tested with moving bars to ensure they were not directionally selective (Barlow et al 1964). OFF cells that responded with brisk spiking were further classified as BT or BS by their response to a 4 ms-long half-sinusoid electric stimulus (Im and Fried 2015); OFF BT cells tended to have less jitter in their last spike and smaller average inter-spike intervals. We recorded the spiking activities from 7 ON BT, 10 ON BS, 8 OFF BT, and 14 OFF BS cells taken from 7, 8, 8, and 11 retinas, respectively.
Electric stimulation
We measured responses of RGCs to electrical stimuli delivered via a 10 kΩ platinum–iridium electrode (MicroProbes, Gaithersburg, MD); the exposed area at the electrode tip (no Parylene-C insulation) was conical with an approximate height of 125 µm and base diameter of 30 µm, giving a surface area of ~5900 µm2 (comparable to a 87 µm diameter disk electrode). Stimulating electrodes were positioned 25 µm above the inner limiting membrane; the tip of the electrode was raised by micromanipulator after touching the surface of the inner limiting membrane. Two silver chloride-coated silver wires served as the return for stimulating electrode; each was positioned ~8 mm away from the targeted cell and ~6 mm apart from the other wire. The electric stimuli were applied by a stimulus generator (STG2004, Multi-Channel Systems MCS GmbH, Reutlingen, Germany). The data acquisition and light/electric stimuli were controlled by custom software written in LabVIEW (National Instruments, Austin, TX) and Matlab (Mathworks, Natick, MA).
The stimulus waveform was a single monophasic half-sinusoidal wave (durations: 5, 6.7, 10, 20, 50, and 100 ms, corresponding to a single half-period of sinusoidal waveforms with frequencies of 100, 75, 50, 25, 10, or 5 Hz, respectively). Long-duration pulses are known to activate presynaptic neurons, thereby leading to indirect activation of RGCs (Greenberg 1998, Jensen et al 2005, Fried et al 2006, Freeman et al 2010, Im and Fried 2015) and referred to as network-mediated responses. In preliminary experiments, responses to monophasic half-sinusoid waveforms were found to be largely similar to responses from monophasic square pulses with the same duration and charge (data not shown).
Amplitudes of monophasic stimuli were adjusted to keep total charge constant. The peak amplitude of the stimulus waveform ranged from ±100 to ±5 µA as the duration ranged from 5–100 ms. While we did not measure threshold amplitudes separately for each duration, the currents used for each duration are known to be supra-threshold (Freeman et al 2010). In addition, the 100 µA amplitude for the 5 ms stimulus was shown to be well above threshold in an earlier study (Im and Fried 2015); the other amplitudes were fixed by the need to maintain constant charge levels. At a given amplitude, the stimulus was presented a minimum of 5 times (typically 7). Because previous work indicated that responses to these types of stimuli could persist for longer than 150 ms (Freeman et al 2011 Lee et al 2013, Im and Fried 2015 2016a), responses were captured for a duration of 1 s following stimulus onset. Spiking activity was also recorded for 0.5 s prior to the onset of the stimulus to provide a baseline level of responsiveness in cells for which spontaneous activity was observed. The time interval between successive recordings was always greater than 3 s.
Data analysis
Raw recordings were processed with custom software written in Matlab. The timing of individual spikes was detected as the depolarization peak of each spike; thus the spike timing in raster plots is ~0.5 ms greater than its actual onset (Lee et al 2013). Each vertical line in raster plots represents a single spike. Raster plots of evoked responses to various stimulus durations were plotted centered at the duration marked on the y-axis (figures 1, 2, and 8). Elicited spikes were counted in the post-stimulus one second and were corrected by spontaneous rates that measured in the pre-stimulus half second recording. Peak firing rates were computed using a bin size of 20 ms and a rolling step size of 4 ms for comparison with previous work (Im and Fried 2015).
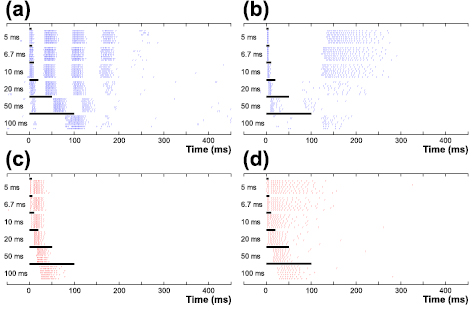
Figure 1. ON and OFF cells show distinct response patterns to a wide range of durations of cathodal stimuli. (a) and (b) Raster plots of elicited spikes in an ON BT cell (a) and an ON BS cell (b) to single cathodal stimuli of durations ranging from 5–100 ms. Stimulus duration is marked with a thick horizontal line at top as well as indicated by number in the left of each row. (c) and (d) Same as (a) and (b) but for responses of an OFF BT cell (c) and an OFF BS cell (d).
Download figure:
Standard image High-resolution image
Figure 2. ON and OFF cells generate weaker responses to anodal than cathodal stimuli, but still show distinct response patterns to a wide range of durations. (a) and (b) Raster plots of elicited spikes in an ON BT cell (a) and an ON BS cell (b) to single anodal stimuli of durations ranging from 5–100 ms. Stimulus duration is marked with a thick horizontal line at top as well as indicated by number in the left of each row. (c) and (d) Same as (a) and (b) but for responses of an OFF BT cell (c) and an OFF BS cell (d).
Download figure:
Standard image High-resolution imageThe response ratio between ON and OFF cells was computed as the average spike count of an ON cell divided by that of an OFF cell (figure 4). The response ratio was calculated between every pair of ON BT (n = 7) and OFF BT cells (n = 8); then all ratios (56 pairs in total) were averaged. For every pair of BS cells (n = 10 for ON BS and n = 14 for OFF BS cells; 140 pairs in total), the response ratio was computed in the same manner.
Statistical analysis
Unless otherwise indicated, all data are presented as the mean ± one standard deviation. In figures, shaded areas around data points and curves indicate one standard deviation. Significance of any statistical comparisons was verified using paired or unpaired (marked next to p values in text) one tailed Student's t-test. Statistical significance was denoted in figures by * for p < 0.05, ** for p < 0.01, and *** for p < 0.001.
Results
It is now well-established that electric stimuli that directly activate RGCs typically result in only one or two short-latency action potentials (Fried et al 2006, Sekirnjak et al 2008, Tsai et al 2009, Jepson et al 2014) while electric stimuli that instead activate the retinal network typically result in one or more bursts of spiking (Greenberg 1998, Jensen et al 2005, Freeman et al 2010, Eickenscheidt et al 2012, Boinagrov et al 2014, Im and Fried 2015). The patterns of bursts that arise through network-mediated activation are distinct for each type of RGC (Im and Fried 2015). Furthermore, the temporal patterning of spikes in each type matches some elements of the spike trains that arise physiologically in that same type (Im and Fried 2015). Network-mediated responses are known to be sensitive to the duration of the stimulus (Freeman et al 2010, Lee et al 2013, Boinagrov et al 2014, Jalligampala et al 2017) but it is not known whether the effect varies for individual cell types. We therefore measured network-mediated activation responses in RGCs to stimulus durations ranging from 5 to 100 ms; the level of charge delivered was held constant across all durations to facilitate comparisons in terms of charge (or energy) efficiency. Targeted cells were classified into known types using a combination of light and electrical responses (see Methods); only cells identified as ON or OFF versions of BT and BS cells were targeted for subsequent investigation.
ON and OFF types of RGCs have distinct sensitivities to stimulus duration
Figure 1(a) shows the response of a typical ON BT cell to cathodal stimuli with durations ranging from 5 to 100 ms. Not surprisingly, the pattern of spike bursts elicited by the 5 ms stimulus is highly similar to the patterns shown previously to arise from slightly shorter (4 ms) stimuli in the same cell type (Im and Fried 2015). Slight increases in duration (up to 20 ms) had only small effects on the response. As the stimulus duration was increased further however, there was a progressive weakening of the response, eventually resulting in only a single burst of spikes when the stimulus duration was 100 ms. The sensitivity to duration was largely similar in ON BS cells with responses that were generally consistent for shorter stimulus durations and significant reductions in response strength for longer stimuli (figure 1(b)). Somewhat surprisingly however, response strength in OFF cells was less sensitive to duration (figures 1(c) and (d)) although there was a progressive increase in onset latencies, especially for the longest duration stimuli. The differences in ON versus OFF responses suggest the possibility that the synaptic mechanism(s) that mediate activation through the network are different for the two pathways although we did not attempt to further elucidate such mechanisms. The first, short-latency spike, thought to arise from direct activation of RGCs (Margalit et al 2011, Eickenscheidt et al 2012, Boinagrov et al 2014), was eliminated for long-duration stimuli in all cell types, suggesting that all RGCs are less sensitive than upstream neurons to such long stimuli. Similar to cathodal stimuli, anodal responses varied systematically with the duration of the stimulus and exhibited significantly different sensitivities across cell types (figure 2). For example, anodal responses were generally strongest in ON BT cells (figure 2(a)) but almost non-existent in OFF BS cells (figure 2(d)). Thus, our findings confirm that network-mediated responses are sensitive to stimulus duration (Freeman et al 2010, Lee et al 2013, Boinagrov et al 2014, Jalligampala et al 2017) and extend previous findings to show that the sensitivity to duration varies significantly for different RGC types.
To quantitatively evaluate the sensitivity differences across types, we calculated the total number of spikes elicited at each stimulus duration (figure 3). Consistent with the qualitative observations of figure 1, the largest numbers of spikes were generally elicited by the shortest duration cathodal stimuli in all types (figures 3(a) and (b)). However, the sensitivity to duration was much larger in ON cells than in OFF cells (compare figures 3(a) and (b)), e.g. spike counts in ON BT cells were reduced by ~40% (42.3 ± 14.1 and 25.0 ± 6.6 for durations of 5 and 100 ms, respectively) while counts in OFF BT cells were reduced by only ~7% (15.1 ± 7.5 and 14.1 ± 3.3, respectively). Similarly, responses in ON BS cells were diminished by ~70% (23.4 ± 6.8 versus 7.1 ± 6.2 spikes) while responses in OFF BS cells were reduced by ~35% (18.9 ± 4.7 versus 12.3 ± 3.7). Given that network-mediated responses in OFF cells saturate earlier than those in ON cells (Im and Fried 2015), the contrasting sensitivity to stimulus duration may result from different response modes of activation in the two pathways, i.e. operating in a linear region for ON cells versus a region that is nearly saturated for OFF cells. We did not explore this possibility further. It is also interesting that BT responses were always larger than BS responses in the ON system, regardless of stimulus duration (solid versus hollow symbols in figure 3(a); p = 0.001, 0.001, 0.004, 0.001, < 0.001 and < 0.001 for stimulus durations of 5, 6.67, 10, 20, 50, and 100 ms; unpaired t-test), but in the OFF system the differences between BT and BS responses were much smaller (figure 3(b); p = 0.080, 0.105, 0.241, 0.357, 0.029, and 0.139 for stimulus durations of 5, 6.67, 10, 20, 50, and 100 ms; unpaired t-test). Much of the difference between the responses of ON and OFF BT cells arises from the presence of multiple bursts in the ON BT responses, especially for shorter duration stimuli, and if these 'additional' bursts are excluded from the analysis, which is likely to be the case in the degenerate retina, the difference between ON and OFF BT cells becomes much smaller (not shown).
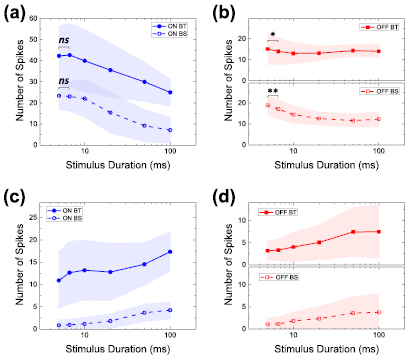
Figure 3. ON cells are more sensitive to stimulus duration change than OFF cells. (a) and (b) Number of elicited spikes as a function of stimulus duration in response to cathodal stimuli for ON (a) and OFF (b) cells. (c) and (d) Same as (a) and (b) but for responses to anodal stimuli. Shaded areas in (a)–(d) indicate mean ± one standard deviation. Spike counts of OFF cells were plotted in two subpanels in (b) and (d) for clarity as BT and BS types showed similar profiles. Paired one tailed Student's t-test was applied to verify the significance of statistical comparisons; *P < 0.05 and **P < 0.01 (ns, not significant). Statistical significances across BT versus BS types are not included in the figure; p ⩽ 0.004 for all durations of cathodal stimuli in ON BT versus ON BS cells (a), p > 0.05 for all durations of cathodal stimuli but 50 ms in OFF BT versus OFF BS cells (b), p < 0.001 for all durations of anodal stimuli in ON BT versus ON BS cells (c), and p < 0.05 for all durations of anodal stimuli but 100 ms in OFF BT versus OFF BS cells (d) (see text for exact p values).
Download figure:
Standard image High-resolution imageAnodal responses were weak in all cell types (figures 3(c) and (d)) with even the strongest (anodal) responses smaller than the weakest cathodal response in the same type. Thus, for example, the strongest anodal response in ON BT cells occurred at a stimulus duration of 100 ms (17.4 ± 4.4 spikes) and was smaller than the weakest cathodal response (25.0 ± 6.6 spikes at a duration of 100 ms). Interestingly, responses to anodal stimuli increased with increasing duration for all cell types although we did not further explore the factors contributing to the differences in sensitivity.
Stimulus duration alters the relative strength of ON versus OFF responses
To further evaluate the effectiveness of each stimulus duration we calculated the pairwise ratio of ON to OFF responses (i.e. total spike counts; see Methods) in each system (BT and BS) as a function of stimulus duration (figure 4). Because the sensitivity to duration varied significantly across types, we wanted to explore whether the ON versus OFF pathway could be preferentially biased at certain durations. Interestingly, the ON to OFF response ratio was maximized at a stimulus duration of ~10 ms for cathodal stimuli in both the BT and BS systems (highlighted with a yellow band in figure 4(a)). This location is consistent with the shapes of the individual response curves for each type, e.g. ON cell responses began to decrease slightly for durations >10 ms and more strongly for longer durations (figure 3(a)), while OFF cell responses decreased for durations up to 10 ms and then remained approximately constant (figure 3(b)). Although the shape of the profiles was generally similar for both BT and BS cells (figure 4(a)), the ON/OFF ratios were higher for BT cells than for BS cells, suggesting a higher selectivity for ON responses in the BT pathway. For example, the ON/OFF ratios in response to cathodal stimuli were always bigger than 2 on average for BT cells (black circles in figure 4(a)). Thus, our results suggest that changes to stimulus duration can indeed influence the ratio between ON and OFF responses with durations of ~10 ms maximizing the bias towards ON responses in both the BT and the BS pathways. Metrics other than spike count were also evaluated while comparing ON versus OFF responses (see below). For anodal stimuli (figure 4(b)), the response ratio for BT pairs was fairly similar to that seen with cathodal stimuli but the peak occurred at a slightly shorter duration (6.7 ms, black circles in figure 4(b)). The trend for BS pairs was less clear with anodal stimuli (green squares in figure 4(b), probably due to the paucity of anodal responses for both ON and OFF types (see figures 3(c) and (d)).
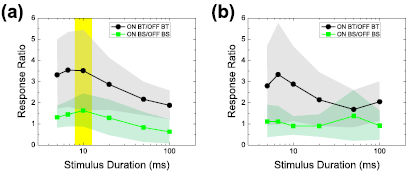
Figure 4. ON/OFF response ratio is maximized at a stimulus duration of ~10 ms. ON/OFF response ratios in BT/BS pairs as a function of stimulus duration for responses to cathodal (a) and anodal (b) stimuli. As highlighted with a yellow band in panel (a), the ON/OFF response ratios are near or at the maximum to cathodal stimuli of a duration of ~10 ms.
Download figure:
Standard image High-resolution imageIn addition to comparing the total number of spikes across types, we also compared the changes in peak firing rates across stimulus duration (figure 5). We first examined peak firing rates in response to cathodal stimuli (figures 5(a) and (b)). In general, peak rates were less sensitive than total spike counts to changes in stimulus duration with the lone exception of ON BS cells. In these cells, firing rates decreased consistently and were reduced by almost 50% between the shortest and longest durations (figure 5(a), hollow circles). Peak firing rates remained somewhat consistent for the other cell types although OFF cells exhibited a significant drop for the 100 ms-long stimulus (figure 5(b); p < 0.001 for both BT and BS types; paired t-test). On average, ON BT cells always had peak firing rates at least 2-fold higher than those of ON BS cells (figure 5(a)) and OFF BT cells similarly exhibited a higher peak firing rate than OFF BS cells (figure 5(b)). This is consistent with the differences in peak firing rates observed in response to light (DeVries and Baylor 1997, Im and Fried 2015). Even though they were less sensitive to stimulus duration, the separation in peak firing rates for BT versus BS cells was always larger than the separations in total spike counts, suggesting that peak firing rates in response to electric stimulation might be useful for better distinguishing between BT and BS types, especially given the challenges of doing this reliably in the OFF system (Amthor et al 1989, Im and Fried 2015).

Figure 5. Peak firing rates are less affected by varying stimulus durations. (a) Peak firing rates with a bin size of 20 ms in cathodal responses as a function of stimulus duration in ON BT and BS cells. (b) Same as (a) but for OFF BT and BS cells. (c) and (d) Same as (a) and (b) but for anodal responses. Shaded areas in (a)–(d) indicate mean ± one standard deviation. Paired one tailed Student's t-test was applied to verify the significance of statistical comparisons; *P < 0.05, **P < 0.01 and ***P < 0.001 (ns, not significant).
Download figure:
Standard image High-resolution imagePeak firing rates in response to anodal stimuli gradually increased with increasing stimulus duration from 5 to 50 ms for all cell types (figures 5(c) and (d)) but then decreased when the duration was further increased to 100 ms (p = 0.007, 0.035, 0.058, and 0.125 for ON BT, ON BS, OFF BT, and OFF BS types, respectively; paired t-test). Peak firing rates to anodal stimuli in ON BT cells were comparable to the rates arising from cathodal stimuli (compare filled symbols in figures 5(a) and (c)) but ON BS cells and both types of OFF cells exhibited much lower peak firing rates; the firing rates for OFF BS cells were especially small (maximum rate of 61.2 ± 50.8 Hz).
Temporal response properties are also differentially sensitive to stimulus duration
The average latency of the first spike elicited by electric stimulation was always shorter for BT versus BS cells (figures 6(a) and (b); but note no statistical significance in OFF cell responses to cathodal stimuli) and is consistent with the shorter latencies that occur in response to light stimuli (Bolz et al 1982, Amthor et al 1989, Roska and Werblin 2001, Im and Fried 2015). In all cell types, those latencies generally increased with increasing stimulus duration resulting in the largest latencies for the longest duration stimuli. The rate of increase was different across types however and so the relative differences in latency across types varied considerably with duration. For example, latencies for ON BS responses were much larger than those for ON BT responses at 100 ms while latency differences for OFF BT versus OFF BS were quite small (right-most bars in figure 6(a)). The increasing latencies might result from decreased current amplitude as reported previously (Stett et al 2000, Sekirnjak et al 2008, Lee et al 2013). Also, it is possible that longer stimuli were less effective than shorter ones, possibly because temporal integration of applied charges can be leakier (i.e. more charge dissipates during a longer stimulus). It is difficult to further separate the effects of pulse duration and current amplitude because both were varied together to maintain the condition of equal charge. For anodal stimuli, latencies again increased with increasing duration of the stimulus with statistically significant differences between ON BT and ON BS cells as well as between OFF BT and OFF BS cells (blue and red bars in figure 6(b), respectively; see Discussion). The differences for the two OFF types may prove to be useful for further distinguishing between OFF BT and OFF BS cells (Amthor et al 1989, Im and Fried 2015).

Figure 6. First spike latency as a function of stimulus duration. (a) Bar graphs of first spike latencies in responses to cathodal stimuli of various durations. (Inset) Magnified view of bar graphs for the stimulus duration of 5 ms. In response to the 5 ms-long pulse, an outlier in the OFF BS group was excluded as it showed the first spike latency of 13.9 ms. (b) Same as (a) but for responses to anodal stimuli. Unpaired one tailed Student's t-test was applied to verify the significance of statistical comparisons; *P < 0.05, **P < 0.01 and ***P < 0.001 (ns, not significant). Error bars indicate one standard deviation.
Download figure:
Standard image High-resolution imageIn response to natural scenes, the timing of individual spikes can be very precise with low levels of jitter observed across trials (Puchalla et al 2005). This raises the possibility that the creation of high-quality visual percepts with a prosthesis may require precise control over the timing of elicited spikes (Berry et al 1997, Lee et al 2013, Jepson et al 2014). Therefore, our final analysis was a calculation of the average jitter in the latency of elicited first spikes; we used this as a measure of the temporal reliability of spiking responses. Consistent with previous work (Lee et al 2013), we found that jitter was lowest for the shortest duration stimuli (figure 7(a)), regardless of cell type. Jitter increased substantially for longer duration stimuli and also exhibited more variability as indicated by the larger error bars. For cathodal stimuli, the jitter levels in ON BS cells, especially for longer duration stimuli, was much larger than those of the other cell types. In responses to anodal stimuli, jitter for OFF BS cells was remarkably larger than those of other types throughout the stimulus durations (figure 7(b)) although much of high jitter can be attributed to the small spike counts associated with those stimuli (figure 2(d)).

Figure 7. First spike jitter as a function of stimulus duration. (a) Bar graphs of first spike jitters in responses to cathodal stimuli of various durations. (Inset) Magnified view of bar graphs for the stimulus duration of 5 ms. (b) Same as (a) but for responses to anodal stimuli. Unpaired one tailed Student's t-test was applied to verify the significance of statistical comparisons; *P < 0.05, **P < 0.01 and ***P < 0.001 (ns, not significant). In both panels, ns's were not denoted for brevity. Particularly, in panel (a), no pair demonstrated statistical significance. Error bars indicate one standard deviation.
Download figure:
Standard image High-resolution imageDiscussion
Indirect activation improves selectivity for ON cells
BT and BS versions of the ON and OFF types in the rabbit retina are likely to be homologues of parasol and midget cells in the primate retina (Caldwell and Daw 1978, Shapley and Perry 1986, Zeck et al 2005), suggesting their importance in visual perception. Moreover, the ON and OFF types are typically not simultaneously active during natural viewing (Im and Fried 2016b). Therefore, to enhance the ability of the prosthesis to replicate the out-of-phase neural activity patterns that occur naturally between the ON and OFF channels of the retina, it is desirable to develop stimulation strategies that can selectively activate each channel separately. Unfortunately however, the thresholds for direct electric stimulation of the ON and OFF variants of a given cell type are highly similar (Sekirnjak et al 2008, Fried et al 2009, Tsai et al 2009, Jepson et al 2013), making selective activation hard to achieve. While the use of high-rate stimulus trains shows some promise for selective targeting of ON versus OFF RGCs (Cai et al 2011, 2013, Twyford et al 2014), as does the use of high-density electrode arrays that can target single RGCs individually (Sekirnjak et al 2008, Jepson et al 2013), both direct activation approaches require considerable additional developmental effort before they can be implemented clinically.
In contrast to stimulation that directly activates RGCs, the results here suggest that targeting the neurons upstream of RGCs (indirect activation) can produce stronger activation of the ON system relative to that of the OFF system. For example, the total spike counts in ON BT cells were much larger than those of OFF BT cells across a wide range of stimulus durations (figure 3(a)). We also found, somewhat surprisingly, that the sensitivity to stimulus duration was significantly different for ON versus OFF cells. For example, ON cell responses generally decreased as stimulus durations increased above 10 ms while OFF cell responses were much more consistent over this same range (figures 3(a) and (b)). As a result, the relative strength of ON to OFF responses varied for different stimulus durations; the highest ON to OFF ratio occurred for a duration of 10 ms in both the BT and BS systems (figure 4(a)). The ability to bias the relative strength of ON versus OFF responses by changing the stimulus duration is consistent with a previous study reporting that ON versus OFF biasing could also be influenced by changes to the rate at which stimulation is delivered (Im and Fried 2016a). This parallel therefore suggests the possibility that changes to other stimulation parameters may similarly bias the ON/OFF response ratio and it will be interesting in future work to learn which parameters have the strongest effect as well as to determine the maximum level of biasing that can be realized when all parameters are optimized simultaneously. Prior to the simultaneous optimization of all parameters however, there are additional parameters (e.g. waveform shape) that need to be independently optimized before investigation of their resulting interactions.
Most subjects tend to report 'bright' phosphenes during clinical testing (Humayun 1996, Humayun et al 2003, Rizzo et al 2003, Fujikado et al 2007, Zrenner et al 2011, Naycheva et al 2012, Pérez Fornos et al 2012, Stingl et al 2013, 2015, Shivdasani et al 2017, but see also Pérez Fornos et al (2012) for 'dark' sensations). This raises the possibility that prosthetic vision is largely driven through ON pathways and it is therefore intriguing that stimulation strategies that preferentially bias the ON system in our in vitro experiments (Im and Fried 2016a) are similar to those that improve psychophysical outcomes (Wilke et al 2011, Zrenner et al 2011, Pérez Fornos et al 2012, Stingl et al 2013, 2015, Chuang et al 2014). Interestingly, our in vitro experiments have also shown that the match between electrically-elicited responses arising through indirect activation and the responses that arise naturally to light is stronger in ON cells than in OFF cells (Im and Fried 2015). Here, we show that careful selection of pulse duration can bias the retinal response towards a more dominant ON component, thus raising the possibility that the overall match of the electrically-elicited response to the signaling patterns that arise physiologically can be improved as well. While it is too early to conclude that preferential biasing of the ON system leads to improved psychophysical outcomes, it will be interesting to explore whether even stronger biasing of the ON system leads to better clinical outcomes.
Understanding the network-mediated component of indirect responses
The presence of multiple bursts of spiking in response to network-mediated activation arises because several different classes of retinal neurons become activated by the stimulus. Direct activation of the RGC itself occurs when the leading edge of a cathodal stimulus waveform depolarizes the voltage-gated sodium channels within the proximal axon of the RGC (Fried et al 2006, 2009) and typically results in one or two spikes. The ultra-fast time constants associated with voltage-gated sodium channels underlie the very short onset latencies of this portion of the response, which was not elicited by the longest stimulus durations. This is consistent with much previous work indicating that direct activation is more effective with stronger and shorter pulses than with long weak ones.
Additional short-latency spikes within the first burst arise secondary to the activation of bipolar cells (BCs) (Jensen et al 2005, Fried et al 2006, Margalit et al 2011, Eickenscheidt et al 2012, Boinagrov et al 2014). Note that some groups have found that BC-mediated spikes comprise their own separate burst (Eickenscheidt et al 2012, Boinagrov et al 2014); the reason(s) for the differences across studies are not clear but may result from species and/or cell type differences. Although the exact mechanism underlying activation of BCs is not fully understood, it is likely that the voltage-gated calcium channels within the axon terminals of BCs become depolarized by cathodal stimuli (delivered epiretinally, or anodal stimuli delivered subretinally or suprachoroidally) leading to an influx of calcium that triggers the release of synaptic vesicles (Freeman et al 2010, 2011); increased release of excitatory neurotransmitter (glutamate) from the BCs leads to increased spiking in downstream RGCs. Voltage-gated calcium channels have longer time constants than those of voltage-gated sodium channels and thus require longer stimulus durations to become activated (Oltedal and Hartveit 2010, Freeman et al 2011). This, along with the increase in time needed for the signal to cross the synapse, underlies the longer latencies of this response component (i.e. all spikes but the first in the first burst). The mechanism underlying the activation of photoreceptors is thought to be similar to that of BCs although the kinetics of the voltage-gated calcium channels intrinsic to photoreceptor terminals are thought to be even slower than those in BCs (Freeman et al 2010, 2011), thus shifting the sensitivity of photoreceptors to even longer-duration stimuli, and further delaying the onset latency of this portion of the response (i.e. the second and third bursts). Some earlier studies confirmed that the second and third bursts are mediated by photoreceptors (Eickenscheidt et al 2012, Boinagrov et al 2014), suggesting that the second burst in the responses of this study is likely to be also photoreceptor-mediated.
It is tempting to assume that a sequential activation of the same neurons that mediate light responses occurs when electric stimulation activates photoreceptors, e.g. BCs become activated next, and in turn, activate RGCs. However, the timing and duration of the spike bursts observed here strongly suggest that there are significant differences in the progression of activation for light versus electrical responses. For example, the OFF RGC bursts that arise from photoreceptor activation can persist for ~100 ms beyond the duration of the stimulus (compare the duration of the last burst to the duration of the stimulus in OFF BS cells for durations of 5 or 6.67 ms in figure 1(d)), a situation that does not typically occur in response to light. Thus, the duration of the photoreceptor-mediated burst in OFF RGCs is not temporally correlated to the duration of the stimulus in the same way that they are for light stimuli, and therefore suggests that the synaptic circuitry or mechanisms that shape response duration are distinct from those that shape response duration to light in the healthy retina. While our findings do not reveal the specific details of the synaptic circuitry and mechanisms that do shape the duration of electrical responses, the fact that they are not correlated to stimulus duration for both OFF BS and BT cell types, suggests that whatever the mechanism, it is not unique to a single cell type or its associated retinal circuit. It is likely however that some variations exist across cell types because of the differences in timing for the two types tested here.
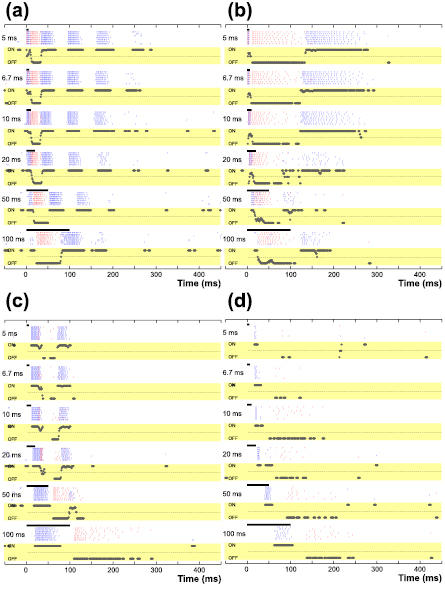
The presence of photoreceptor-mediated spike bursts in ON RGCs is even more difficult to explain by sequential activation of retinal neurons because unlike OFF BCs, the sign-inverting synapse in the dendrites of ON BCs converts increased activation of photoreceptors into hyperpolarization. This leads to a corresponding decrease in the release of excitatory neurotransmitter from BCs and should result in little or no spiking in ON RGCs. Termination of the stimulus could trigger a rebound (depolarizing) effect in ON BCs that, in turn, would lead to spiking in ON RGCs, however, the onset of the spike burst in ON BT cells occurs tens of milliseconds after completion of shorter-duration stimuli (5–10 ms) and over 100 ms for these same stimuli in ON BS cells. These delays are much longer than the known delays associated with rebound activation, and thus suggest one or more alternative mechanisms are at work. Intriguingly, the onset of the photoreceptor-mediated bursts in the ON system is temporally correlated to the offset of the photoreceptor-mediated burst in the OFF system (figures 8(a) and (b)), suggesting that one triggers the other. Sekhar et al (2017) also reported recently that application of a cathodal stimulus evokes responses in OFF cells while its removal elicits responses in ON cells. Despite significantly different latencies, the temporal correlation between offset of the OFF system and onset of the ON system is similar in both BT and BS cells, suggesting a similar neural 'switch' operating independently in each channel. The switching operation of ON and OFF pathways is more clearly shown in the plots of relative strength of ON and OFF responses (see yellow boxes in figure 8). These plots are representative of the differential temporal activity of ON and OFF cells in the population (n = 7 for ON BT, n = 10 for ON BS, n = 8 for OFF BT, and n = 14 for OFF BS). The plots reveal clear periods of time where each response is dominated by either the ON or the OFF channel. For example, in the BS system (5 ms stimulus, first row of figure 8(b)), the response is dominated by OFF cells from 20 to 125 ms and then by ON cells from 125 to 250 ms. This out-of-phase response is similar to that which would occur if a luminance decrease with a duration of ~100 ms was presented to these cells. Given the out-of-phase firing of ON or OFF cells that occurs in response to a single visual event (DeVries and Baylor 1997, Im and Fried 2016b), it is highly likely that the overall retinal response will be easier for the brain to interpret if responses are predominately from a single type (ON or OFF). Our analysis of the ON/OFF ratio in spike counts (figure 4(a)) showed that OFF cell responses are weakest relative to ON cell responses at a stimulus duration of 10 ms.
Figure 8. Representative raster responses from the four types of RGCs reported in this study. In each panel, two raster responses of corresponding types of ON and OFF cells were overlapped. (a) Raster plots of elicited spikes in an ON BT (blue) and an OFF BT cell (red) to single cathodal stimuli. The relative activation of the ON and OFF systems are displayed as a function of time at the bottom of each raster plot (black traces within the yellow boxes): a value of +1 indicates only an ON response occurred, −1 for OFF response only and a value of 0 when the ON and OFF responses are equal in magnitude. If there were no ON or OFF responses in a given time-window, the plot was left blank. The ratios were calculated in 5 ms bins. (b) Same as (a) but for an ON BS (blue) and an OFF BS cell (red). (c) and (d) Same as (a) and (b) but for anodal stimuli. All responses are from figures 1 and 2.
Download figure:
Standard image High-resolution image
The sign-inverting synapse of ON BCs may also help to explain the weak responses of OFF cells to anodal stimuli since OFF cells are hyperpolarized by such stimuli. OFF cells reliably elicited spikes after the offset of anodal stimuli at all stimulus durations (red raster plots in figures 8(c) and (d)) and is consistent with reports of post-hyperpolarization rebound bursts observed in both types of OFF cells in the mouse retina (Margolis and Detwiler 2007). OFF BT cell responses had shorter latencies than those of OFF BS cells (red bars in figure 6(b)), suggesting the BT type is more susceptible to post-hyperpolarization spiking. Also, longer anodal stimuli were more effective in both types (figure 3(d)), implying that the rebound mechanism underlying OFF cell responses is more sensitive to prolonged hyperpolarization. For example, in OFF BT cell responses to anodal stimuli, longer pulse duration resulted in an increased number of elicited spikes (red raster plots in figure 8(c)) and decreased the average latency (e.g. 28.4 ms versus 11.3 ms for 5 ms and 100 ms stimuli, respectively). These results suggest that, despite the increased 'leakiness' associated with longer-duration stimuli, a longer anodal stimulus is more effective in terms of both latency from the release of hyperpolarization as well as the magnitude of the response arising from the rebound mechanism. On the other hand, weaker anodal responses in ON BS RGCs (versus ON BT RGCs) suggest that RGC depolarization resulting from photoreceptor hyperpolarization was less effective in the ON BS pathway (compare solid versus hollow circles figure 3(c)). It has been known that low-voltage-activated (LVA) Ca2+ channels are responsible for rebound spiking in central nervous system neurons (Huguenard 1996). In the retina, Margolis et al (2008) reported deinactivation of LVA Ca2+ channels resulted in rebound excitation in OFF cells. Additionally, given the low resting membrane potential of OFF bipolar cells (Ashmore and Copenhagen 1983, Saito and Kaneko 1983), LVA Ca2+ channels may trigger neurotransmitter release more effectively in OFF than ON pathway (Pan 2000).
Because photoreceptors are mostly lost in the degenerate retina, the question arises as to whether the bursts described above that arise in response to photoreceptor stimulation will persist in the diseased retina. There is some evidence to suggest that photoreceptor inner segments may survive the degenerative process, at least for some forms of degeneration (Li et al 1995, Lin et al 2009, Milam et al 1998, Busskamp et al 2010), and further, their synapses to BCs remain functionally viable (Busskamp et al 2010). Thus, the possibility exists that the strong photoreceptor-mediated neural responses that arise in the healthy retina can still be re-produced, at least for some types of degenerate retinas. Unfortunately however, the presence of 'dormant' photoreceptors does not represent the majority of blind patients. In case of severe degeneration of photoreceptors, some or all of delayed bursts are likely to disappear, and the ON/OFF response ratio is likely to be significantly altered. For example, if responses with a latency > 100 ms in ON BS cells (figure 8(b)) are eliminated in the degenerate retina, OFF responses may become stronger than ON responses in the BS pathway (note that the OFF BS cell response is also likely to be reduced by photoreceptor-mediated portion). This may be the case for the few subjects who report dark sensations during clinical testing (Pérez Fornos et al 2012). It will also be important to establish whether the sensitivity of activated BCs is altered in the diseased retina as well as whether the selectivity for ON cell responses is compromised. Like recent studies (Jensen et al 2008, Sekirnjak et al 2009, Goo et al 2011, 2016, Cameron et al 2013, Cho et al 2016, Stutzki et al 2016, Jalligampala et al 2017), electrically-elicited responses should be systematically compared between wild-type and retinal degeneration model animals.
Bipolar cell-mediated responses are modest
It has been reported that 100 ms-long pulse preferentially activates photoreceptors (Freeman et al 2010). Typically in our results, there were no spikes elicited prior to the onset of the photoreceptor-mediated burst in the OFF system while ON cells showed little responses before the onset of photoreceptor-mediated burst (compare red and blue rasters in the last row of figure 8(a)). This was somewhat surprising as it suggests little or no activation of OFF BCs by the stimuli used here. It is not clear why this should be the case. Evidence from computational modeling (Werginz et al 2015) suggests that OFF BCs may be less sensitive to epiretinally-delivered stimuli than ON BCs but this difference should not have much of an influence for the relatively strong stimuli used here. Our results do not reveal whether only ON BCs are activated by the stimulus or whether both ON and OFF cells get activated but a stronger activation of ON BCs dominates the responses and somehow leads to a suppression of the responses in OFF BCs. Cross-inhibitory signals are known to exist between the ON and OFF pathways (Molnar et al 2009) and could contribute to the signal suppression seen here. If this 'all-or-nothing' type of activation in ON versus OFF BCs does indeed shape the responses as described above, and if it remains prevalent in the degenerate retina, it raises the possibility that even stronger biasing of the ON system will occur since neither bipolar-mediated nor photoreceptor-mediated responses would arise in the OFF system. While this would provide highly selective activation of the ON system, it may correspondingly prove difficult to effectively drive the OFF system using this same approach. Further insights into the underlying mechanism(s) that shape the responses of BCs might lead to improved methods of BC activation and might also help to identify ways to better target the OFF system.
The BC-mediated response in the ON system was strongest for stimulus durations of 10–20 ms (the first burst of responses shown in figures 1(a) and (b)), and is consistent with previous studies that have suggested mid-range durations are optimal (Freeman et al 2010, 2011). It will be interesting to determine whether the use of 10–20 ms stimuli will remain optimal in degenerated retina as the degenerative process is known to induce a host of structural and physiological changes (Jones et al 2003, Jones and Marc 2005, Gargini et al 2007, Barhoum et al 2008, Phillips et al 2010, Jones et al 2016), many of which could influence the strength of either the ON- or OFF-BC responses.
Acknowledgments
We thank Seung Woo Lee and Perry Twyford for helpful discussion. This work was supported by the VA Boston Healthcare System (1I01RX001663), the National Eye Institute (R01EY023651), the National Institute of Neurological Disease and Stroke (U01NS099700), the Rappaport Foundation, the Henry Ford Health System (A30940), Howard Neff Fund for Vision Rehabilitation, the Alliance for Vision Research, the Juliette RP Vision Foundation, and by the Austrian Science Fund (FWF, J3947).
Conflict of interest
The authors declare no competing financial interests.