

Abstract
Objective. Neuroinflammatory mechanisms are hypothesized to contribute to intracortical microelectrode failures. The cluster of differentiation 14 (CD14) molecule is an innate immunity receptor involved in the recognition of pathogens and tissue damage to promote inflammation. The goal of the study was to investigate the effect of CD14 inhibition on intracortical microelectrode recording performance and tissue integration. Approach. Mice implanted with intracortical microelectrodes in the motor cortex underwent electrophysiological characterization for 16 weeks, followed by endpoint histology. Three conditions were examined: (1) wildtype control mice, (2) knockout mice lacking CD14, and (3) wildtype control mice administered a small molecule inhibitor to CD14 called IAXO-101. Main results. The CD14 knockout mice exhibited acute but not chronic improvements in intracortical microelectrode performance without significant differences in endpoint histology. Mice receiving IAXO-101 exhibited significant improvements in recording performance over the entire 16 week duration without significant differences in endpoint histology. Significance. Full removal of CD14 is beneficial at acute time ranges, but limited CD14 signaling is beneficial at chronic time ranges. Innate immunity receptor inhibition strategies have the potential to improve long-term intracortical microelectrode performance.
Export citation and abstract BibTeX RIS
1. Introduction
Signals recorded by intracortical microelectrodes can be used to control computer cursors, robotic arms, as well as functional electrical stimulation of a patient's own arm [1–3]. Unfortunately, intracortical microelectrodes fail to consistently record neurological signals over longer time frames [4]. A number of failure modes likely influence chronic recording stability and quality including: (1) direct mechanical damage of the microelectrode; (2) corrosion of electrical contacts and degradation of passivation layers and insulating coatings; and (3) the neuroinflammatory response that the brain mounts against chronically implanted devices [5–8]. In a retrospective analysis of microelectrode failures over 28 years in non-human primates, the Donoghue group identified biological driven failure modes (largely inflammatory) as the largest class of chronic microelectrode failures [9].
Biological failure mechanisms span from the tissue and vascular damage associated with device implantation into the cortical tissue, through the progression of the neurodegenerative inflammatory response [10, 11]. Biological failure also includes glial scar formation isolating the microelectrode from the viable tissue [12, 13], as well as the breakdown of the blood–brain barrier (BBB) [8, 14]. Specifically, blood proteins released from the damaged vasculature adsorb to the surface of the microelectrode and promote inflammatory activation of microglia and infiltrating macrophages [14, 15]. Cytokines, chemokines, and other soluble factors released by the microglia or macrophages can damage nearby neurons, as well as recruit more inflammatory cells and promote vascular permeability [16–19]. Recognition of necrotic cells and blood proteins can promote further inflammatory activation in microglia and macrophages [15, 20], leading to cycles of self-perpetuating inflammation [14]. Chronic inflammation can cause neuronal damage and dysfunction throughout the duration of the microelectrode's residence in the brain [16, 21]. Loss of neurons within 50 µm of the microelectrode may reduce the capability of the microelectrode to detect single units [22]. As a result, groups like the Bellamkonda, Cui, Rennaker, and Tyler labs have begun to report a direct correlation between the neuroinflammatory response and recording performance [7, 23–25].
Mitigating the neuroinflammatory response to microelectrodes is a common strategy to improve intracortical microelectrode integration and performance [11]. Unfortunately, a varying degree of success was observed through these approaches [7, 26–31]. Some of the most successful approaches to mitigate the neuroinflammatory response indicate a dominant role of reactive microglia cells and infiltrating macrophages, as well as the stability of the local BBB [8, 32–36]. For example, the anti-inflammatory/antibiotic Minocycline has been shown to increase the longevity and quality of functional neural recordings [7]. Additionally, to minimize the effects of surgical trauma and localized hemorrhaging, others have implemented systemic and local application of the anti-inflammatory glucocorticoid dexamethasone and shown it can reduce the inflammatory response to inserted microelectrodes [37–40]. Despite promising results when targeting neuroinflammation, chronic application of general anti-inflammatory agents is dangerous due to harmful side-effects such as bone-softening [41] or unanticipated damage to other organs [42]. Thus, a better understanding of the neuroinflammatory response to implanted intracortical microelectrodes is required to develop specific therapeutic targets for safe long-term anti-inflammatory strategies.
Innate immunity pathways receptors have been increasingly associated with neuroinflammatory and neurodegenerative disorders [43–46]. Innate immunity is the body's fast-acting defense against invading pathogens that involves recognition of general molecular patterns [47]. A major component of innate immunity involves signaling through toll-like receptors (TLRs). TLRs are a family of transmembrane proteins that recognize general molecular patterns characteristic to pathogens (pathogen associated molecular patterns—PAMPs), such as bacteria and viruses, and enact downstream pro-inflammatory changes [48]. TLRs are expressed on peripheral immune cells, such as macrophages and dendritic cells, as well as several cells of the central nervous system, including microglia, astrocytes, and neurons [46, 48]. Downstream effects of TLR signaling include upregulation of the pro-inflammatory transcription factor NF-κB and release of pro-inflammatory cytokines, such as TNF, NO, IL1-α, IL-1β, IL-6, or MCP-1 [49, 50]. Growing evidence suggests that TLRs also recognize endogenous molecules associated with non-infectious tissue damage (damage associated molecular patterns—DAMPs), including blood proteins, heat shock proteins, and proteins released by necrotic cells (HMGB1) [51].
Toll-like receptor 2 (TLR2) and toll-like receptor 4 (TLR4), have been linked to neuroinflammatory disorders, such as Alzheimer's and multiple sclerosis [45, 46, 52]. TLR2 recognizes gram-positive bacteria, as well as necrotic and dying cells [53–55]. TLR4 recognizes gram-negative bacteria via lipopolysaccharide (LPS), as well as fibrinogen, fibronectin, and other endogenous molecules [56–59]. Bacterial endotoxin, necrotic cells, blood proteins, and other factors released by damaged tissue have been observed or hypothesized to be prevalent at the microelectrode–tissue interface, other cortical injuries, or peripheral implantation sites [11, 14, 16, 60–68]. Activation of TLR2 and TLR4 results in the downstream upregulation of the pro-inflammatory transcription factor NF-κB and the subsequent release of TNF-α and MCP-1 [49, 50]. Activation of TLR4 can lead to neurodegeneration [69]. TLR2 and TLR4 likely play a role in the chronic inflammatory responses to intracortical microelectrodes, due to their expression on cells resident to, or infiltrating into, the CNS. More importantly, TLR2 and TLR4 are prevalent and facilitate the release of inflammatory factors upon activation.
Cluster of differentiation 14 (CD14) is a co-receptor to both TLR2 and TLR4, and coordinates ligand binding [55, 70–72]. Macrophages, and to a lesser extent microglia, express CD14 [73–75]. CD14 is primarily involved in the recognition of bacterial endotoxin with TLR4, but it has also been implicated in the recognition of HMGB1, heat shock proteins, apoptotic cells, necrotic cells, and β amyloid plaques [70, 72, 76–82]. CD14 has also been identified to play a role in Alzheimer's disease [83]. The close association of CD14 with TLR2 and TLR4 in the recognition of PAMPs and DAMPs suggests that CD14 likely plays a role in the neuroinflammatory response to implanted intracortical microelectrodes.
In a study of intracortical microelectrode sterilization methods, we found that elevated bacterial endotoxin (LPS) presence corresponded with enhanced neuroinflammation and reduced neuronal survival [61]. Further, activation of CD14 via administration of LPS correlated with poor recording quality and reduced neuronal survival [25]. Together, these studies suggested that increased activation of CD14 had a negative effect on intracortical microelectrode recording performance and tissue integration. Therefore, we hypothesized that inhibition of the innate immunity pathway for CD14 would attenuate the foreign body response to intracortical microelectrodes and subsequent recording failure. To test this hypothesis, microelectrodes were implanted into the cortex of knockout mice lacking CD14 expression to evaluate recording performance and endpoint histology, compared to wild type controls over 16 weeks. In order to develop a translational approach to CD14 inhibition, we also investigated the efficacy of systemic CD14 inhibition in improving intracortical microelectrode performance. IAXO-101 (Innaxon) is a commercially available antagonist to the CD14/TLR4 complex [84]. Studies by Piazza and Bettoni investigating sepsis and neuropathic pain utilized IAXO-101, with promising results [85, 86]. We therefore hypothesized that systemic inhibition of CD14 via a small molecule antagonist would improve intracortical microelectrode recording performance and tissue integration. To test this hypothesis we implanted microelectrodes into the cortex of wild type mice systemically administered IAXO-101, and evaluated recording performance and endpoint histology after 16 weeks, compared to non-treated control animals.
2. Methods
2.1. Intracortical Probe Implantation Procedure.
Single-shank 16-channel planar microelectrode arrays (NeuroNexusA1x16-3mm-50-177) were implanted into the motor cortex of nine Cd14−/− mice (Jackson Laboratory strain # 000664) lacking the CD14 co-receptor, five wild type mice (Jackson Laboratory strain # 003726) and five wild type mice administered IAXO-101 (Innaxon) aged 8–14 weeks and weighing at least 20 g. Prior to implantation, Cd14−/− mice were verified as knockouts via tail snips and standard PCR analysis methods.
Mice were handled inside a microisolator hood and prepared for surgery using standard aseptic techniques to minimize pathogen exposure to immune compromised Cd14−/− mice. Mice were anesthetized with 3% isoflurane, restrained in a stereotaxic frame with ear bars, and maintained under anesthesia with 0.5–1% isoflurane. Mice were administered .02 ml of Marcaine under the scalp and Meloxicam subcutaneously at a dosage of 2 mg kg−1. the skull was exposed with a midline incision, cleaned and dried with 3% hydrogen peroxide and covered with surgical adhesive (3M Vetbond® Tissue Adhesive) to promote cement adhesion.
Craniotomies for ground and reference wires were drilled with a 0.45 mm diameter drill bit 1–2 mm left of midline. The ground wire craniotomy was placed 1–2 mm posterior to bregma and the reference wire was placed 1–2 mm anterior to bregma. A craniotomy for the microelectrode probe was drilled with a 0.45 mm diameter drill bit 1.5 mm to the right of midline and 0.5 mm posterior to bregma. These coordinates correspond to motor activity of the mouse forelimb [87]. All craniotomies were kept hydrated with sterile saline as needed.
Ground and reference wires of the ethylene-oxide-sterilized electrode were inserted first, sealed with silicone elastomer (Kwik-sil), and secured into place with dental cement (Stoelting). A hand-driven micromanipulator was then used to gradually insert the silicone microelectrode shank into the center of the motor cortex craniotomy. The electrode was inserted in 50 micron increments to an approximate depth of 800–850 microns. At this depth, the 16 electrode contacts should span cortical layers I–V. Each 50-micron insertion step took 1–2 s, and the cortex was allowed to rest for at least 5–10 s between insertion steps to provide time for any strain on the tissue to relax. The noise level on all channels was monitored throughout the process to verify the electrode remained intact and to determine when all channels were in the cortex. All electrode contacts were determined to be in the cortex when the noise level of the top channel transitioned from a high noise level (indicative of being in open air) to a lower physiological level.
2.2. Administration of a small molecule CD14 inhibitor
IAXO-101 (Innaxon), a small-molecule inhibitor to CD14, was diluted 1:5 with a sterile, nonpyrogenic 5% dextrose injection using aseptic technique. IAXO-101 was administered at a dosage of 3 mg kg−1 subcutaneously every other day starting 16–24 h before microelectrode implantation. Doses were spaced 48 ± 2 h apart.
2.3. Electrophysiological recordings
Electrophysiological recordings were obtained the day of surgery, 5 d post-surgery, and twice weekly until 16 weeks post-implantation. During each recording session, the headstage (TDT ZC16) was connected after briefly exposing the animal to 3% isoflurane to minimize head movement and strain on the implant. After recovery, neural recordings were collected while the mice walked freely in a large bowl for 3 min. The bowl was rotated by hand to counter-act tangling of the headstage cable. Electrophysiological activity was recorded with a TDT R16PA Medusa Pre-amp and TDT RX5 Pentusa Processor. Afterwards, the headstage was disconnected after brief exposure to 3% isoflurane.
2.4. Signal processing
Electrophysiological data were sampled at 24.4 kHz, bandpass filtered between 300 Hz and 3 kHz and then common average referenced to remove global noise. Brief time segments containing artifacts were removed post hoc by a reviewer blinded to time point and test group. Occasionally, channels or entire recording sessions were removed by the blinded reviewer if it appeared that the cable was improperly connected (i.e. extreme high noise) or water drips from the water bottle had shorted the contacts to ground (i.e. extreme low noise). Spikes were detected when the signal crossed a lower threshold set at 3.5 standard deviations from the mean. Spike waveforms consisted of 12 samples before and 24 samples after each threshold crossing and were sorted into different single units using the unsupervised sorting algorithm, Wave_clus [88].
To focus analysis on cortical layers with large firing neurons (layer V) and account for inherent variance in implantation depth, only the eight consecutive channels with the highest sum of average units over time were included in the calculation of the following five performance metrics for each recording session: (1) average number of units per working channel, (2) percentage of working channels detecting single units, (3) background noise level averaged across all working channels, (4) and (5) the average signal amplitude and signal-to-noise ratio (SNR) of the subset of the eight channels detecting single units.
Signal amplitude was defined as the peak-to-peak amplitude of that unit's mean waveform. Noise amplitude for each 3 min recording session was calculated as two times the standard deviation of the background electrophysiological activity after time windows containing spikes and artifacts were removed. Standard deviation of the background activity without spikes was estimated using the median of the absolute deviation of the voltage divided by 0.6745—an efficient metric equivalent to one standard deviation for Gaussian distributions [88, 89]. Signal-to-noise ratio for each sorted unit was that unit's signal amplitude divided by the noise amplitude calculated for that channel. Units with an SNR less than 3 were excluded from analysis.
Prior to spike detection and sorting, artifacts were removed from the recorded data by a reviewer blinded to the animal, test condition, and post-op day. For consistency, the same person reviewed all data files in random order. Voltage traces for all electrode channels (bandpass filtered 300–3000 Hz) were common average referenced and viewed to identify and exclude specific brief sections of time containing obvious large artifacts (e.g. from the mouse shaking its head or the cable hitting the edge of the testing chamber). The reviewer identified a time segment as an artifact if it contained a sudden large spike in voltage (typically >20 times the background noise) that appeared across most or all channels simultaneously. For each detected artifact, an additional 1 s window on either side of the visually-identified artifact was also excluded to ensure any remaining vibrations in the cable/connector were also excluded from the analysis. In total, 2.6% of the recording data was removed in this step.
Additionally, individual days of recording were removed from analysis by the blinded reviewer in cases of obvious recording problems. Specifically, drips from the animal's water bottle sometimes shorted channels to ground creating extremely low voltages or the connector would start coming loose during recording creating a very large increase in noise across the channels. Bedding and debris in the connector was a likely cause of the headstage connector sometimes not fitting properly and becoming loose during recording. In total 9.7% of the recording days were entirely removed from analysis and these were randomly distributed across time and animal group.
On occasion, smaller bits of debris would get in the connector preventing good contact with the headstage on just one or a few channels as indicated by extremely large amplitude noise on individual channels. Overall, 3.8% of individual channels falling in the 'best eight' range (see below) were excluded from analysis due to poor connections, and these were randomly distributed across channels, days, and animal groups.
2.5. Identification of channels in recordable layers
Since the 16 recording channels spanned cortical layers I–V, some of the channels were in cortical layers that did not have significant neural cell bodies from which to record action potentials. Including channels from non-spiking cortical layers would unnecessarily dilute the neural recording metrics. Therefore, only a subset of eight sequential channels was used in the analysis. Specifically, for each animal, the eight sequential channels that had the highest number of sorted units where used (calculated as unit counts for each channel averaged across all time points and then summed across eight sequential channels). The occasional days and/or channels excluded due to artifacts did not contribute to the average across time when calculating the best eight. Once determined, the best eight channels were fixed across all time points and did not shift if a channel was dropped on a given day. Instead, daily performance metrics were defined in a way where the occasional channel drop out would not systematically skew the results (e.g. percentage of working channels with detectable units; average number of sorted units per working channel).
As expected, the 'best eight' sequential channels for each mouse included primarily the deeper channels. These channels excluded the upper acellular layers and encompassed layer V, which has the largest cells with the most prevalent action potentials. Note, there was some inevitable variability in insertion depth due to difficulty visualizing when the hair thin electrode tip first contacted the cortical surface and due to variability of the thickness of the fluid layer within the craniotomy. Using the numbering scheme with the deepest channel labelled as one and the shallowest channel as 16, the deepest channel in the 'best eight' range had a median channel number of 1, mean of 2.2, mode of 1, and maximum of 7 across all mice indicating the best eight were primarily in the deeper layers.
2.6. Approximation of best 8 channel slice depth
The approximate depth of the tissue sections was estimated by counting the number of slices between the first slice where the probe hole appears to the current slice and multiplying by slice thickness (16 µm). The depth of the electrode was estimated by counting the number of slices between the first slice where the probe hole appears and the last slice where the probe hole appears and multiplying by slice thickness. The depth boundaries of the best 8 channels were estimated using the approximate depth of the electrode and subtracting the distance from the tip to the deepest and shallowest of the best 8 channels. Distances between channels and the tip were estimated using the tip length (50 µm), the contact to contact distance (50 µm), and the number of contacts between the tip and the best 8 range boundaries. A range spanning from approximately 50 µm above the top channel to 50 µm below the bottom of the best 8 channels was included in immunohistochemical analysis.
Unfortunately, due to the variability in curvature of the brain due to exact electrode placement, difference in the % swelling of the tissue during fixation, and difference in the extent of tissue lost at the top of the brain during sectioning, it is difficult to provide the mean and standard deviation with quantitative certainty. Therefore, specific electrode depth should be considered a confounding factor when interpreting the data.
2.7. Recording statistics
Recording data was statistically evaluated using a general linear model in Minitab with time and treatment group (CD14 or WT; IAXO-101 or WT) as fixed factors. Time was grouped into two ranges, acute (weeks 1–2, days 0–11) and chronic (weeks 3–16, days 16–109) to represent different phases of the neuroinflammatory response to implanted intracortical microelectrodes [90, 91]. Individual mouse was nested within treatment as a random factor to account for repeated measures. Treatment group, time range, mouse, and the interaction between time range and treatment group (i.e. treatment group * time range) were used as terms in the model. Combinations of treatment group and time range were compared using mean and 95% confidence interval calculated by the statistical software program R [92, 93]. Two groups with 95% confidence intervals calculated from a general linear model that did not overlap were considered statistically different.
2.8. Tissue processing
Mice were sacrificed via transcardial perfusion following similar methods to Ravikumar et al 16 weeks after microelectrode implantation [58]. Mice were anesthetized using 0.5 ml of a ketamine-xylazine solution (10 mg ml−1 ketamine, 1 mg ml−1 xylazine) and transcardially perfused with 1 × PBS to clear blood from the mouse. Next 4% formaldehyde from paraformaldehyde in 1 × PBS was perfused through the mouse for 10 min to fix the brain.
After perfusion, the mouse head was removed and stored in 4% formaldehyde in 1 × PBS for 24–48 h at 4 °C to post-fix the brain. Then, the microelectrode array was carefully pulled straight up out of the brain and the brain was gently removed from the skull. (Several labs have indicated that tissue is removed with the electrode, and remains adhered to the implant. Since the tissue adhered to the implant cannot be quantified, or pieced back into images of the hole to determine the extent of missing tissue, it is common practice to define the hole edge as the implant tissue interface.) The brain was cryoprotected using a gradient of 10%, 20%, and 30% sucrose solutions in 1 × PBS until the brain equilibrated at 4 °C. Brains were frozen in optimal cutting temperature (OCT) gel on dry ice and transferred to a −80 °C freezer. Horizontal sections of brain tissue were sliced 16 µm thick at roughly −20 to −25 °C and immediately mounted on microscope slides. Mounted microscope slides were set out at room temperature overnight and transferred to a −80 °C freezer until staining.
2.9. Immunohistochemistry
Slices of mouse cortical tissue were stained by immunohistochemistry methods adapted from Ravikumar et al [61]. Full details of immunohistochemistry methods are included in supplemental section S1.3 (stacks.iop.org/JNE/15/025002/mmedia). Tissue sections were blocked for 1 h at room temperature using blocking buffers containing 4% serum (chicken or goat) and 0.3% Triton-X 100 in 1 × PBS. Staining targets, antigens, primary antibodies, secondary antibodies, and antibody concentrations are summarized in table 1. Tissue sections were incubated in primary antibody solutions overnight at 4 °C. Secondary antibody solutions were incubated for 2 h at room temperature. Tissue autofluorescence was dampened through treatment with a copper sulfate solution [94]. Tissue sections were mounted with Fluoromount-G (SouthernBiotech) and cover slipped. Tissue sections were allowed to dry and subsequently stored at 4 °C.
Table 1. Summary of immunohistochemistry targets, antigens, antibodies, and concentrations.
| Target | Antigen | 1° Antibody | Concentration | 2° Antibody | Concentration |
|---|---|---|---|---|---|
| Neurons | NeuN | Millipore MAB377 | 05:10:00 AM | Thermo Fisher Scientific A21121 | 05:40:00 PM |
| Astrocytes | GFAP | Neuromics RA22101 | 09:20:00 AM | Thermo Fisher Scientific A11012 | 05:40:00 PM |
| Activated microglia/macrophages | CD68 | Abcam ab53444 | 09:20:00 AM | Thermo Fisher Scientific A21470 | 05:40:00 PM |
| Extravasated blood proteins | IgG | AbD Serotec STAR26B | 09:20:00 AM | Thermo Fisher Scientific A21442 | 05:40:00 PM |
2.10. Fluorescent microscopy
Fluorescent images of mouse cortical tissue stained with immunohistochemical markers were captured using an inverted fluorescence microscope (Zeiss AxioObserver Z1) using similar methods as Potter et al [94]. The images were centered on the microelectrode hole and 4 by 4 mosaic tiles of 10 × images were captured. The mosaic tiles were stitched together and the final images were exported as 16 bit tiff files. Exposure times were kept constant for each stain quantified.
2.11. Quantification of immunohistochemical markers
Histological images were analyzed using a combination of custom-built Matlab GUIs that leverage the Image Processing Toolbox. We have previously published analyses with the program MINUTE to analyze histological images of neuroinflammation [61, 94, 95]. Here, we used an updated version of the Matlab GUI named SECOND. Differences between MINUTE and SECOND are elucidated in the supplemental section S1.4. The fluorescence intensity of a given IHC stain was measured as a function of distance from the edge of the explanted microelectrode track [94]. Mean pixel intensities were calculated within concentric rings spaced at 5 µm distance intervals from the hole. For continuous staining the response as a function of distance is normalized to the background expression level defined at 600–650 µm away from the hole. For stains with constitutive expression (e.g. GFAP), normalization is set to one, whereas for non-natively expressed stains in the brain (e.g. IgG) normalization is set to zero. The fluorescence intensity of three to six tissue sections from the cortex at the approximate depth of the best 8 channels were averaged together for each animal.
2.12. Quantification of neuronal density
Neuronal density was assessed with an in-house Matlab code called AfterNeuN. After defining the implant hole, tissue edges, and tissue artifacts with SECOND, a blinded user clicked the position of every NeuN-positive cell out to 550 µm from the microelectrode hole. The program quantified the minimum distance of each click from the edge of the microelectrode hole and number of clicks within 50 µm concentric bins out to 550 µm from the microelectrode hole. Counts were divided by bin area to assess neuronal density. Density values were divided by neuronal density in the 500–550 µm to assess percentage of background neuronal density. The percentage of background neuronal density of three to six tissue sections from the cortex at the approximate depth of the best 8 channels were averaged together for each animal.
2.13. Immunohistochemistry statistics
The normalized fluorescence intensity of 50–100 µm bins was compared between groups using General Linear Model ANOVA in the software program Minitab. The average normalized fluorescence intensity of the 3–6 slices from each animal was treated as an independent measurement.
2.14. Neuronal density statistics
The percentage of background density values of 50 µm bins were compared between groups using General Linear Model ANOVA in the software program Minitab. The average percentage of background density of the 3–6 slices from each animal was treated as an independent measurement. Additionally, neuronal densities were compared against background densities. The neuronal densities of 50 µm bins were compared against the background bin (500–550 µm) groups using General Linear Model ANOVA in the software program Minitab. The average neuronal density of the 3–6 slices from each animal was treated as an independent measurement.
3. Results
3.1. Recording performance of intracortical microelectrodes in Cd14−/− mice
The number of single units detected per working channel, percentage of working channels detecting single units, single unit signal to noise ratio (SNR), single unit amplitude, and noise were metrics plotted versus time to compare recording performance between Cd14−/− and wildtype mice implanted with identical NeuroNexus microelectrodes. Statistical comparisons were made between treatment groups (Cd14−/− versus wildtype for entire study length as a whole; ξ indicates significance), time range (acute versus chronic for both conditions together, as a metric of change over time; @ indicates significance), and the interaction between animal group and time range (i.e. animal group crossed with time range). For animal group crossed with time range, we will only discuss relevant comparisons, namely: (1) Cd14−/− acute versus Cd14−/− chronic; $ indicates significance, (2) wildtype acute versus wildtype chronic; % indicates significance, (3) Cd14−/− acute versus wildtype acute; * indicates significance, and (4) Cd14−/− chronic versus wildtype chronic; δ indicates significance. The acute time range includes the first two weeks of recording (days 0–11) [91], and the chronic time range includes the third through sixteenth weeks of recording (days 16–109) [14]. P values are summarized in table 2. P values are unavailable for the comparisons of combinations of treatment group and time range, so >0.05 and <0.05 are listed to represent overlapping and non-overlapping 95% confidence intervals, respectively.
Table 2. Statistical summary of the recording performance metrics compared between Cd14−/− and WT mice. P-values are shown for differences between the various subcategories assessed in the general linear model. Significant values <0.05 are highlighted in bold.
| Comparison | Symbol | Units per Channel | Channels Detecting Single Units | SNR | Single Unit Amplitude | Noise |
|---|---|---|---|---|---|---|
| Treatment (Cd14−/− versus WT) | x | 0.074 | 0.148 | 0.013 | 0.059 | 0.332 |
| Time range (acute versus chronic) | @ | < 0.001 | < 0.001 | < 0.001 | 0.249 | 0.005 |
| Treatment * time range | < 0.001 | < 0.001 | 0.012 | 0.009 | < 0.001 | |
| Acute Cd14−/− versus acute WT | * | < 0.05 | < 0.05 | < 0.05 | >0.05 | >0.05 |
| Chronic Cd14−/− versus chronic WT | $ | >0.05 | >0.05 | >0.05 | >0.05 | >0.05 |
| Acute Cd14−/− versus chronic Cd14−/− | δ | < 0.05 | < 0.05 | < 0.05 | >0.05 | >0.05 |
| Acute WT versus chronic WT | % | >0.05 | >0.05 | >0.05 | >0.05 | >0.05 |
3.1.1. Number of single units per working channel for intracortical microelectrodes in Cd14−/− mice and wildtype controls.
The number of units per working channel is displayed as mean ± standard error for Cd14−/− (N = 6–9) and wildtype mice (N = 3–5) over a 16 week time range (figure 1(A)). A full breakdown of daily sample size is located in table S1. When comparing the entire time range of the study, the number of units per working channel was not significantly different between Cd14−/− mice and wildtype mice (table 2). However, there was a significant difference (p < 0.001) when comparing the acute versus chronic time ranges, irrespective of the animal condition (figure 1(A), @ indicates significance; table 2). As a whole, more units were detected at acute than chronic time points, indicating a decay in the quantity of obtained signal with time. The same trend of more units detected per channel at acute time points was seen for Cd14−/− mice ($, p < 0.05), but not for wildtype mice (figure 1(A); table 2), which started lower than Cd14−/− mice. Additionally, Cd14−/− mice exhibited a significantly higher (* p < 0.05) number of units per working channel than wildtype mice over the acute time range (table 2). However, the number of units per channel for Cd14−/− mice and wildtype mice were similar over the chronic time range (weeks 3–16, figure 1(A); table 2). Finally, of note, the interaction between animal condition and time range factors was significant (p < 0.001, table 2).

Figure 1. Recording performance of intracortical microelectrodes in Cd14−/− mice versus wildtype mice. The number of single units detected per working channel (A), percentage of working channels detecting single units (B), single unit SNR (C), single unit amplitude (D), and noise (E) were plotted versus time, to compare recording performance between Cd14−/− mice and wildtype mice implanted with identical NeuroNexus microelectrodes. Statistical comparisons were made as a function of time and treatment condition, both within and across groups. N for each plot varies and can be found in the text for the corresponding section. Statistical comparisons were made between treatment groups (Cd14−/− versus wildtype for entire study length as a whole; ξ indicates significance), time range (acute versus chronic for both conditions together, as a metric of change over time; @ indicates significance), and treatment group crossed with time range. For treatment group crossed with time range, we will only discuss relevant comparisons, namely: (1) Cd14−/− acute versus Cd14−/− chronic; $ indicates significance, (2) wildtype acute versus wildtype chronic; % indicates significance, (3) Cd14−/− acute versus wildtype acute; * indicates significance, and (4) Cd14−/− chronic versus wildtype chronic; δ indicates significance.
Download figure:
Standard image High-resolution image3.1.2. Percentage of channels detecting single units for intracortical microelectrodes in Cd14−/− mice and wildtype controls.
The percentage of channels detecting single units is displayed as mean ± standard error for Cd14−/− (N = 6–9) and wildtype mice (N = 3–5) over a 16 week time range (figure 1(B)). A full breakdown of daily sample size is located in table S1. When comparing the entire time range of the study, the percentage of channels detecting single units was not significantly different between Cd14−/− mice and wildtype mice (table 2). However, there was a significant difference (p < 0.05) when comparing the acute versus chronic time ranges, irrespective of the animal condition (figure 1(B), @ indicates significance; table 2). As a whole, a higher percentage of channels were detecting single units at acute than chronic time points, again indicating a decay in the quantity of obtained signal with time (table 2). The same trend of a higher percentage of channels detecting single units at acute time points than chronic time points was seen for Cd14−/− mice ($, p < 0.05), but not for wildtype mice (figure 1(B); table 2). In addition, Cd14−/− mice exhibited a significantly higher (* p < 0.05) percentage of channels detecting single units than wildtype mice over the acute time range (table 2). However, the percentage of channels detecting single units for Cd14−/− mice and wildtype mice were similar over the chronic time range (weeks 3–16, figure 1(B); table 2). Finally, the interaction between animal condition and time range factors was significant (p < 0.001, table 2).
3.1.3. SNR for intracortical microelectrodes in Cd14−/− mice and wildtype controls.
Single unit SNR is displayed as mean ± standard error for Cd14−/− (N = 4–9) and wildtype mice (N = 1–5) over a 16 week time range (figure 1(C)). A full breakdown of daily sample size is located in table S2. SNR was significantly higher (p < 0.05) in Cd14−/− mice than in wildtype mice across the entire time range of the study (figure 1(C); ξ indicates significance; table 2). There was also a significant difference (p < 0.001) when comparing the acute versus chronic time ranges, irrespective of the animal condition (figure 1(C), @ indicates significance; table 2). SNR was overall significantly higher over the acute time range than over the chronic time range (table 2). Specifically, SNR decreased significantly ($ p < 0.05) for Cd14−/− mice from the acute time range to the chronic time range (figure 1(C); table 2) and SNR remained consistent for wildtype mice between the acute and chronic time ranges (figure 1(C); table 2). The SNR was significantly higher (p < 0.05) for Cd14−/− mice than for wild type mice over the acute time range (figure 1(C); * indicates significance; table 2). However, SNR was similar between Cd14−/− mice and wildtype mice over the chronic time range. Finally, the interaction between animal condition and time range factors was significant (p < 0.05, table 2).
3.1.4. Single unit amplitude for intracortical microelectrodes in Cd14−/− mice and wildtype controls.
Single unit amplitude is displayed as mean ± standard error for Cd14−/− (N = 4–9) and wildtype mice (N = 1–5) over a 16 week time range (figure 1(D)). A full breakdown of daily sample size is located in table S2. When comparing the entire time range of the study, single unit amplitude was not significantly different between Cd14−/− mice and wildtype mice (table 2). When comparing the acute versus chronic time ranges for single unit amplitude, irrespective of the animal condition, overall acute and chronic time ranges were not significantly different (figure 1(D); table 2). Further, Cd14−/− and wildtype mice did not exhibit any significant changes from the acute range to the chronic time range (table 2). Finally, there were no significant differences in the single unit amplitude for Cd14−/− versus wildtype mice at either the acute or chronic time intervals (table 2).
3.1.5. Noise for intracortical microelectrodes in Cd14−/− mice and wildtype controls.
Noise is displayed as mean ± standard error for Cd14−/− (N = 6–9) and wildtype mice (N = 3–5) over a 16 week time range (figure 1(E)). A full breakdown of daily sample size is located in table S1. When comparing the entire time range of the study, noise was not significantly different between Cd14−/− and wildtype mice (figure 1(E); table 2). However, there was also a significant difference (p < 0.01) between the acute and chronic time ranges, irrespective of the animal condition (figure 1(E), @ indicates significance; table 2). Specifically, noise was overall significantly higher (@ p < 0.01) over the chronic time group than over the acute time group (table 2). Despite this, neither the Cd14−/− mice nor the wildtype mice exhibited any significant changes from the acute range to the chronic time range (figure 1(E); table 2). Finally, there were also no significant differences between Cd14−/− mice and wildtype mice at either the acute or chronic time point (figure 1(E); table 2).
3.2. Recording performance of intracortical microelectrodes in wildtype mice administered IAXO-101
Recording performance for wildtype mice administered IAXO-101 was presented in a similar format to the mice in section 3.1 and figure 1. Once again, the number of single units detected per working channel, percentage of working channels detecting single units, single unit SNR, single unit amplitude, and noise were plotted versus time to compare recording performance between wildtype mice receiving IAXO-101, compared to control wildtype mice not receiving IAXO-101. Here, mice were implanted with identical NeuroNexus microelectrodes to the above section. Untreated wildtype animals displayed here are the same animals used as controls above. Statistical comparisons were made between treatment groups (wildtype mice administered IAXO-101 versus wildtype for entire study length as a whole; ξ indicates significance), time range (acute versus chronic for both conditions together, as a metric of change over time; @ indicates significance), and animal group crossed with time range. For animal group crossed with time range, we will discuss: (1) wildtype mice administered IAXO-101 acute versus wildtype mice administered IAXO-101 chronic; $ indicates significance, (2) wildtype acute versus wildtype chronic; % indicates significance, (3) wildtype mice administered IAXO-101 acute untreated wildtype acute; * indicates significance, and (4) wildtype mice administered IAXO-101 chronic versus untreated wildtype chronic; δ indicates significance. As used above, the acute time range includes the first two weeks of recording (days 0–11) [91], and the chronic time range includes the third through sixteenth weeks of recording (days 16–109) [14]. P values are summarized in table 3. P values are unavailable for the comparisons of combinations of treatment group and time range, so >0.05 and <0.05 are listed to represent overlapping and non-overlapping 95% confidence intervals, respectively.
Table 3. Statistical summary of the recording performance metrics compared between IAXO-101 and WT mice. P-values are shown for differences between the various subcategories assessed in the general linear model. Significant values <0.05 are highlighted in bold.
| Comparison | Symbol | Units per channel | Channels detecting single units | SNR | Single unit amplitude | Noise |
|---|---|---|---|---|---|---|
| Treatment (IAXO-101 versus WT) | x | 0.068 | 0.047 | 0.159 | 0.007 | 0.004 |
| Time range (acute versus chronic) | @ | 0.65 | 0.601 | 0.007 | 0.739 | < 0.001 |
| Treatment * time range | 0.078 | 0.257 | 0.106 | 0.269 | 0.982 | |
| Acute IAXO-101 versus acute WT | * | >0.05 | >0.05 | >0.05 | < 0.05 | < 0.05 |
| Chronic IAXO-101 versus chronic WT | $ | >0.05 | >0.05 | >0.05 | < 0.05 | < 0.05 |
| Acute IAXO-101 versus chronic IAXO-101 | δ | >0.05 | >0.05 | >0.05 | >0.05 | >0.05 |
| Acute WT versus chronic WT | % | >0.05 | >0.05 | >0.05 | >0.05 | >0.05 |
3.2.1. Number of single units per working channel for intracortical microelectrodes in mice administered IAXO-101 and wildtype controls.
The number of units per working channel is displayed as mean ± standard error for mice administered IAXO-101 (N = 3–5) and wildtype mice (N = 3–5) over a 16 week time range (figure 2(A)). A full breakdown of daily sample size is located in table S1. When comparing the entire time range of the study, the number of units per working channel was not significantly different between mice receiving IAXO-101 and wildtype mice (table 3). There were also no significant differences when comparing the acute versus chronic time ranges, irrespective of the animal condition (table 3). The same lack of significance was noted for both wildtype mice administered IAXO-101 and wildtype mice not receiving IAXO-101, when comparing acute versus chronic units per working channel, within a treatment group (table 3). Finally, there were no significant difference noted at a given time interval, across treatment group (table 3).
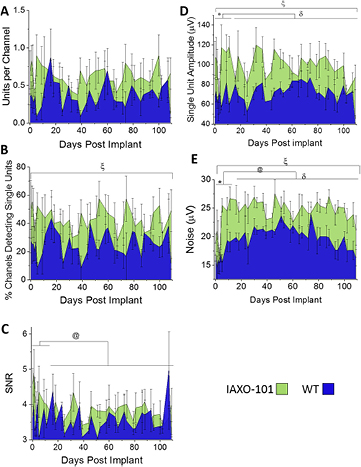
Figure 2. Recording performance of intracortical microelectrodes in wildtype mice treated with IAXO-101 versus untreated wildtype mice. The number of single units detected per working channel (A), percentage of working channels detecting single units (B), single unit SNR (C), single unit amplitude (D), and noise (E) were plotted versus time, to compare recording performance between wildtype mice administered IAXO-101 (green) mice and wildtype mice (blue) implanted with identical NeuroNexus microelectrodes. Statistical comparisons were made as a function of time and treatment condition, both within and across groups. N for each plot varies and can be found in the text for the corresponding section. Statistical comparisons were made between treatment groups (IAXO-101 versus wildtype for entire study length as a whole; ξ indicates significance), time range (acute versus chronic for both conditions together, as a metric of change over time; @ indicates significance), and treatment group crossed with time range. For treatment group crossed with time range, we will only discuss relevant comparisons, namely: (1) IAXO-101 acute versus IAXO-101 chronic; $ indicates significance, (2) wildtype acute versus wildtype chronic; % indicates significance, (3) IAXO-101 acute versus wildtype acute; * indicates significance, and (4) IAXO-101 chronic versus wildtype chronic; δ indicates significance.
Download figure:
Standard image High-resolution image3.2.2. Percentage of channels detecting single units for intracortical microelectrodes in mice administered IAXO-101 and wildtype controls.
The percentage of channels detecting single units is displayed as mean ± standard error for mice administered IAXO-101 (N = 3–5) and wildtype mice (N = 3–5) over a 16 week time range (figure 2(B)). A full breakdown of daily sample size can be found in table S1. When comparing the entire time range of the study, the percentage of channels detecting single units was significantly higher for mice administered IAXO-101 than untreated wildtype mice (p < 0.05; figure 2(B), ξ indicates significance; table 3). However, there was no significant difference comparing the acute versus chronic time ranges, irrespective of the animal condition (table 3). There was also a lack of significance for both wildtype mice administered IAXO-101 and wildtype mice not receiving IAXO-101, when comparing acute versus chronic percent channels detecting single units, within a treatment group (table 3). Finally, there were also no significant difference noted at a given time interval, across treatment group (table 3). In summary, statistical breakdowns of subsets of comparisons failed to identify statistical significance, but the data set as a whole between treatment conditions demonstrated a significant improvement in recording performance metric for IAXO-101 treatment.
3.2.3. SNR for intracortical microelectrodes in mice administered IAXO-101 and wildtype controls.
Single unit SNR is displayed as mean ± standard error for mice administered IAXO-101 (N = 2–5) and wildtype mice (N = 1–5) over a 16 week time range (figure 2(C)). A full breakdown of daily sample size can be found in table S2. SNR was not significantly different between wildtype mice receiving IAXO-101 and wildtype mice across the entire time range of the study (table 3). However, SNR was overall significantly higher ($ p < 0.01) over the acute time group than over the chronic time group, irrespective of the animal condition (figure 2(C), @ indicates significance; table 3). Within a treatment group, neither mice receiving IAXO-101 or untreated wildtype mice demonstrated a significant difference for acute SNR versus chronic SNR, within the treatment condition (table 3). Finally, SNR was statistically insignificant between treatment groups at both the acute and chronic time intervals (table 3).
3.2.4. Single unit amplitude for intracortical microelectrodes in mice administered IAXO-101 and wildtype controls.
Single unit amplitude is displayed as mean ± standard error for mice administered IAXO-101 (N = 2–5) and wildtype mice (N = 1–5) over a 16 week time range (figure 2(D)). A full breakdown of daily sample size can be found in table S2. Single unit amplitude was significantly higher (ξ p < 0.05) in wildtype mice receiving IAXO-101 compared to untreated wildtype mice across the entire time range of the study (table 3). The single unit amplitude was overall not significantly different between the acute time group and the chronic time group, irrespective of the animal condition (table 3). This was not unexpected, seeing as though there were no significant changes from acute to chronic time groupings for either of the two treatment groups (table 3). However, animals treated with IAXO-101 displayed a significantly higher single unit amplitude than untreated wildtype animals at both acute (p < 0.05, *indicates significance) and chronic time intervals (p < 0.05, δ indicates significance) (table 3).
3.2.5. Noise for intracortical microelectrodes in mice administered IAXO-101 and wildtype controls.
Noise is displayed as mean ± standard error for mice administered IAXO-101 (N = 3–5) and wildtype mice (N = 3–5) over a 16 week time range (figure 2(E)). A full breakdown of daily sample size can be found in table S1. Noise is significantly higher (ξ p < 0.005) in mice administered IAXO-101 versus untreated wildtype mice, over entire time range of the study (table 3). Noise was overall significantly higher (c p < 0.001) over the chronic time group than over the acute time group, irrespective of the animal treatment condition (figure 2(E); table 3). However, there were no significant differences in noise levels between acute or chronic time intervals for either treatment groups (table 3). Statistical comparison also revealed that mice administered IAXO-101 displayed significantly higher noise levels than untreated wildtype mice (p < 0.05) at both the acute (* indicates significance) and chronic (δ indicates significance) time intervals (table 3).
3.3. Immunohistochemical evaluation of Cd14−/− mice implanted with intracortical microelectrodes
3.3.1. Neuronal nuclei.
It is believed that neuronal cell bodies must be within the first 50 to 140 µm of the intracortical microelectrode in order to maintain recordings of single unit action potentials from individual neurons [22]. Therefore, we quantified the number of neurons around the implants utilizing the NeuN antibody, which selectively stains for neuronal nuclei [96]. Here, neuronal survival at the microelectrode-tissue interface was evaluated as percentage of background density with respect to distance from the hole left from explanted the microelectrode hole (µm) (figure 3(A)) [91]. Both Cd14−/− mice (N = 9) and wildtype mice (N = 5) exhibit trends of decreased neuronal survival close to the microelectrode hole with a gradual increase in neuronal survival approaching background density. The percentage of background density is only significantly different between Cd14−/− and wildtype mice between 450 and 500 µm from the microelectrode hole, * p < 0.05. Despite trends of higher neuronal survival in Cd14−/− mice from 0 to 450 µm, there are no additional significant differences between Cd14−/− and wildtype. Neuronal density is significantly different from background for Cd14−/− mice between 0 and 50 µm from the microelectrode hole, # p < 0.05. Despite trends of neuronal dieback out to 350 µm from the microelectrode hole, neuronal survival for wildtype mice is not significantly different from background.
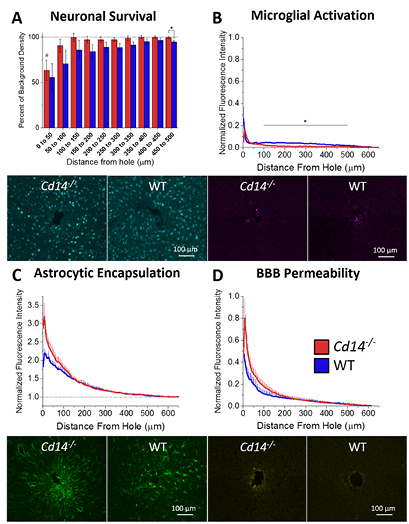
Figure 3. Immunohistochemical evaluation of Cd14−/− mice implanted with intracortical microelectrodes. (A) Neuronal survival at the microelectrode-tissue interface evaluated as percentage of background density with respect to distance from the microelectrode hole (µm). The percentage of background density is significantly different between Cd14−/− and wildtype mice between 450 and 500 µm from the microelectrode hole, * p < 0.05. Neuronal density is significantly different from background for Cd14−/− mice between 0 and 50 µm from the microelectrode hole, # p < 0.05. (B) Astrocytic encapsulation evaluated as GFAP activation with respect to distance from the microelectrode hole (µm). No significant differences were observed between Cd14−/− and wildtype mice. (C) Microglial activation evaluated as CD68 expression with respect to distance from the microelectrode hole (µm). Cd14−/− mice express significantly less CD68 between 100 and 500 µm from the microelectrode hole. (D) BBB permeability evaluated as IgG expression with respect to distance from the microelectrode hole. No significant differences were observed between Cd14−/− and wildtype mice. Cd14−/−: N = 9; wildtype: N = 5.
Download figure:
Standard image High-resolution image3.3.2. Astrocytes.
Glial fibrillary acidic protein (GFAP) was used to assess both immature and mature resting or activated astrocytes [97]. Here, astrocytic encapsulation was evaluated as GFAP activation with respect to distance from the microelectrode hole (figure 3(B)). Both Cd14−/− (N = 9) and wildtype mice (N = 5) exhibit elevated GFAP expression close to the microelectrode hole with decaying expression further away from the microelectrode hole. No significant differences were observed between Cd14−/− and wildtype mice, regardless of the distance from the microelectrode surface.
3.3.3. Activated microglia and macrophages.
Microglia/macrophages are a major component of the innate immune response in the CNS. Microglia/macrophage-released inflammatory factors sustain the innate immune/inflammatory response and recruit additional cell types. CD68 is a cytoplasmic antigen found in the lysosomal compartment of activated microglia and macrophages [98]. Microglial activation at the microelectrode-tissue interface was evaluated as CD68 expression with respect to distance from the microelectrode hole (figure 3(C)). Both Cd14−/− (N = 9) and wildtype mice (N = 5) exhibit elevated CD68 expression close to the microelectrode hole with decaying expression further away from the microelectrode hole. Cd14−/− mice express significantly less CD68 between 100 and 500 µm from the microelectrode hole. No significant differences were seen within the first 100 µm from the microelectrode hole.
3.3.4. BBB permeability.
Several labs have utilized the amount of IgG present within the tissue surrounding explanted microelectrodes to assess the integrity of the BBB [21, 95]. Therefore, here, the BBB permeability was evaluated as IgG expression with respect to distance from the microelectrode hole (figure 3(D)). Both Cd14−/− (N = 9) and wildtype mice (N = 5) exhibit elevated IgG expression close to the microelectrode hole with decaying expression further away from the microelectrode hole. No significant differences were observed between Cd14−/− and wildtype mice.
3.4. Immunohistochemical evaluation of mice administered IAXO-101 and implanted with intracortical microelectrodes
3.4.1. Neuronal nuclei.
Neuronal survival at the microelectrode-tissue interface was evaluated as percentage of background density with respect to distance from the microelectrode hole (figure 4(A)). Both mice administered IAXO-101 (N = 5) and wildtype mice (N = 5) exhibit trends of decreased neuronal survival close to the microelectrode hole with a gradual increase in neuronal survival approaching background density. No significant differences were observed between mice administered IAXO-101 and wildtype mice or between either of the conditions and background.

Figure 4. Immunohistochemical evaluation of mice administered IAXO-101 and implanted with intracortical microelectrodes. (A) Neuronal survival at the microelectrode-tissue interface evaluated as percentage of background density with respect to distance from the microelectrode hole (µm). No significant differences were observed between mice administered IAXO-101 and wildtype mice or between either condition with background. (B) Astrocytic encapsulation evaluated as GFAP activation with respect to distance from the microelectrode hole (µm). No significant differences were observed between mice administered IAXO-101 and wildtype mice. (C) Microglial activation evaluated as CD68 expression with respect to distance from the microelectrode hole (µm). No significant differences were observed between mice administered IAXO-101 and wildtype mice. (D) BBB permeability evaluated as IgG expression with respect to distance from the microelectrode hole. No significant differences were observed between mice administered IAXO-101 and wildtype mice. IAXO-101, WT: N = 5.
Download figure:
Standard image High-resolution image
3.4.2. Astrocytes.
Astrocytic encapsulation was evaluated using positive GFAP activation/expression with respect to distance from the microelectrode hole. Both mice administered IAXO-101 (N = 5) and wildtype mice (N = 5) exhibit elevated GFAP expression close to the microelectrode hole with decaying expression further away from the microelectrode hole (figure 4(B)). No significant differences were observed between mice administered IAXO-101 and wildtype mice.
3.4.3. Activated microglia and macrophages.
Microglial activation was evaluated using positive CD68 expression with respect to distance from the microelectrode hole (figure 4(C)). Both mice administered IAXO-101 (N = 5) and wildtype mice (N = 5) exhibit elevated CD68 expression close to the microelectrode hole with decaying expression further away from the microelectrode hole. No significant differences were observed between mice administered IAXO-101 and wildtype mice.
3.4.4. BBB permeability.
BBB permeability was evaluated using positive IgG expression with respect to distance from the microelectrode hole. Both mice administered IAXO-101 (N = 5) and wildtype mice (N = 5) exhibit elevated IgG expression close to the microelectrode hole with decaying expression further away from the microelectrode hole (figure 4(D)). No significant differences were observed between mice administered IAXO-101 and wildtype mice.
4. Discussion
While strategies to improve intracortical microelectrode integration and performance by broadly inhibiting the neuroinflammatory response have demonstrated promising results, they have also been prone to harmful side effects [7, 41, 42]. Thus, in order to more safely inhibit microelectrode-induced neuroinflammation, we are investigating therapeutic approaches with cellular or subcellular specificity and have found CD14 to be a viable target. The CD14 molecule is an innate immunity receptor involved in the recognition of several PAMPs and DAMPs that may be present at the microelectrode tissue interface to promote inflammation [70, 72, 76–82]. In the present study, we examined the effects of inhibiting CD14 on intracortical microelectrode performance and tissue integration using both a knockout mouse model and systemic administration of a small molecule CD14 inhibitor.
Upon evaluation of electrophysiology, Cd14−/− mice exhibit higher numbers of units per channel and higher percentages of channels detecting single units over the acute range, but not the chronic time range (figure 1(A)/(B)). Cd14−/− mice exhibit higher single unit SNR over the entire time rage of the study and specifically during the acute time range (figure 1(C)). Further electrophysiological evaluation revealed that mice administered IAXO-101 exhibited significant improvements in the percentage of channels detecting single units and single unit amplitude over the entire time range of the study (figure 2(B)/(D)). Additionally, mice administered IAXO-101 exhibited significantly higher noise over the entire time range of the study (figure 2(E)).
Significant improvements in the number of single units per working channel and percentages of channels detecting single units in Cd14−/− mice suggest that the complete absence of CD14 improves recording quality over the first two weeks after implantation. Thus, CD14 may play a role in acute inflammatory mechanisms that are detrimental to recording performance. Enhanced inflammatory activation can potentially reduce neuronal survival, damage neuronal health, decrease neuronal firing, increase glial encapsulation, and facilitate microelectrode material breakdown [11, 14, 16]. Pro-inflammatory activation of CD14 has demonstrated detrimental effects on intracortical microelectrode recording quality and tissue integration in two studies. First, activation of CD14 via administration of its primary ligand LPS in a rat model led to reduced recording quality and neuronal survival [25]. Exacerbation of inflammation via LPS at the acute time point may account for the poor recording performance in wildtype mice at the acute time point. Cd14−/− mice would have a diminished inflammatory response to LPS [99], which could result in better recording performance. More recently, when comparing neural probe sterilization methods, we demonstrated that residual endotoxin levels coincided with greater neuronal dieback, microglial activation, astrocytic encapsulation, and BBB permeability at two weeks after implantation, but not 16 weeks after implantation [61]. However, in that study, ethylene oxide sterilized microelectrodes (same treatment used here) exhibited the lowest level of neuroinflammation even at acute time points.
LPS is not the only ligand of CD14 that may be contributing to detrimental recording performance as CD14 also recognizes DAMPs, or endogenous molecules released in the event of tissue injury [70]. CD14 plays in the recognition of HMGB1, heat shock proteins, apoptotic cells, and necrotic cells [70, 76–82]. Damage caused by the implantation and chronic presence of the microelectrode may produce several of these factors at the microelectrode-tissue interface [14, 24, 70, 78–80]. Additionally, CD14 is a co-receptor to several TLRs, which recognize other endogenous DAMPs, including fibrinogen, fibronectin and other endogenous molecules [44–46]. These proteins can be released into cortical tissue from vascular damage caused by the implantation and chronic presence of the implanted microelectrodes [8, 14, 61]. Activation of TLRs often involves the assistance of CD14 [53, 68–70]. Overall, a wide variety of ligands at the microelectrode tissue interface may activate CD14-mediated pathways to promote neuroinflammation, which can be detrimental to recording performance.
The lack of differences in the number of units per channel and percentages of channels detecting single units between Cd14−/− mice and wildtype mice suggests that CD14-independent inflammatory responses dominate at later time points, or that complete inhibition triggers the activation of a redundant pathway that is not activated with partial inhibition with IAXO-101.
Additionally, the Cd14−/− group exhibited significantly higher SNR over the entire time range of the study, in contrast to the number of units per working channel and percentage of channels detecting single units. Single unit SNR is only evaluated on channels detecting single units. Isolated units below SNR of 3 are excluded from analysis. If lower amplitude neurons die, stop firing, or become separated from the microelectrode by a glial scar, remaining large neurons close to a recording contact may dominate the metric, despite lower numbers of units or channels detecting units. SNR can be broken up into the influence of the signal and noise. Despite significant improvements in SNR, neither single unit amplitude nor noise exhibited significant changes in Cd14−/− mice from wildtype mice.
When comparing Cd14−/− and wildtype mice, the number of single units per working channel, percentage of channels detecting single units, and single unit SNR all exhibit significant decreases from acute to chronic time ranges irrespective of the animal condition. Upon examining combinations of time group and treatment group, Cd14−/− mice exhibit a significant decrease from the acute range to the chronic range. The decline in recording performance can be attributed to several phenomena, including but not limited to a decrease in the number of healthy, firing neurons within 50 µm of the microelectrode, increase of glial encapsulation around the microelectrode, increase of noise from various biological and electrical sources, or material breakdown of microelectrode and insulating components [9, 11, 22, 100, 101]. Neuronal dieback and glial encapsulation are evident in both treatment groups at 16 weeks after implantation (figure 3(A)/(B)). Histology was not evaluated at or before two weeks after implantation to determine the cause of the change in units per channel from acute to chronic. We and others have observed that rats implanted with neural probes exhibit significant neuronal dieback and elevated astrocytic encapsulation at two weeks after implantation [11]. Noise significantly increases from the acute to the chronic time point (figure 1(E)).
An overall increase in noise was shown from the acute time range to the chronic time range, but neither treatment group exhibited changes from the acute to the chronic time range. There were no differences between groups across the entire time range or within acute or chronic time ranges. Noise can arise from external electrical sources, high impedance tissue in the form of thermal noise, and biological sources such as muscle activity and nearby neuronal firing [100, 102–105]. Electrical noise sources should be similar among all mice since all recordings took place in the same environment with the same equipment. Biological noise consists primarily of the overlapping spiking activity from many distant neurons beyond 100–150 µm from the recording site [100, 106–108]. Large-scale changes in neuronal populations would likely be necessary to affect biological noise. Significant dieback of neurons in the environment around the implanted microelectrode could potentially affect biological noise [16, 91]. Neuronal loss would theoretically result in less biological noise, so other factors may describe the significant increase in overall noise from the acute to the chronic time point. Additionally, biological noise can vary with the location of the microelectrode in the brain and the degree of correlation between neuronal firing [100]. Variation in implantation site may affect the variation in noise level between mice. Thermal noise will vary based on the degree of encapsulation and thus can vary from mouse to mouse. With an increase in glial encapsulation around an implanted intracortical microelectrode over time [91], an increase in thermal noise over time would make sense.
It is noteworthy that mice administered IAXO-101 exhibited significant improvements in percentage of channels detecting single units over wildtype controls across the entire time range of the study. Attenuation of CD14 signaling promotes the ability to detect and resolve single unit activity over a 16 week time range. Fully intact CD14 signaling has a detrimental effect on the ability to detect single unit activity over the full 16 week time range. Attenuating CD14 with a small molecule antagonist improves recording over the entire time range (figure 2(A)) whereas the complete absence of CD14 in a knockout mouse only improves recording in the acute time range (figure 1(A)). Some degree of CD14 signaling in the chronic time range may be beneficial to detecting single unit activity. Perhaps CD14 is involved in wound healing mechanisms that promote a stable environment for single unit recordings.
Single unit SNR did not exhibit any differences between mice administered IAXO-101 and wildtype mice. However, there was an overall trend of decreasing SNR from the acute time range to the chronic time range as single unit SNR is affected by single unit amplitude and noise. Single unit amplitude did not exhibit any changes from the acute time range to the chronic time range, but noise exhibited a significant increase from the acute time range to the chronic time range. SNR decreased with increasing noise and constant amplitude. Additionally, single unit amplitude and noise were both significantly higher for mice administered IAXO-101. A similar increase in numerator and denominator of SNR resulted in no difference in SNR between mice administered IAXO-101 and wildtype mice.
Single unit amplitude was significantly higher in mice administered IAXO-101 than wildtype controls across the entire 16 week time range. High single unit amplitude suggests the presence of large, healthy, firing neurons in close proximity to the microelectrode contacts [22]. Perhaps small molecule inhibition of CD14 provides neuroprotective benefits. Pro-inflammatory activation of CD14 with LPS results in reduced neuronal survival at the microelectrode tissue interface [25, 61]. Mice administered IAXO-101 did not exhibit higher neuronal survival at the microelectrode tissue interface; however, histology is only evaluated at 16 weeks after implantation (figure 4(A)). Amplitude appears to drop in the 15th and 16th weeks, so neuronal survival may have been higher prior to this time point (figure 2(D)). High single unit amplitude may also suggest low impedance between the microelectrode and surrounding neurons as glial encapsulation increases impedance at the microelectrode tissue interface [10, 75]. Attentuation of CD14 signalling can reduce glial encapsulation. At 16 weeks after implantation, there were no significant differnces in astrocytic encapsulation between mice administered IAXO-101 and wildtype controls (figure 4(B)). Mice administered IAXO-101 exhibited a trend of increased astrocytic encapsulation and therefore we suggest that reduced encapsulation and impedance are not likely the cause(s) of improved single unit amplitude.
Mice administered IAXO-101 exhibited significantly higher noise across the entire 16 week time range. As discussed above, noise can be generated from several different sources, including external electrical sources, high impedance tissue in the form of thermal noise, and biological sources such as muscle activity and nearby neuronal firing [100, 102–105]. Although there is no significant difference in astrocytic encapsulation, mice administered IAXO-101 exhibited a trend of increased astrocytic encapsulation at 16 weeks after implantation. Elevated encapsulation may increase the level of thermal noise. Despite no significant differences in neuronal survival in mice administered IAXO-101 and wildtype mice, there is a trend of higher neuronal survival 50–100 µm away from the microelectrode hole. Biological noise is affected by neurons out to 100–150 µm from the microelectrode interface [70, 80–82].
Aditionally, there is an overall trend of increasing noise from the acute to the chronic time group. An increase in glial encapsulation around implanted miceloeleectrodes over time may lead to increased thermal noise to account for this trend [91, 103, 104, 109]. Potter et al demonstrated an increase in neuronal density around microelectrodes implanted in rats between two and four weeks after implantation [91]. Stabilization of neuronal populations beyond the limit of single unit detection (50 µm) after the acute inflammatory phase can lead to an increase in biological noise [70, 80–82].
Cd14−/− mice did not exhibit any changes in neuronal survival, astrocytic encapsulation, or BBB permeability. Compared to recording performance, complete removal of CD14 does not appear to have an effect at chronic time points. Endpoint histology was only evaluated at 16 weeks after implantation. Future studies evaluating histology around two weeks after microelectrode implantation should be more instructive about the mechanisms causing enhanced recording performance.
Cd14−/− mice exhibited significantly lower microglial activation over a range of 100–500 µm away from the microelectrode hole. This may indicate that without CD14, microglia become less likely to become pro-inflammatory activated due to hindered recognition of DAMPs and PAMPs at distances further away from the microelectrode interface [50–58]. These differences likely have minimal effect on the neurons close to the microelectrode interface. Again, histology evaluated within the first two weeks of implantation would be more instructive about mechanisms causing improved recording performance.
Mice administered IAXO-101 did not exhibit any significant differences versus controls for any of the investigated stains, despite improvements in recording performance over the full 16 week time range. Mice administered IAXO-101 exhibit better neuronal health, firing, or network connectivity, despite neuronal survival similar to wildtype controls. Additionally, the efficacy of the antibody NeuN in assessing neuronal cell loss has been disputed [110].
Overall Cd14−/− mice and mice administered IAXO-101 exhibited different trends compared to wildtype control mice. Cd14−/− mice exhibited higher numbers of units per channel and higher percentages of channels detecting single units at acute but not chronic time ranges. Mice administered IAXO-101 exhibited higher percentages of channels detecting single units across the entire time range but no significant differences in the number of units per channel. Cd14−/− mice exhibited higher SNR across the entire time range, whereas mice administered IAXO-101 exhibited no change in SNR. Cd14−/− mice exhibited no differences compared to wildtype mice for single unit amplitude and noise. Mice administered IAXO-101 exhibited significant increases over wildtype mice in both single unit amplitude and noise.
The main difference between Cd14−/− mice and mice administered IAXO-101, is that CD14 is completely absent from Cd14−/− mice. Mice administered IAXO-101 have intact CD14 and a portion of the administered drug will reach the environment around the implanted microelectrode. Some IAXO-101 will transiently bind with CD14 until it is cleared from the body. IAXO-101 is hypothesized to selectively target CD14 and competitively occupy the binding site for endotoxins and other ligands [84]. Binding of IAXO-101 with CD14 reduces the transfer of endotoxin to TLR4 and its associated co-receptor MD2 [84].The interaction between IAXO-101 and DAMPs is not well understood. Many CD14 receptors will remain unbound to IAXO-101 and binding of IAXO-101 with CD14 will be temporary. Thus, CD14 signaling should be attenuated, but not completely removed.
A limited amount of CD14 signaling may be beneficial for recording performance and tissue integration.CD14 may play a role in wound healing mechanisms that provide a stable interface for detecting single unit activity. Also, a limited amount of CD14 may be needed to protect the body against bacterial pathogens. Undetected bacteria may cause damage to neurons and supporting tissue before being cleared by other components of the immune system.
In order to obtain more consistent improvements in recording quality and tissue integration, other methods of inhibiting CD14 should be investigated. IAXO-101 (used here) is no longer the only CD14-TLR4 antagonist commercially available. Several other IAXO compounds have since been made available. IAXO-102, a similar glycolipid molecule with a different functional group, has demonstrated neuroprotective effects in a model for ALS [111]. Additionally, IAXO-102 has been demonstrated to inhibit the development of aortic aneurysms [111]. IAXO-102 has also demonstrated success in inhibiting cerebral vasospasm after subarachnoid hemorrhaging. In addition to small molecules, monoclonal antibodies to CD14 may me an effective method of inhibiting CD14 to improve microelectrode recording quality and tissue integration. CD14 monoclonal antibodies have been administered to healthy and diseased individuals in sepsis studies [112, 113]. The healthy individuals exhibited inhibition of LPS-induced gene expression, and the individuals with severe sepsis exhibited variable results that warranted further clinical investigation.
Full removal of CD14 exhibited time-dependent effects on recording performance. Limiting the expression of CD14 on specific cellular sub-populations may improve recording performance more effectively. Our lab has previously established methods of distinguishing blood-derived and resident inflammatory cells using a bone marrow chimera model [34], and are currently examining the effects of knocking out CD14 on blood derived inflammatory cells and/or resident brain inflammatory cells on intracortical microelectrode recording performance and tissue integration.
Alternatively, other innate immunity receptors that work with CD14 may play roles that are more significant in intracortical microelectrode failure. For example, CD14 coordinates ligand binding for TLR2 and TLR4 [30, 36–38]. TLR2 and TLR4 have been linked to a wider variety of DAMPs, and thus may have more opportunities to promote inflammation in response to the damage caused by intracortical microelectrodes [51]. Therefore, we are also currently examining the effects of knocking out TLR2 or TLR4 in the foreign body response to intracortical microelectrodes.
Finally, IAXO-101 is also commonly regarded as a TLR4 antagonist because it inhibits the CD14/TLR4 complex. Inhibiting other pathways associated with TLR4 may be more beneficial to recording quality and tissue integration. MD2 is another co-receptor to TLR4 involved in the recognition of LPS. MD2 focuses on PAMPs rather than DAMPs, and is the main pharmacological target for sepsis [70, 114]. If bacterial endotoxins prove to be more relevant to the microelectrode-tissue interface than DAMPs, targeting MD2 prove to be more beneficial. Other ligands to TLR4 that bind independently of CD14 and MD2 may also be involved in the foreign body response to intracortical microelectrodes. There are a growing number of synthetic and natural TLR4 antagonists, including derivatives of lipid A (a component of LPS), olive oil extracts, and curcumin [115]. In fact, we have previously shown that curcumin improves neuronal survival and BBB stability around implanted intracortical microelectrodes [66]. Unfortunately, no studies investigating the effect of curcumin on microelectrode recording performance have been carried out to this date.
5. Conclusions
Complete removal of CD14 results in improvements in intracortical microelectrode recording at acute, but not chronic time points post implantation. Complete removal of CD14 reduces microglial activation distant from the implanted microelectrode, but does not affect neuronal survival, astrocytic encapsulation, or BBB permeability at 16 weeks after implantation. Partial inhibition of CD14 signaling with a small molecule antagonist results in improved recording performance over a 16 week time range. Partial inhibition of CD14 with a small molecule antagonist did not affect neuronal survival, microglial activation, astrocytic encapsulation, or BBB permeability. Full removal of CD14 signaling is beneficial over the acute time range to attenuate inflammatory mechanisms, but some degree of CD14 signaling may be necessary over chronic time ranges to facilitate wound healing mechanisms. A better understanding of the mechanism and efficacy that facilitates CD14-mediated improvements in microelectrode recording performance should be completed to further improves therapeutic outcomes, and achieve more consistent improvements in microelectrode recording performance.
Acknowledgments
This work was supported in part by the Department of Biomedical Engineering and Case School of Engineering at Case Western Reserve University through laboratory start-up funds, the National Institute of Health, National Institute of Neurological Disorders and Stroke, (Grant # 1R01NS082404-01A1), the NIH Neuroengineering Training Grant 5T- 32EB004314-14. Additional support was provided by the Presidential Early Career Award for Scientists and Engineers (PECASE, JR. Capadona) and by Merit Review Award B1495-R from the United States (US) Department of Veterans Affairs Rehabilitation Research and Development Service. None of the funding sources aided in collection, analysis and interpretation of the data, in writing of the manuscript, or in the decision to submit the manuscript for publication. The authors have no conflict of interest related to this work to disclose. The contents do not represent the views of the US Department of Veterans Affairs or the United States Government.