

Abstract
Objective. Neural prostheses employing platinum electrodes are often constrained by a charge/charge-density parameter known as the Shannon limit. In examining the relationship between charge injection and observed tissue damage, the electrochemistry at the electrode-tissue interface should be considered. The charge-storage capacity (CSC) is often used as a predictor of how much charge an electrode can inject during stimulation, but calculating charge from a steady-state i-E curve (cyclic voltammogram) over the water window misrepresents how electrodes operate during stimulation. We aim to gain insight into why CSC predictions from classic i-E curves overestimate the amount of charge that can be injected during neural stimulation pulsing. Approach. In this study, we use a standard electrochemical technique to investigate how platinum electrochemistry depends on the potentials accessed by the electrode and on the electrolyte composition. Main results. The experiments indicate: (1) platinum electrodes must be subjected to a 'cleaning' procedure in order to expose the maximum number of surface platinum sites for hydrogen adsorption; (2) the 'cleaned' platinum surface will likely revert to an obstructed condition under typical neural stimulation conditions; (3) irreversible oxygen reduction may occur under neural stimulation conditions, so the consequences of this reaction should be considered; and (4) the presence of the chloride ion (Cl−) or proteins (bovine serum albumin) inhibits oxide formation and alters H adsorption. Significance. These observations help explain why traditional CSC calculations overestimate the charge that can be injected during neural stimulation. The results underscore how careful electrochemical examination of the electrode-electrolyte interface can result in more accurate expectations of electrode performance during applied stimulation.
Export citation and abstract BibTeX RIS
1. Introduction
Platinum has served as the go-to electrode material for neural stimulators because of its biocompatibility and long history of use in stimulating neural tissue for applications such as cochlear implants, deep brain stimulators, and spinal cord stimulators. Early on, neural prosthesis designers used platinum thinking it was an inert metal; serendipitously, it proved to be a reliable material that offered a relatively high charge-injection capability compared to many other biocompatible metals. However, for many devices, a limit has been imposed on platinum based on a charge/charge-density parameter first introduced by Shannon [1]. The Shannon limit intended to prevent stimulation at levels where unacceptable tissue damage may occur. The limit was based on observations of tissue damage from electrically-stimulated cat cortex by McCreery et al [2]. Although the underlying relationship between charge-injection level and observed tissue damage is not well understood, one important factor to consider is the production of electrochemical byproducts during stimulation. Researchers have investigated alternative electrode materials in order to stimulate tissue at higher magnitudes while avoiding certain electrochemical reactions presumed to be undesirable. Examples of these materials include iridium oxide, titanium nitride, tantalum oxide, carbon-based materials, rough or porous platinum/platinum–iridium, conductive polymers such as PEDOT and polypyrrole, and conductive hydrogels [3–15]. Very few of these alternative electrode materials have been successfully commercialized for a variety of reasons, including mechanical stability issues and lower charge capacity when applied to chronic implanted conditions [8, 16–19]. By developing a more precise understanding of the electron-transfer processes on platinum, it may be possible to raise the traditional charge-transfer constraints imposed by the Shannon limit.
In the 1970s, Barry Brummer brought to light the importance of electrochemistry to the neural stimulation community and introduced the idea of 'theoretical non-gassing limits' for stimulating electrodes [20, 21]. Later referred to as the charge-injection limit, it is a measure of how much charge can be injected through a stimulating electrode before water electrolysis (H2 or O2 evolution) occurs, a phenomenon many believe to be damaging to tissue around an implanted electrode. Brummer and Turner calculated the charge available from the oxide reduction and hydrogen adsorption mechanisms on platinum using millisecond-scale current pulses, and predicted the amount of charge that could be reversibly injected with a cathodic-first pulse to be 350 µC cm−2 (real area) [21]. Later, Rose and Robblee determined how much charge could be injected with platinum electrodes during 200 µs neural stimulation pulses [22]. With the 200 µs pulses, their experiments showed that only 150 µC cm−2 (geometric area) could be injected while avoiding potentials where H2 or O2 evolution could occur.
For an alternative estimate of how much charge an electrode is capable of transferring, Beebe and Rose began a trend of reporting the charge-storage capacity of electrode materials [3]. The charge-storage capacity (CSC) is calculated by first recording an i-E curve (i.e. current-potential curve, cyclic voltammogram) over the entire water window and then integrating the resultant current to provide a measure of how much charge an electrode can 'store'. The charge is divided by the electrode surface area to provide a charge density value. The cathodic CSC for platinum has been estimated to be as high as 550 µC cm−2 [23]. CSC values are higher than charge-injection limits because they are recorded under slow rates of potential change. As a result, the electrochemical reactions have more time to run to completion before the edge of the water window is reached. CSC has become a popular way of comparing the charge-transfer capability of electrodes for neural stimulation, likely because it is much easier to determine compared to the more relevant charge-injection limit.
Through the experiments outlined in this communication, we aimed to better understand the primary mechanism of charge transfer on platinum electrodes, the atomic hydrogen (H) adsorption–desorption reaction, which occurs in the potential region just positive of H2 evolution. As Brummer and Turner described, the adsorption and desorption of the hydrogen atom is a kinetically fast and highly reversible reduction–oxidation (redox) reaction, which makes platinum an attractive electrode material for neural stimulation [20]. The hydrogen adsorption–desorption reaction acts like a capacitor and is referred to as a pseudo-capacitance. This pseudo-capacitance operates in parallel with the double-layer capacitance to offer reversible electrochemical processes, which are widely accepted as safe mechanisms of charge injection because no electrochemical byproducts are produced in the reactions. The hydrogen adsorption–desorption reaction can occur on several noble metals [24]; the adsorption reaction for platinum is shown in equation (1.1).

 represents a proton surrounded by water molecules (solvated hydronium), Pt(s) represents a specific site on the platinum surface, and e− represents an electron transferred from the platinum electrode to the proton, as the electrode potential is decreased (i.e. polarized in the cathodic direction). Pt – H(ad) represents atomic hydrogen adsorbed to a single platinum surface site. There are a fixed number of Pt – H adsorption sites on the electrode surface and once all available sites are occupied, any additional cathodic electron transfer produces diatomic hydrogen (H2).
The hydrogen desorption reaction on platinum is shown in equation (1.2). The electron transfers back to the metal as the electrode potential is increased (i.e. polarized in the anodic direction), and the proton is returned back to solution.

This hydrogen adsorption–desorption process is a type of faradaic reaction that is fully reversible because, in part, the reaction product is bound (chemisorbed) to the electrode surface. The charge attributed to hydrogen adsorption is estimated to be 210 µC cm−2 (real area) based on a likely distribution of crystal planes (predominantly the [1 0 0] plane) and assuming a monatomic layer of H atoms [25–27]. For a thorough discussion of the assumptions made in determining an H adsorption value of 210 µC cm−2, see [27].
While conducting the studies reported in our previous communication [28], it became evident that in order to take full advantage of the hydrogen adsorption–desorption peaks shown in many platinum i-E curves in the neural prosthesis literature [23, 29–33], repeated cycling of the interface potential over the full water window was necessary. Yet, when an electrode is in a living system, its characteristics more likely resemble those of the electrode on the initial cycle rather than the steady-state cycle. In this article, we analyzed i-E curves from the initial cycle to the steady-state cycle, focusing on the hydrogen adsorption reaction on platinum. In addition, an analysis of oxide formation and the effects of chloride ions and proteins on H adsorption is presented. The objective is to gain insight into why CSC predictions from classic platinum i-E curves overestimate the amount of charge that can be injected during neural stimulation pulsing.
2. Experimental materials and methods
i-E curves were recorded on platinum wire and platinum disk electrodes in sulfuric acid solutions. In the first set of measurements (figures 2–5), the working electrode was a platinum wire (Goodfellow, 99.998%, as drawn, #PT005141) with a geometric surface area of 44 × 10−3 cm2 (0.25 mm diameter, 5.5 mm exposed length) and a large platinum mesh counter electrode. The surface area was calculated assuming the exposed wire was a smooth cylinder with one flat, disk-shaped end (all reported charge density values were calculated with this geometric area). In the second set of measurements (figures 6 and 7), the working electrode was a platinum disk (eDAQ, 99.5%, #ET075-1) with a geometric area of 7.8 × 10⁻³ cm2 and the counter electrode was a carbon rod. The counter electrodes differed in each set of measurements due to availability at the time of the experiment. Since the surface areas of the counter electrodes were very large in comparison to the working electrodes, they did not have any effect on the electrochemical reactions occurring at the working electrode surface. All potentials were measured with respect to a Ag|AgCl (3 M NaCl, 0.209 V versus SHE) reference electrode (BASi, #RE-5B). Prior to each experiment, the working electrode, counter electrode, and reference electrode were rinsed thoroughly with deionized, distilled water.
The 0.15 M H2SO4 electrolyte was prepared by diluting concentrated sulfuric acid (Fisher Scientific; Certified ACS Plus5, #A300S) with deionized, singly-distilled water (not ultrapure). In certain experiments, 0.15 M NaCl (Fisher Scientific, Certified ACS, #S271-3) or bovine serum albumin (BSA) solution was added to the sulfuric acid electrolyte. The BSA solution was prepared by dissolving BSA powder (Sigma-Aldrich, #A2153) into 0.15 M NaCl at a concentration of 0.2 mg ml−1.
While dilute sulfuric acid may seem to have little resemblance to the fluids surrounding an electrode in a living system, it is an excellent medium to study the basic properties of a platinum electrode. Both a sulfuric acid electrolyte and all living systems share the common components of protons, hydroxide ions, and water molecules. Also, even with careful preparation of sulfuric acid electrolytes, there will be organic molecules (contaminants) in solution that affect the electrochemistry, as is the case in a living system. The utility of sulfuric acid as an electrolyte for neural stimulation studies is further discussed in section 4.1.
The electrochemical cell was a cylindrical dish (Corning Pyrex, #3140–70) filled with 100 mL of electrolyte and covered with laboratory film (Parafilm M). The electrodes and a gas sparging tube were inserted into the cell through small holes in the film. Before i-E curves were recorded, the electrolyte was bubbled for 30 min with either N2 (Airgas, Ultra High Purity 99.999% N2) to minimize dissolved oxygen or O2 (Airgas, Ultra High Purity 99.994% O2) gas to maximize dissolved oxygen in the electrolyte. Gas was continuously passed over the electrolyte surface for the duration of the experiment to maintain a constant (saturated) dissolved gas composition.
i-E curves were recorded at a scan rate of 100 mV s−1 using a Bio-Logic VSP® potentiostat (figures 2–5) and an Autolab PGSTAT128N potentiostat with the linear scan generator module SCAN250 (figures 6 and 7). Charge was calculated from the i-E curves in figures 2–5 using the 'Integral' function of the Bio-Logic EC-Lab V9 software, which uses a trapezoidal rule to integrate the current-versus-time data. Platinum i-E curves were compared for two potentials ranges: in the conventional 1.5 V water window (approximately −0.25 V to +1.25 V versus Ag|AgCl) and in a narrower window (approximately −0.25 V to +0.55 V versus Ag|AgCl). The upper potential limit of the water-window i-E curve was limited to +1.25 V versus Ag|AgCl to avoid generating O2 at more positive potentials, which would have compromised the deoxygenated (N2-saturated) electrolyte. The narrower window will be referred to as the potential window for stimulation, with the upper limit approximately at the open-circuit potential (OCP).
When an electrode is submerged in an electrolyte, it stabilizes at OCP until an experiment is started. In figure 1, the range of OCPs on one platinum electrode from several experiments in N2-saturated and O2-saturated 0.15 M H2SO4 versus an Ag|AgCl (3 M NaCl) reference electrode is shown. The mean OCP values were 0.60 ± 0.038 V for N2-saturated electrolyte and 0.76 ± 0.023 V for O2-saturated electrolyte (see table 1). The mean OCP values are indicated by a dashed vertical line in figures 2–5.
Table 1. Open-circuit potential (versus Ag|AgCl) of a platinum electrode in N2-saturated and O2-saturated 0.15 M H2SO4.
| Saturation gas | Mean OCP (V) | Standard deviation (V) |
|---|---|---|
| N2 (N = 13) | 0.60 | 0.038 |
| O2 (N = 8) | 0.76 | 0.023 |
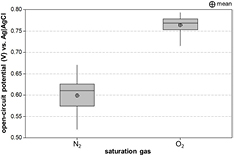
Figure 1. Box-whisker plot of open-circuit potential for a platinum electrode submerged in 0.15 M H2SO4 saturated with either N2 or O2 gas. Mean OCP for each gas is denoted with a crosshair. The interquartile range box represents the central 50% of the data points in each group. The median is indicated by the horizontal line through the box. The whiskers extend to the upper- and lower-most data points in each group.
Download figure:
Standard image High-resolution image
Figure 2. Steady-state i-E curves of platinum in N2-saturated (a) and O2-saturated (b) 0.15 M H2SO4 from −0.25 V to +1.25 V versus Ag|AgCl. (a) The N2-saturated i-E curve exhibits typical platinum electrochemistry: oxide formation, oxide reduction, atomic hydrogen (H) adsorption, H desorption, and molecular hydrogen (H2) evolution. Cathodic charge transfer associated with double-layer charging and the hydrogen adsorption reactions (blue shaded area) was 698 µC cm−2. (b) The O2-saturated i-E curve shows the same reactions as the N2 case, plus O2 reduction at potentials negative of the OCP (+0.76 V).
Download figure:
Standard image High-resolution image
Figure 3. i-E curves of platinum in N2-saturated (a) and O2-saturated (b) 0.15 M H2SO4 between −0.25 V to +0.55 V (near OCP); the sequence of the cycles is indicated with an arrow labeled from the first to the 100th cycle. The first cycle is shown in gray, intermediate cycles are thin black traces, and the last cycle of the progression is in bold black. Cycling through this potential range more accurately reflects the potential window platinum electrodes encounter during neural stimulation pulsing. Over the first 100 cycles, charge densities associated with double-layer charging and hydrogen adsorption steadily decrease from 438 µC cm−2 to 326 µC cm−2.
Download figure:
Standard image High-resolution image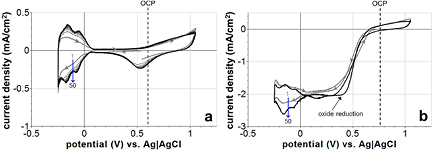
Figure 4. i-E curves of platinum in N2-saturated (a) and O2-saturated (b) 0.15 M H2SO4 from −0.25 V to +1.25 V. (a) The first cycle exhibits a hydrogen adsorption level similar to the last cycle of figure 3(a). When polarized repetitively into the oxide formation region (> +0.55 V), H adsorption current increases and clear peaks begin to form. Only by scanning into the oxide formation region did platinum achieve a charge density of 698 µC cm−2 for the H adsorption region. (b) Current for H adsorption increased to a steady-state level after the 50 cycles in O2-saturated H2SO4.
Download figure:
Standard image High-resolution image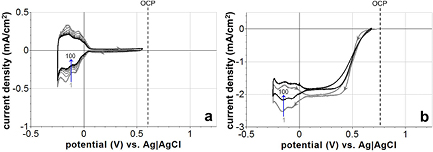
Figure 5. i-E curves of previously scanned platinum in N2-saturated (a) and O2-saturated (b) 0.15 M H2SO4 over a narrow potential range from −0.25 V to near OCP. The first cycle is shown in gray, intermediate cycles are thin black traces, and the last cycle of the progression is bold black. (a) For early cycles, clear peaks for H adsorption and desorption are observed. As scanning progresses, the peaks become less well defined and current decreases. By the last cycle, cathodic charge density for the H adsorption region decreased from 690 µC cm−2 to 435 µC cm−2. (b) A decrease in charge transfer for H adsorption was also observed in the O2-saturated case.
Download figure:
Standard image High-resolution image3. Results
3.1. Steady-state i-E curve over the water window
A steady-state i-E curve for a platinum electrode in N2-saturated 0.15 M H2SO4 over the entire water window (−0.25 V to +1.25 V versus Ag|AgCl) is presented in figure 2(a). The potential was swept at a constant rate of 100 mV s−1 between the positive and negative limits while the current was being recorded. For a comprehensive explanation of the theory behind i-E curves (or i-Ve profiles, cyclic voltammograms) and how to record and interpret them, see our previous publication [34]. Typical platinum behavior was indicated by the observed current peaks: oxide formation and reduction, atomic hydrogen (H) adsorption and desorption, and molecular hydrogen (H2) evolution and desorption. For the i-E curve in figure 2(a), the cathodic charge transfer associated with double-layer charging and the hydrogen adsorption reactions in the region between −0.22 V and +0.05 V (blue shaded area) was calculated to be 698 µC cm−2. This indicates a roughness factor of about 3, assuming a monolayer of adsorbed atomic hydrogen corresponds to 210 µC cm−2 [26, 27].
In figure 2(b), the steady-state i-E curve for a platinum electrode in O2-saturated 0.15 M H2SO4 over the entire water window is shown. In the O2-saturated environment, at potentials negative of the OCP (+0.76 V), platinum reduces dissolved O2 molecules to form the superoxide radical ( ) [35–37] or other species like H2O2. This reduction reaction provides a source of negative current that shifts the i-E curve downward in this potential range. The upper limit of the i-E curves in figure 2 was chosen to be +1.25 V to prevent the formation of molecular oxygen (O2), which occurs at potentials above this limit.
3.2. i-E curves in the potential window for stimulation
Shown in figure 3(a) is an i-E curve of a platinum electrode scanned from the mean OCP to the negative limit of the water window (approximately +0.55 V to −0.25 V) for 100 cycles in N2-saturated H2SO4. Cycling through this potential range more accurately reflects the primary potential window platinum electrodes encounter during neural stimulation pulsing. Prior to initiating this sequence of i-E curves, the as-manufactured electrode had been stored in air, rinsed with deionized distilled water, then submerged in the N2-saturated electrolyte. In the first cycle (bold gray trace), hydrogen (H) adsorption–desorption peaks were relatively undefined compared to the same region (approximately −0.22 V to +0.05 V) in figure 2(a) when scanning over the wider window (−0.25 V to +1.25 V). At the negative end of the i-E curve, molecular hydrogen (H2) is formed from the reduction of water molecules. In cycle 2 (first of the thin black traces), the cathodic charge density associated with double-layer charging and hydrogen adsorption was 438 µC cm−2 6. As scanning progressed, the current associated with hydrogen adsorption steadily decreased, and by the 100th cycle (bold black trace; deemed as steady-state), cathodic charge density had decreased to 326 µC cm−2. A similar decrease in hydrogen adsorption current was observed in O2-saturated sulfuric acid (figure 3(b)).
3.3. i-E curves over the water window expose sites for hydrogen adsorption
After the 100th cycle of figure 3(a), the electrode was then scanned over the entire water window (−0.25 V and +1.25 V), and the resulting i-E curves are shown in figure 4(a). By polarizing the electrode through the oxide formation region (> +0.55 V) repeatedly, charge transfer in the hydrogen (H) adsorption/desorption region gradually increases over time. By the 50th cycle (bold black trace), the i-E curve has reached a steady state, and the hydrogen adsorption–desorption peaks became well defined. The cathodic charge in the hydrogen adsorption region (−0.22 V to +0.05 V) in the last cycle, deemed the 'cleaned state', was calculated to be 698 µC cm−2. This last cycle is the i-E curve presented in figure 2(a).
The i-E curve of platinum in O2-saturated H2SO4 between −0.25 V and +1.25 V is shown in figure 4(b). Similar to the N2-saturated case, as cycling over the entire water window progressed, the H adsorption current increased to a steady-state value within 50 cycles. This last cycle is the i-E curve presented in figure 2(b).
3.4. i-E curves in the window for stimulation after scanning through the oxide region
In figure 5(a), i-E curves for the same platinum electrode in N2-saturated H2SO4 immediately after the electrode had been cycled through the oxide formation region to a steady state (after 50th cycle in figure 4(a)) are shown. In the first cycle (bold gray trace) over the narrower potential window, the charge density for H adsorption was 690 µC cm−2. As scanning progressed, however, the current associated with H adsorption steadily decreased. Charge transfer in the H adsorption region decreased from 690 µC cm−2 to 435 µC cm−2 by the 100th cycle (bold black trace). Comparing this to the fully developed electrode represented in figure 4(a), there was about a 38% decrease in H-adsorption charge transfer when operating platinum in the narrower window.
i-E curves of the platinum electrode in O2-saturated H2SO4 over a sequence of 100 cycles in the narrow potential window (immediately after the 50th cycle in figure 4(b) are presented in figure 5(b). Over the progression from the first cycle (gray) to steady state (black), the current associated with H adsorption decreased similarly to the N2-saturated case.
3.5. The effect of chloride ions and proteins
Beyond the protons, hydroxide ions, water molecules, and dissolved O2 studied in diluted sulfuric acid, two important components of living tissue should be considered when analyzing electrodes for neural stimulation: proteins and chloride ions (Cl−). Both can have significant effects on the electrochemical activity of the electrode and may alter the amount of charge that can be injected through platinum.
Previously, we have shown that phosphate-buffered saline electrolytes may provide inaccurate electrochemical results since the phosphate groups are electrochemically active in certain potential regions [28]. So, we attempted to evaluate the electrochemical response of platinum in an unbuffered saline solution as a vehicle for examining the effect of Cl−. i-E curves of a platinum disk electrode in 0.15 M H2SO4 (black trace) and in unbuffered 0.15 M NaCl (blue traces) are overlaid in figure 6. Several visual differences between i-E curves in the two electrolytes are apparent. One major difference is that the sulfuric acid i-E curve achieved a stable steady state, whereas the unbuffered NaCl i-E curves continually changed over time. The oxide reduction current decreased with time and an additional small reduction peak began to appear near +0.50 V (see red arrows). There was also a difference in the apparent water window of platinum in these electrolytes. The negative limit of the i-E curves in unbuffered NaCl is shifted 0.55 V negative of the i-E curve in sulfuric acid. This shift is due to the difference in pH between sulfuric acid (pH = 0.9) and unbuffered NaCl (pH ~7, unstable) [38]. The overall width of the water window was larger in unbuffered NaCl (1.8 V) than in sulfuric acid (1.5 V). Also, the shapes and amplitudes of the hydrogen adsorption–desorption peaks differ. The differences observed between dilute sulfuric acid and unbuffered NaCl may be explained by variations in pH [38, 39] and ion adsorption effects, which are further studied below. Because of the instability of the i-E curve in unbuffered NaCl, it is not normally used as a test electrolyte for careful analyses of platinum (or other metal) electrochemistry. As discovered previously, even phosphate-buffered NaCl electrolytes exhibit electrochemical reactions that may not occur in vivo [28].
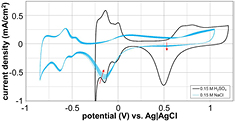
Figure 6. The i-E curve of a platinum disk electrode in a 0.15 M NaCl electrolyte (blue trace) continuously changes with repeated cycling, unlike the repeatable i-E curve of Pt in sulfuric acid that exhibits a steady curve after repeated cycling (black trace). The oxide reduction current decreases with time and an additional small reduction peak begins to appear near +0.50 V (red arrows). The negative limit of the i-E curves in unbuffered NaCl is shifted 0.55 V negative of the i-E curve in sulfuric acid due to the difference in pH between the two electrolytes.
Download figure:
Standard image High-resolution imageIn a related experiment, a platinum electrode in sulfuric acid was first scanned through the water window until steady state was reached (figure 7(a), black trace). Then, aliquots of 0.15 M NaCl were added to determine how the chloride ion (Cl−) affects the electrochemical activity. Upon addition of 1 mL of the NaCl electrolyte (final NaCl concentration of approximately 3 mM) and cycling to steady state, the current response for oxide formation decreases in the potential range from +0.55 V to +0.90 V, but appears relatively unchanged above +0.90 V. Also, the relative amplitudes of the hydrogen adsorption peaks change. Addition of 5 ml NaCl (final concentration of approximately 15 mM) resulted in an additional reduction in oxide formation current, and slight changes to the hydrogen adsorption peaks.

Figure 7. The effect of adding Cl− to 0.15 M H2SO4 electrolyte is shown in part (a). The oxide formation and reduction current is depressed, and changes in hydrogen adsorption current occur starting with a 1 ml addition of NaCl. The effect of adding BSA to the electrolyte is shown in part (b). Suppression of the oxide formation current and changes in hydrogen adsorption are observed.
Download figure:
Standard image High-resolution image
Further insight on the behavior of platinum electrodes can be gained from the work by Robblee et al [40]. Robblee showed that under pulsed conditions, less platinum was detected in solution when human serum albumin (a protein) was added to a phosphate buffered saline electrolyte (i.e. less platinum dissolution occurred). To gain a better understanding of this observation, bovine serum albumin (BSA) solution was added incrementally to sulfuric acid electrolyte and its effect was observed (figure 7(b)). Serum albumins are globular proteins and human serum albumin is a prominent constituent of cerebrospinal fluid. Shown in figure 7(b), a 1 ml addition of BSA solution results in current suppression over most of the oxide formation region (+0.55 V to +1.20 V) Additional amounts of BSA (up to 9 mL) did not result in a significant further change in the i-E curve. The approximate final concentrations of BSA in solution for the 1, 2, 5, and 9 ml additions were 4, 8, 20 and 36 µg ml−1, respectively. With BSA and other organic molecules, the suppression of oxide formation and H adsorption has been reported as an overall surface blocking effect [41, 42], where the organic molecules physically block platinum surface sites from participating in redox reactions.
4. Discussion
The i-E curve (slow-scan cyclic voltammogram) provides information about the electron-transfer processes that are thermodynamically possible on a stimulating electrode, and they should be consulted by neural prosthesis engineers to understand the possible consequences of permitting specific electrode potential excursions. The results of the experiments performed here indicate: (1) platinum electrodes must be subjected to a 'cleaning' procedure in order to expose the maximum number of surface platinum sites for hydrogen adsorption; (2) the 'cleaned' platinum surface will likely revert to an obstructed condition under typical neural stimulation conditions; (3) irreversible oxygen reduction may occur under neural stimulation conditions, so the consequences of this reaction should be considered; and (4) the presence of the chloride ion (Cl−) or bovine serum albumin (BSA) inhibits oxide formation and alters H adsorption.
4.1. Sulfuric acid as a model electrolyte
In this study, dilute sulfuric acid was used as the electrolyte for platinum because it is a relatively well-understood electrochemical electrode-electrolyte system. Also, it contains protons, hydroxide ions, and water molecules, all of which are present in any living system. Protons and hydroxide ions are present in both sulfuric acid and in vivo, although in different proportions, giving rise to a pH difference and the resulting shift in potential. The sulfate ( ) and bisulfate (
 ) anions in sulfuric acid adsorb to the platinum surface, but do not have a significant inhibiting effect on oxide formation or hydrogen (H) adsorption [41, 43–45]. Understanding the electron transfer processes involving protons and water provides the basis for adding other candidate reactants to the test electrolyte. In our experiments in unbuffered NaCl, it was not possible to obtain a well-developed and stable i-E curve that can be used as a standard (see figure 6). In our previous study in phosphate-buffered saline, it was clear that the phosphate components can be electrochemically active [28]. However, in a sulfuric acid electrolyte, a stable i-E curve could be achieved relatively easily and its characteristics matched very well to platinum/sulfuric-acid i-E curves in literature [42, 46–50]. This stable curve provides a baseline electrochemical response of platinum to which other test components can be added to solution for analysis.
4.2. The OCP and the effect of oxygen (O2) reduction
When an electrode is submerged in an electrolyte, the electrode potential stabilizes at the point (known as a mixed potential) where current for cathodic processes is balanced with current for anodic processes, resulting in zero net current across the interface. This stable point is called the open-circuit potential (OCP). For an electrolyte containing O2, current for O2 reduction (a cathodic process) is balanced with current from anodic processes. Hoare et al deduced that the OCP is a mixed potential arising from oxygen reduction and platinum oxide formation reactions [51]. An analysis by Rand and Woods showed that the likely anodic processes were platinum dissolution and oxidation of organic contaminants ('impurities') in solution [46]. Without O2 present, there is no cathodic current from oxygen reduction, so the electrode rests at a more negative potential because the electrode must find a cathodic process with which to balance the anodic current from dissolution and organic oxidation. This shift was observed in our experiments (see figure 1 and table 1), where the OCP in O2-saturated electrolyte was positive (anodic) to the OCP in deoxygenated electrolyte. In this study, O2 reduction was observed at all potentials negative to the OCP when O2 was present. With cathodic-first neural stimulation starting from OCP, the electrode will travel through this potential region where O2 reduction is thermodynamically favorable. Therefore, future electrochemical studies relating to neural stimulation should consider an O2 concentration near that found in neural environments (~5%) [52]. The consequences of oxygen reduction can be the generation of reactive oxygen species, such as superoxide and hydrogen peroxide, which may not be reversible upon the application of the positive phase of the biphasic pulse. Superoxide radicals are known to react with nitric oxide (NO) to form peroxynitrite, which can be toxic to cells in the vicinity of the stimulating electrode [53–55]. Because NO is a prominent vasodilator, depletion of this molecule through the reaction with superoxide may result in vessel constriction near neural tissue. However, reactive oxygen species are also a consequence of normal metabolic processes and scavengers are naturally present to mitigate them.
4.3. Hydrogen adsorption is dependent on the potential range
When a platinum i-E curve appears in a publication concerning neural stimulation, it is almost always a steady-state i-E curve in an oxygen-free electrolyte, as shown in figure 2(a). It is important to realize that, prior to recording this i-E curve, the electrode potential had been swept many times over the entire potential range shown on the potential scale, as shown in figure 4(a). With each sweep cycle, more and more charge can be reversibly transferred across the electrode interface until little or no increase is observed with additional cycling. The i-E curve at the end of the cycling process is referred to as a steady-state i-E curve or steady-state cyclic voltammogram (CV). Reaching this steady state takes several minutes of cycling, whereas a neural stimulation pulse may only last microseconds. In the case of figure 4, the electrode was cycled over the −0.25 V to +1.25 V range fifty times. Such a sweeping or cycling procedure, sometimes referred to as cleaning the electrode, is not often discussed in the neural prosthesis literature, and that absence can be misleading to a novice. After sweeping the potential over the −0.25 V to +1.25 V range fifty times, the charge stored in the hydrogen adsorption region increased from ~400 µC cm−2 to ~700 µC cm−2. Sweeping the potential over the −0.25 V to +0.55 V range did not improve the CSC of the hydrogen adsorption reaction (figure 3(a)). Comparing the results obtained from figure 3 with those of figure 4, it is apparent that to achieve the enhanced charge storage of hydrogen adsorption, the electrode potential needs to be swept through the platinum oxide formation region. Further, as shown in figure 5, the cleaned or enhanced hydrogen adsorption region cannot be maintained if the electrode potential is not swept into the range where oxide is formed.
One might think of applying an anodic bias to the electrode prior to the application of a cathodic neural stimulation pulse to develop surface sites for hydrogen adsorption. The results of these experiments suggest that this may not enhance charge transfer unless the positive bias was applied repeatedly (or for long periods of time) and that some of the exposed sites may be blocked during the inter-pulse interval. Applying an anodic bias on platinum may have other consequences in vivo such as enhanced corrosion through the formation of platinum-chloride complexes [20, 56–58].
In the electrochemistry literature of the 1950s and 60s, several investigators reported altered electrochemical activity on platinum depending on the potential range accessed by the electrode. Out of these observations, two theories on the cause of the activity changes arose: (1) scanning through more positive potentials oxidizes contaminants or organic materials in the electrolyte that had adsorbed to the electrode surface, thus freeing surface sites for charge transfer [59–62] and (2) scanning into the oxide formation potential region elicits 'activation' of the platinum surface, producing a layer of more active platinum sites [63–67]. French and Kuwana estimated that the activated state would revert to the inactivated state with a half-life of 46 minutes [67]. More recently, Hibbert et al demonstrated the inhibition of hydrogen adsorption by cycling a platinum electrode in a phosphate buffered saline electrolyte containing the protein human serum albumin (HSA) and/or amino acids [31]. From our review of literature, a consensus on the true cause of hydrogen adsorption inhibition never developed. Regardless of the cause, the implications for this activity change are clear. During neural stimulation, if the platinum electrode is mostly exposed to potentials negative of OCP, then the electrode will not be able to transfer as much charge as it would if the surface had been fully 'activated' or 'cleaned of contaminants' by cycling through the entire oxide formation region.
4.4. Chloride ions and proteins adsorb to the platinum surface
The protons, hydroxide ions, and water molecules in sulfuric acid are not the only components to consider when evaluating the electrochemistry of a stimulating electrode. One significant ion present in the body is the chloride ion (Cl−). Adding chloride (0.15 M NaCl) to the sulfuric acid electrolyte (figure 7(a)) demonstrated that the presence of Cl− decreases the overall amount of oxide formation and alters the relative peak heights for H adsorption-desorption. Several researchers have investigated ion adsorption on the platinum surface [41, 47, 68, 69]. Bagotzky et al demonstrated that Cl− adsorbs to the surface and changes the energy distribution of H adsorption, but does not decrease the amount that occurs (a full monolayer of H can still be adsorbed). Novak and Conway demonstrated that the adsorption of Cl− acts to suppress oxide film formation [47]. When Cl− is adsorbed, it can be oxidized through the corrosion reaction in (4.4.1).


Another aspect of living tissue that will affect the electrochemical performance of an electrode is the presence of organic materials like proteins. The experiment in figure 7(b) demonstrated that BSA suppresses oxide formation and alters H adsorption. Evidence in literature demonstrates that BSA readily adsorbs to the platinum electrode surface [70]. Bagotzky et al found that when organic molecules adsorb to the surface of platinum, both oxide formation and the amount of H adsorption decrease [41]. The suppression of oxide formation current in figure 7(b) indicates that BSA is blocking the platinum surface from being fully oxidized [42]. By examining the H desorption (positive) peaks in figure 7(b), it is apparent that less H adsorption had happened when BSA was present. It has also been shown that organic molecules and anions compete for surface sites when adsorbing on platinum [41]. When both BSA and chloride are present, BSA may occupy surface sites to which chloride ions would otherwise adsorb. With less chloride adsorbed, the corrosion reaction above would be suppressed. Robblee measured decreased platinum corrosion products with the addition of human serum albumin to phosphate buffered saline [40].
Even with high-quality reagents and deionized distilled water, contaminants may be present in solution that can affect electrochemical measurements. Most would consider the sulfuric-acid-only i-E curves in figures 6 and 7 as 'textbook' i-E curves of platinum in sulfuric acid. Specifically, the pronounced hump at the beginning of the oxide formation region (+0.55 V to +0.9 V), the well-centered double-layer region (near +0.1 V), and the sharp H adsorption–desorption peaks (−0.22 V to +0.05 V) are all indicative of a high-purity de-oxygenated electrolyte and a pure platinum electrode that has been scanned to steady state. Its characteristics are very similar to i-E curves of platinum in sulfuric acid presented in other literature [42, 46, 47, 71]. The slow rise of oxide formation current in the sulfuric acid i-E curve in figure 2(a), however, may indicate that organic contaminants were present in the sulfuric acid electrolyte used in figures 2–5. In those experiments, ultrapure water was not used to prepare the electrolyte and paraffin film was used to cover the electrochemical cell, both of which are possible sources of organic contamination. Note the similarity in the shape of the oxide formation shoulder (+0.55 V to +1.2 V) in figures 2(a) (possible organic contaminants) and 7(b), where organics (BSA) were intentionally added to solution. That observation supports the theory that scanning through more positive potentials (as demonstrated in figure 4) oxidizes organic molecules on the electrode surface, thus freeing surface sites for charge transfer via the hydrogen (H) adsorption reaction.
5. Conclusions
The results of this study help to explain why charge densities predicted from platinum steady-state i-E curves are not achievable during neural stimulation-type pulses. Charge (i.e. number of electrons) transferred via the hydrogen adsorption reaction on platinum greatly depends on the availability of surface adsorption sites. Without subjecting platinum to a 'cleaning' procedure, surface sites are blocked and unavailable for hydrogen adsorption. Further, a 'cleaned' surface reverts to a compromised surface relatively quickly.
For an as-manufactured electrode scanned from OCP toward hydrogen evolution, the charge density in the H adsorption region was only 326 µC cm−2. Larger charge densities were only achieved if the electrode was scanned through more positive potentials in the oxide formation region. After cycling a platinum electrode over the entire water window (between −0.25 V and +1.25 V) for 50 cycles, the maximum charge density over the H adsorption region was 698 µC cm−2. Further, once 'activated' or 'cleaned', if the electrode potential was not driven positively into the platinum oxide formation region, the electrode reverted to the state where decreased H adsorption occurs. It was also shown that both the chloride ion (Cl−) and protein molecules (BSA) adsorb to the platinum surface and independently decrease the amount of oxide formation that occurs, also resulting in minimization of the amount of the H adsorption reaction.
These phenomena are some of the reasons why CSC calculations overestimate the amount of charge that can be transferred during neural stimulation pulsing and may help to explain why stimulation limits from the Shannon plot are usually lower than calculated CSCs for platinum. Assuming the potential window from OCP toward hydrogen evolution better represents the operational potential window during stimulation, the predicted CSC would be as low as 326 µC cm−2 as demonstrated in the results of figure 3(a). For this electrode size of 44 × 10−3 cm2 with a limiting factor of k = 1.75 (a common imposed limit for platinum), the Shannon plot would constrain stimulation to charge densities below 36 µC cm−2, an order of magnitude below that predicted by the CSC. Hence, other factors must account for the discrepancy in addition to the ones observed in this study. Future studies could focus on how kinetics of the electrochemical reactions affect charge transfer during fast stimulation pulses.
Acknowledgments
The authors thank Professor Daniel Scherson of Case Western Reserve University, Dr David Zhou of Second Sight Medical Products, Professor Stuart Cogan of the University of Texas at Dallas, and Dr Benjamin Hahn and Karl Steinke of Boston Scientific for helpful discussions and reviews. We extend our particular thanks to Zhou and Cogan for the extra time and careful attention they gave to us in their examination of the manuscript. The work was supported by the National Institutes of Health (R01-EB004018), and the David and Jane Watterson Fund at Case Western Reserve University provided instrumentation and material support. Postdoctoral salary support for Dr Kumsa was provided by Advanced Bionics, Boston Scientific, and Medtronic. Funding support does not imply or suggest a sponsor's endorsement of the work presented in this document.
Footnotes
- 5
Certified ACS and Certified ACS Plus are Fisher Scientific designations indicating the reagent meets or exceeds the latest specifications of the American Chemical Society. Certified ACS Plus reagents are also analyzed for more than 16 trace metals.
- 6
Note on charge density values: Some charge densities reported in this article are higher than those calculated from platinum i-E curves in other literature. Possible explanations include: (1) a very rough electrochemical surface area and (2) insufficient adhesion between the insulating polymer and the platinum metal, hence a larger-than-intended exposed surface area. Whatever the cause of these high charge densities, the overall observed trends and conclusions are still valid.