

Abstract
Claims that proximity to the Sun causes variations of decay constants at the permille level have been investigated for beta-minus decaying nuclides. Repeated activity measurements of 3H, 14C, 60Co, 85Kr, 90Sr, 124Sb, 134Cs, 137Cs, and 154Eu sources were performed over periods of 259 d up to 5 decades at various nuclear metrology institutes. Residuals from the exponential decay curves were inspected for annual oscillations. Systematic deviations from a purely exponential decay curve differ in amplitude and phase from one data set to another and appear attributable to instabilities in the instrumentation and measurement conditions. Oscillations in phase with Earth's orbital distance to the Sun could not be observed within 10−4–10−5 range precision. The most stable activity measurements of β− decaying sources set an upper limit of 0.003%–0.007% to the amplitude of annual oscillations in the decay rate. There are no apparent indications for systematic oscillations at a level of weeks or months.
Export citation and abstract BibTeX RIS

Original content from this work may be used under the terms of the Creative Commons Attribution 3.0 licence. Any further distribution of this work must maintain attribution to the author(s) and the title of the work, journal citation and DOI.
1. Introduction
This is Part II of a trilogy investigating claims that radioactive decay deviates from the fundamental exponential-decay law due to solar influences (see introduction in [1]). In this work, a systematic search for annual modulations in the decay rates of beta-minus (β−) emitters is performed. Decay rate measurements repeated over periods of 259 d up to 5 decades at various laboratories around the globe were collected for this purpose. The project encompasses different types of radioactive decay, including alpha decay presented in Part I [1] and beta plus/electron capture decay discussed in Part III [2]. All data sets were checked for annual oscillations and the amplitude and phase of the best matching sinusoidal function to the residuals from exponential decay were tabulated and published in [3].
The common measurement system for radioactivity is solidly based on the famous exponential-decay law and doubt raised on the invariability of decay constants touches the foundations of nuclear physics, the establishment and international equivalence of the SI unit becquerel, quantitative predictions of activity and radiation dose, and accurate dating through nuclear chronometers. The issue at hand concerns the observation of permille-sized annual modulations in particular decay rate measurements repeated over several years [4–7] and the interpretation that they are caused by solar-induced variations in the decay constants [4, 8] rather than instabilities in the detection system. Claims were made about a new interaction—the fifth force—by which solar neutrinos could affect decay constants, thus inducing changes in the decay rates in correlation with the variations of the solar neutrino flux due to the seasonal changes in Earth–Sun distance [8, 9]. Other hypotheses link periodic changes in radioactivity to interactions with slow neutrinos which are part of dark matter, such as the relic neutrinos produced at the early stages of the existence of the Universe [7, 10], to global anisotropy and a new force [11], to a gradient in Planck's parameter h across the Earth's orbit [12], or to the presence of an 'effective Lorentz noninvariance' [13]. Predictions from Cordus theory find against constancy of decay rates on theoretical grounds [14].
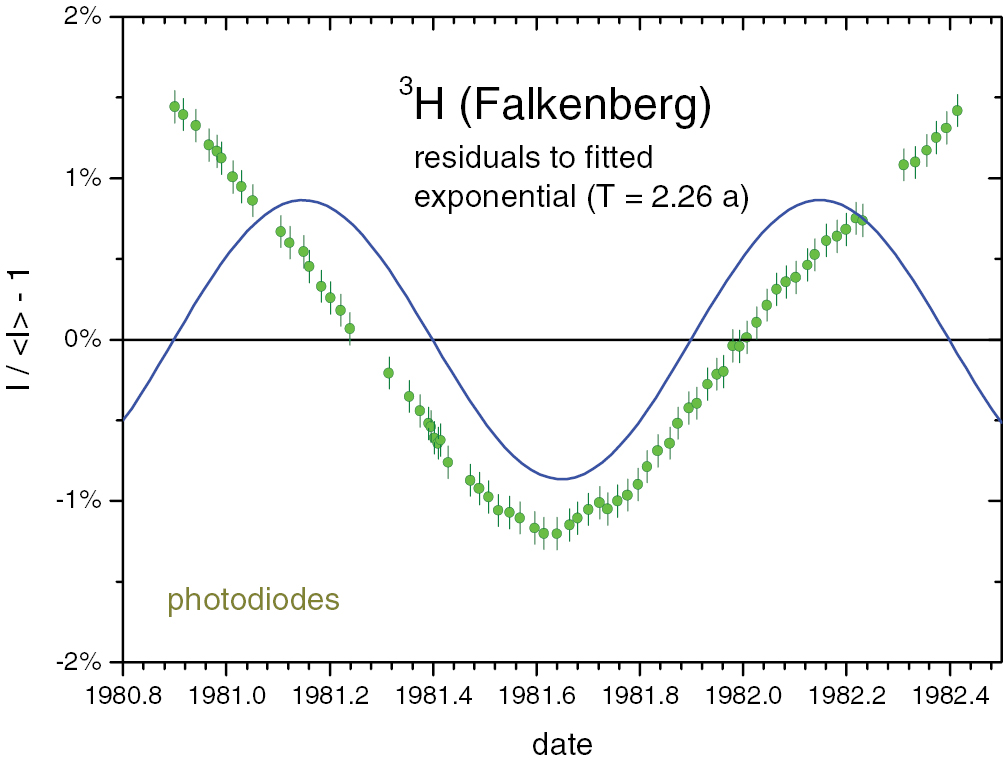
In 2001, Falkenberg [4] reported the result of a long-term experiment aimed at testing the hypothesis that radioactive β decay might be caused by the neutrino flux coming from the Sun and other sources. The author made a link with the speculation by Nicola Tesla that radioactivity might be caused by small particles which are omnipresent and capable of passing any (non-radioactive) matter almost without leaving any traces. Repeated decay rate measurements of tritium, incorporated inside a strip of phosphorescent material and placed in front of an array of photodiodes, showed sinusoidal deviations from a double exponential function with a peak amplitude of 0.37% over the measurement period 1980–1982. The author was confident that seasonal changes of the external conditions (incl. temperature) were ruled out and came to the conclusion that the measurements showed a periodic variation in the decay constant of tritium and suspected a positive correlation between β decay and the periodically changing solar neutrino flux. This conclusion was the result of a questionable analysis of unstable measurements, because (1) the tritium disappearance rate was much higher than expected from decay, with a 'half-life' of 2.26 a instead of T1/2(3H) = 12.312 (25) a [15] and (2) the annual modulation was partly caused by the arbitrary fit function used to represent the 'degradation' of the experiment. The residuals of the data to a single exponential function do not follow a sinusoidal shape, as can be seen in figure 1 (based on Falkenberg's data published in the annex of [16]).
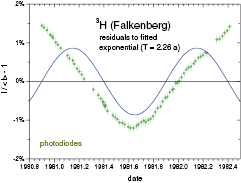
Figure 1. Residuals from a single exponential decay curve (with a hypothetical half-life value of 2.26a) fitted to the 3H decay rate measurements of Falkenberg [4]. The line represents the best fitting sinusoidal function to the data.
Download figure:
Standard image High-resolution imageIn 2009, Jenkins et al [5] re-opened the debate by observing 0.3% variations in decay rate measurement sets of 32Si/32P (β− emitter, measured relative to 36Cl at Brookhaven National Laboratory) and 226Ra sources (series of α and β− emitters measured at the Physikalisch-Technische Bundesanstalt). Since it was considered less likely that α decay was affected by (mildly varying) external conditions, it was argued by Jenkins et al [6] and Parkhomov [7] that the oscillations in the 226Ra decay rates could be caused by solar influences on the β− emitters in the decay chain. This raises the variability claim on the β− decay constants even to percent level, considering that only 210Pb (22.23 (12) a)—near the end of the decay chain, representing a small fraction of the activity measured in an ionisation chamber—has a sufficiently long half-life to depart significantly from equilibrium with the 226Ra parent for more than a few weeks. Such high variability of the decay constant is contradicted by the consistency among the measured 210Pb half-life values [15]. Moreover, in Part I of this work [1] experimental evidence was provided that the decay rate of a 226Ra-series source is free of annual modulations within 0.000 25 (18) %.
Parkhomov [7] and Jenkins et al [6] collected additional experimental evidence of time-dependent decay rates for β− emitters 3H, 36Cl, 56Mn, 60Co, 85Kr, 90Sr, 133Ba, 137Cs, and 239Pu as well as for β+ and electron capture decaying nuclides. In all of these data sets, a periodicity of 1 year was found by means of a time-frequency analysis and this was attributed to solar influences on the decay constants. Since no consistency was found concerning the amplitude of the annual modulations in the decay rates of different radionuclides, Jenkins et al concluded that 'different nuclides have different sensitivities to whatever external influences are responsible for the observed periodic variations'. Whereas the annual modulations first seemed a general phenomenon to all radioactive decays, the claims had to be narrowed down to certain types of decay, later also to specific nuclides. This created a demand for more data sets to investigate the presence of seasonal behaviour in the decays of different nuclides.
Beside the claims for annual modulations, there have been observations of non-exponential decay at other frequencies: for example Baurov et al observed periods of 1 d and 27 d in the decay of 60Co and 137Cs [11, 17]. Various data sets have been subjected to frequency analysis (see e.g. [18–20]), yielding additional 'instabilities of interest'. Variations with periods of the order of months have been attributed to r-mode oscillations in solar activity and frequencies of the order of 10–12 a have been associated with internal solar rotation [21]. Again solar neutrinos were considered the root cause of non-exponential decay. However, also the conjecture that cosmic neutrinos stimulate decay has been further developed: Sturrock et al [20] found arguments to claim that there is a directional relationship between the incoming neutrino and the photons emitted from the neutrino-stimulated decay. In their reasoning, γ-ray measurements performed on top of the source would be sensitive to cosmic neutrinos at daytime and to solar neutrinos at night. Sturrock et al [22] found a similarity with the oscillations observed in the DAMA experiment, which is allegedly compatible with the influence of dark matter.
Metrologists have pointed out that the more likely explanation for non-exponential behaviour is instability of the measurement conditions leading to varying detection efficiency [23–31]. Precise measurements of 36Cl [26], 40K [27], 90Sr–90Y [28], 121mSn [29], and 137Cs [30] decay rates performed in stable conditions show no annual modulations within 10−4 level, thus contradicting the experimental evidence prone to instability and invalidating theories assuming a permille range variability of decay constants in phase with Earth–Sun distance. This counterevidence seems to be largely ignored by authors in search for new physics. The growing scientific literature devoted to this subject hardly considers experimental difficulties with repeatability of activity measurements as a plausible root cause for the observed deviations from perfect exponential decay. With good reason, Lindstrom [25] reminds the community that believable science is founded on believable uncertainty assessments: 'Although science is always open to new ideas, a lack of understanding of the real uncertainties in a measurement, in physics as well as statistics, has led to some conspicuously mistaken conclusions'.
In this work, the seasonal variability of decay rates for β− emitters has been investigated experimentally. Repeated activity measurements of 3H, 14C, 60Co, 85Kr, 90Sr, 124Sb, 134Cs, and 137Cs sources were performed over periods of 259 d up to 5 decades at various nuclear metrology institutes. Exponential decay curves were fitted to the data and the residuals were inspected for annual modulations, using the same methodology as in [1–3]. The residuals from the fitted decay curve were binned into 8 d periods of the year and averaged to obtain a reduced set of (maximum) 46 residuals evenly distributed over the calendar year. To the averaged residuals, a sinusoidal shape Asin(2π(t + a)/365) was fitted in which A is the amplitude, t is the elapsed number of days since New Year, and a is the phase shift expressed in days. The standard uncertainty on the fitted amplitude was determined as the value which increases the variable χ2/(χ2/υ)0 by a value of one; the chi square χ2 was divided by the reduced chi square (χ2/υ)0 of the fit to protect against unrealistic uncertainty evaluations, e.g. due to correlations between measurements.
Throughout the paper, graphs are shown of residuals of integrated count rates or ionisation currents (for convenience all types of signals will be represented by the same symbol I) over the measured period as well as multi-annual averages (maximum 46 data, covering 8 d periods). The uncertainty bars are indicative only: for the individual data they often refer to a short-range repeatability, and for the annual averaged data they were derived from the spread of the input data and the inverse square root of the number of values in each data group. As a reference measure for the expected solar influence, a functional curve is included representing the annual variation of the inverse square of the Sun–Earth distance, 1/R2, renormalised to an amplitude of 0.15%, which is representative for the magnitude of the effect claimed by Jenkins et al [5]. The actual amplitude of the variation of 1/R2 is smaller (0.033%).
2. Tritium
2.1. Decay characteristics
Tritium or 3H (12.312 (25) a) is the lightest radioactive nuclide. It decays 100% by β− emission directly to the ground state of 3He. In radionuclide metrology, it plays a role as a reference source for quantifying quenching effects in liquid scintillator cocktails. No gamma rays are emitted in its decay and the average beta energy is only 5.68 keV (with a maximum of 18.56 keV) [15], which makes detection difficult and dependent on the energy threshold of the detection system.
The measurements by Falkenberg [4] between 1980 and 1982 show significant deviations from the expected exponential decay, as discussed in the introduction and shown in figure 1. Falkenberg claimed the presence of annual sinusoidal oscillations in the decay rate with 0.37% peak amplitude. Veprev and Muromtsev [32] observed 27 d and daily variations of counting rate in the high-energy region of the tritium beta spectrum and suggested that the 27 d variations with 11%–22% amplitude could be caused by the interaction of tritium nuclei with low-energy solar neutrinos. Bikit et al [33] reinvestigated the liquid scintillation measurements (LSC) of the 3H decay rate and concluded that the measurement of the high-energy tail of the beta spectrum may be significantly influenced by instrumental instability. They observed 22 d oscillatory behaviour of only 0.5% amplitude when selecting the high-energy tail of the beta spectrum and no significant variations when selecting the total spectrum.
2.2. 3H @JRC
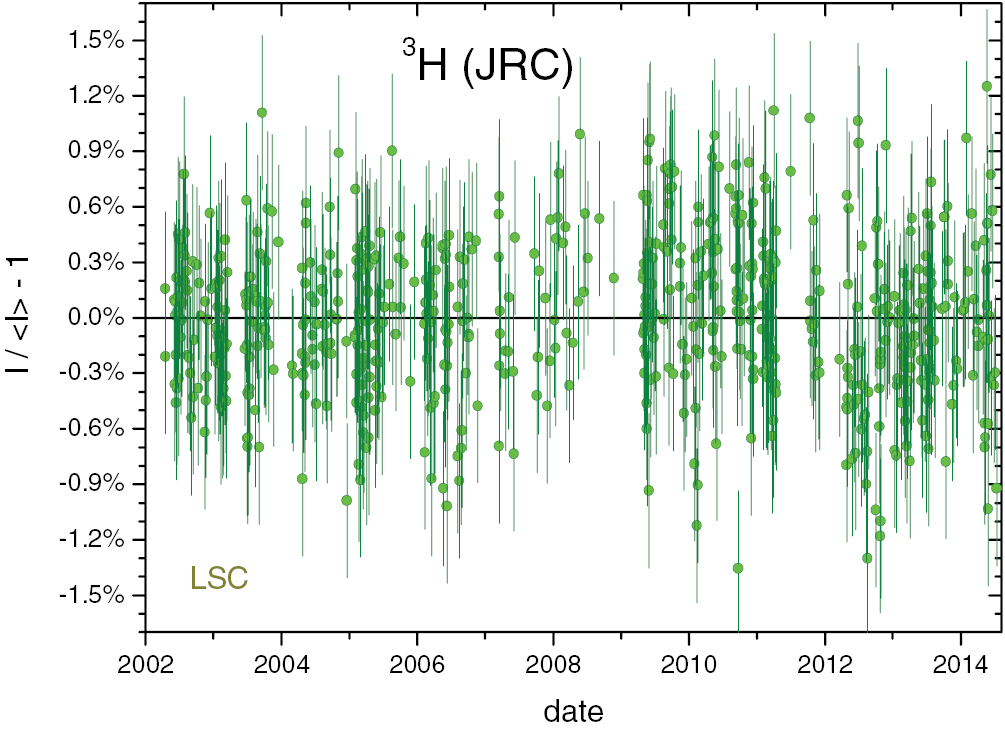
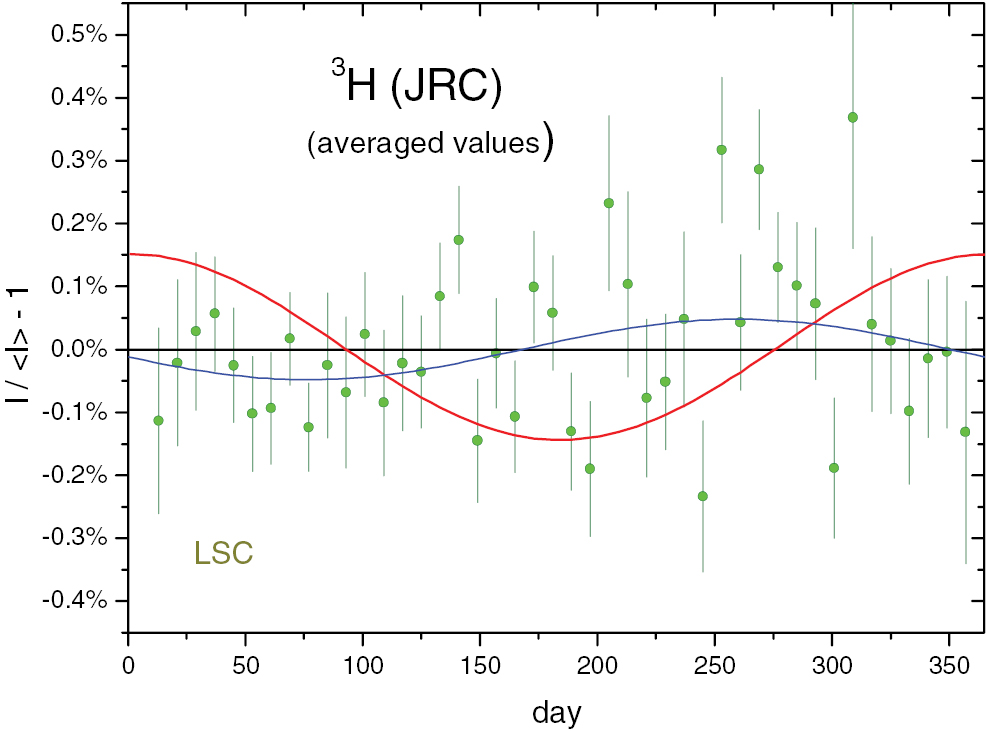
At the radionuclide metrology laboratory of the JRC in Geel (Belgium), a series of 706 activity measurements of a tritium source was performed from 2002 to 2014 by means of liquid scintillation counting with a Packard Tri-Carb 3100 TR/AB LSC. The decay-corrected activity values of the 3H source show a standard deviation of 0.4%, which is one or two orders of magnitude lower than the residuals claimed by others [4, 32]. The residuals from exponential decay shown in figure 2 do not reveal a systematic pattern at annual level, which is confirmed by a plot of the averaged residuals grouped over 8 d periods of the year in figure 3. The best fitting sinusoidal function has an amplitude of A = 0.048 (24)% and a phase of a = 197 d. A search for periodicity in the neighbourhood of 1 month did not yield a significant result (A = 0.023 (22)% at a period of 28 d). This refutes the claims that the decay of tritium is modulated at the percent level and puts to question the quality of the metrological processes which led to this conclusion.
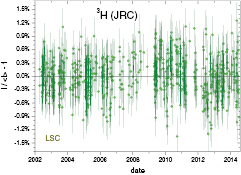
Figure 2. Residuals from exponential decay for 3H decay rate measurements by liquid scintillation counting at JRC.
Download figure:
Standard image High-resolution image
Figure 3. Annual average residuals from exponential decay for 3H decay rate measurements by LSC at JRC. One (red) line represents relative changes in the inverse square of the Earth–Sun distance, normalised to 0.15% amplitude, and the other (blue) line a sinusoidal function fitted to the data.
Download figure:
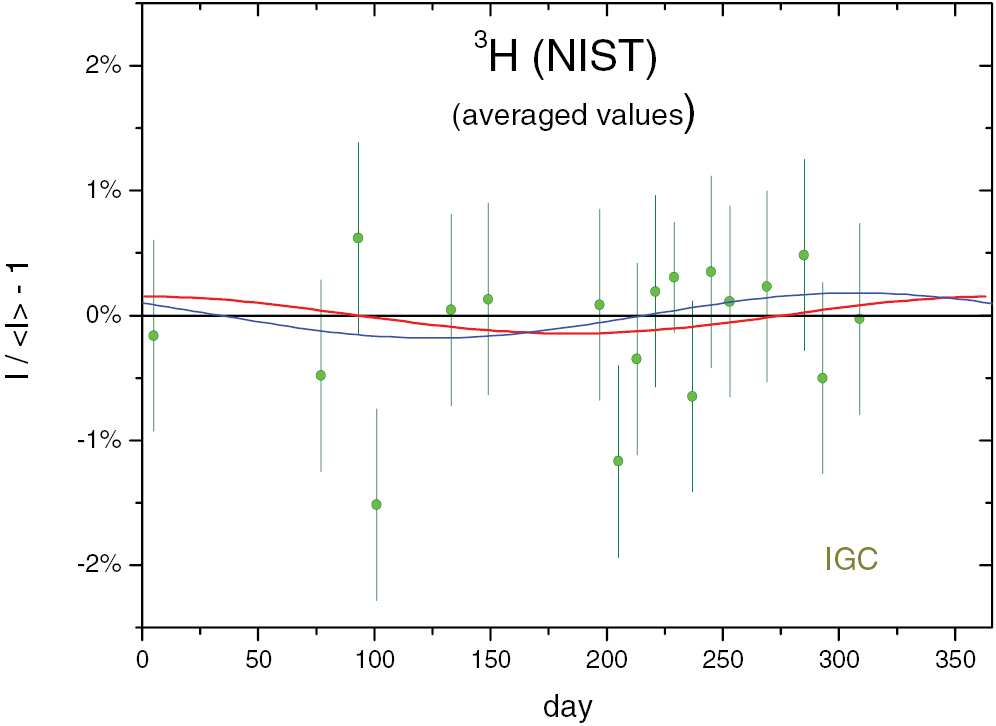
Standard image High-resolution image2.3. 3H @NIST
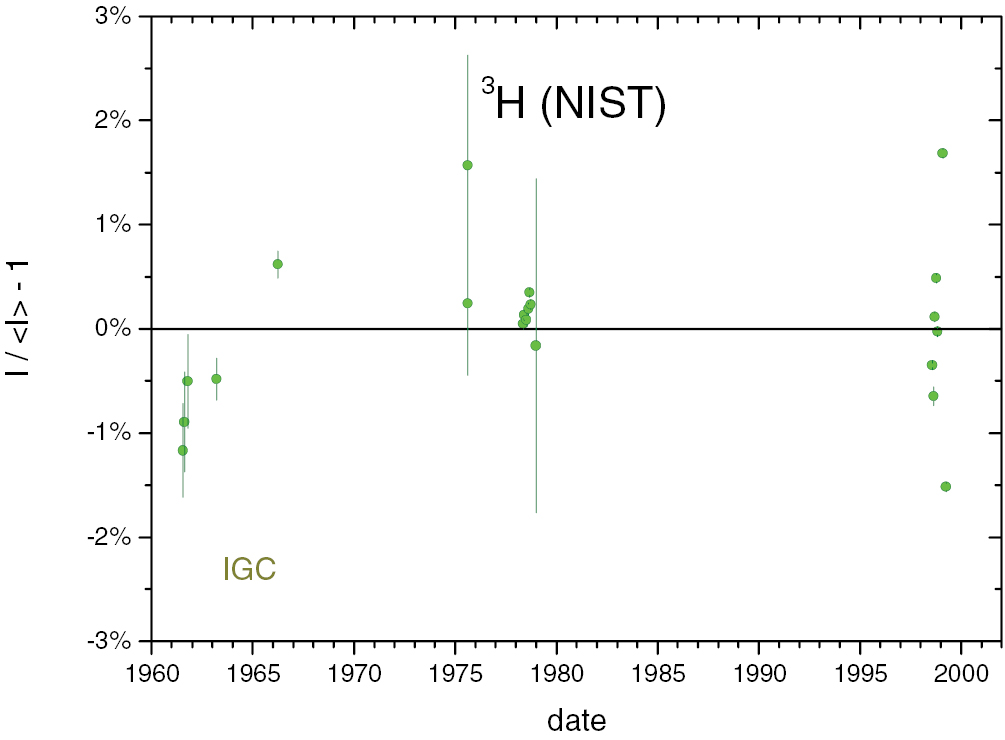
Due to the low energy of the emitted beta particle and the absence of subsequent gamma-ray emission in the decay of 3H, not many techniques are suitable for absolute activity measurements of this nuclide. Internal gas proportional counting [34] is a method applied at the NIST for the standardisation of 3H in gas. The radioactive gas is mixed with counter gas and measured in a set of proportional counters of different length. Measurements on the same 3H standard performed between 1961 and 1999 were collected and the residuals from exponential decay are shown in figure 4. Whereas the data should be free of bias, there is an appreciable standard deviation of 0.8% (after elimination of two extreme data) which demonstrates the difficulty of measurement reproducibility in this case. Nevertheless, the averaged data set in figure 5 shows no annual modulations at the percent level (A = 0.18 (20)%, a = 149 d).

Figure 4. Residuals from exponential decay for 3H activity measurements by internal gas proportional counting at NIST.
Download figure:
Standard image High-resolution image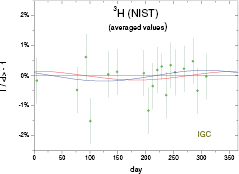
Figure 5. Annual average residuals from exponential decay for 3H activity measurements by internal gas proportional counting at NIST.
Download figure:
Standard image High-resolution image3. Carbon-14
3.1. Decay characteristics
Carbon-14 (5700 (30) a) disintegrates 100% by β− decay to the ground state of the stable nuclide 14N. The average emission energy of the beta particle is 49.16 (1) keV with a maximum of 156.476 (1) keV [15]. It is used as a nuclear chronometer for determining the age of organic material [35]; 'radiocarbon dating' has become a standard tool for archaeologists.
In recent work, Mueterthies et al [13] referred to prepublication results from Scott Mathews on measured seasonal variations in the decay rate of 14C with an amplitude in the order of 2–4 permille. This is similar to the permille level oscillations claimed for other beta decaying radionuclides, including 3H, 22Na/44Ti, 54,56Mn, 60Co, 85Kr, 90Sr, 108mAg, and 152,154Eu [13].
3.2. 14C @JRC
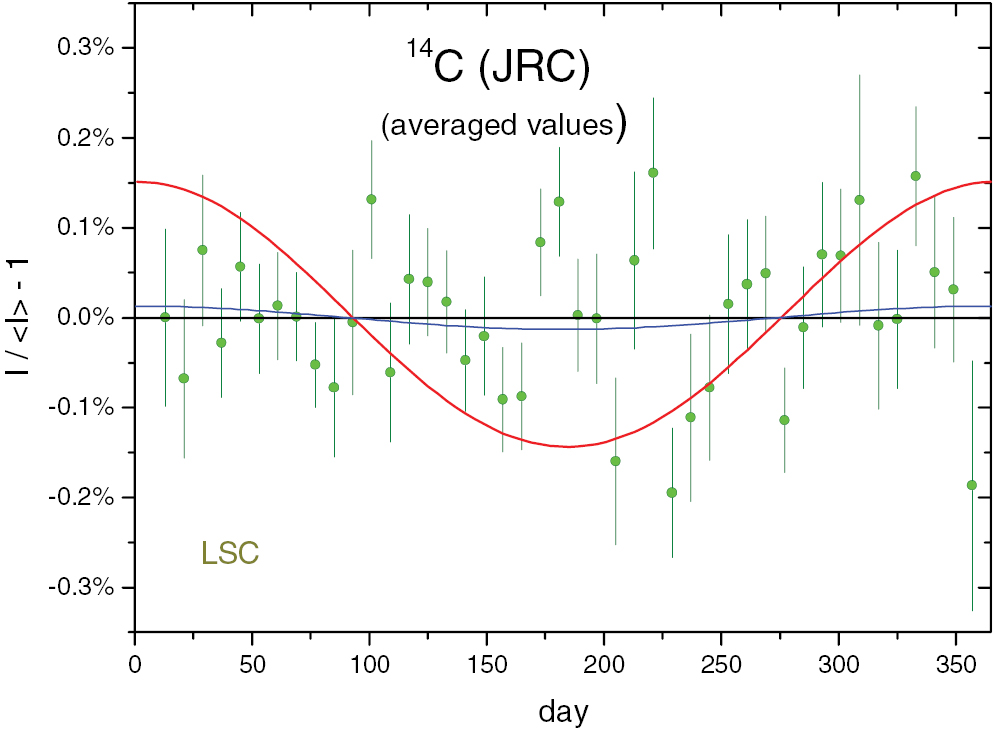
In parallel with the tritium measurements discussed in section 2.2, the JRC has performed a series of 706 activity measurements of a 14C standard over a period of 12 years, from 2002 to 2014, by means of liquid scintillation counting with a Packard Tri-Carb 3100 TR/AB LSC. The decay-corrected 14C activity values have a comparably smaller standard deviation of 0.28%, probably because the beta energy is 10 times higher than in the decay of 3H. The residuals from exponential decay presented in figure 6 show no discernible systematic pattern and the annual average residuals in figure 7 disprove the occurrence of significant oscillations at the permille level: they show perfect exponential behaviour down to the 10−4 level (A = 0.013 (16)%, a = 92 d).

Figure 6. Residuals from exponential decay for 14C decay rate measurements by liquid scintillation counting at JRC.
Download figure:
Standard image High-resolution image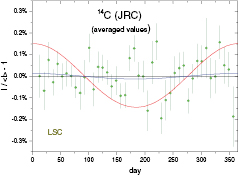
Figure 7. Annual average residuals from exponential decay for 14C decay rate measurements by LSC at JRC. One (red) line represents relative changes in the inverse square of the Earth–Sun distance, normalised to an amplitude of 0.15% and the other (blue) line a sinusoidal function fitted to the data.
Download figure:
Standard image High-resolution imageJust as for tritium, the observation of non-exponential behaviour in beta decay of 14C seems to be more of a metrological issue than a physical one. As for nuclear dating purposes, there is no indication that significant variations in the decay constant are present which could affect the accuracy of the method. There is also no sign of a common effect on the decay rate of 3H and 14C—be it driven by solar neutrinos, relic neutrinos or instrument bias—since the measurements performed on the same day show no correlation in the respective residuals plotted in figure 8.

Figure 8. Residuals from exponential decay for 14C as a function of residuals for 3H for 706 measurements performed at the same day with the same LSC instrument at JRC.
Download figure:
Standard image High-resolution image3.3. 14C @NMISA
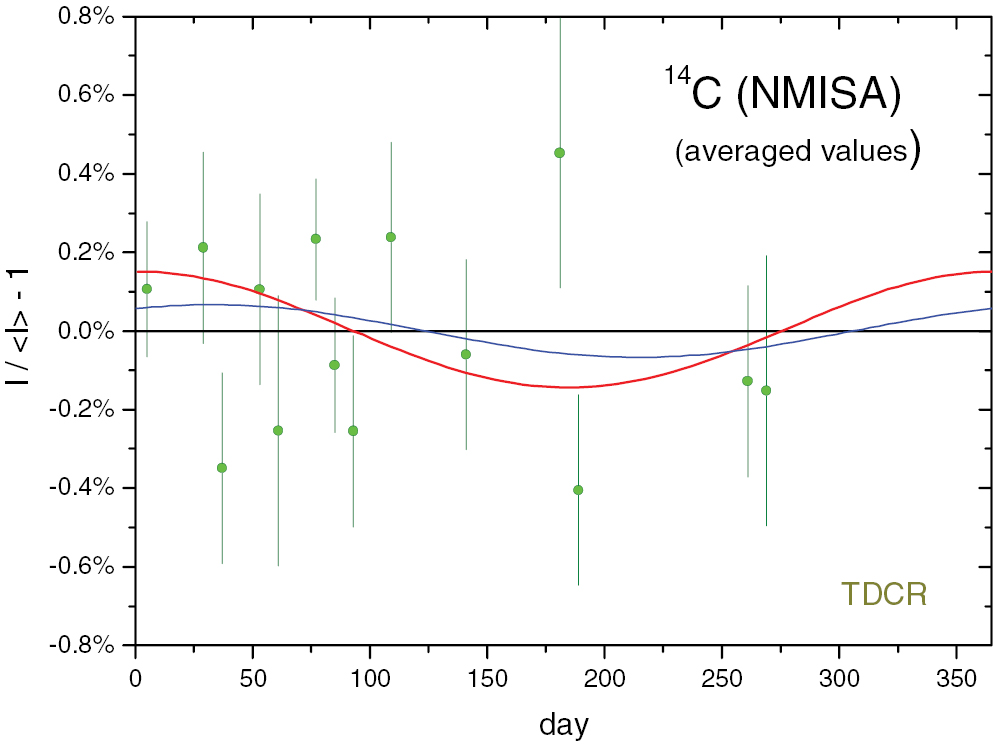
The activity of pure beta emitters like 14C can also be measured in an absolute way with triple-to-double coincidence ratio counting (TDCR), a method in which the source material is mixed into a liquid scintillation cocktail and light flashes are collected from three photomultiplier tubes [36]. The NMISA (South-Africa) performed 33 TDCR measurements of 14C activity (of which one data point was omitted as outlier). The residuals from an exponential decay curve are shown in figure 9 and the annual averaged data in figure 10. The data show no modulations of permille level (A = 0.067 (80)%, a = 59 d) in the decay of 14C. The invariability of the 14C decay constant is therefore confirmed in the southern as well as the northern hemisphere (section 3.2).
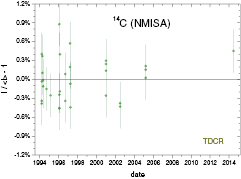
Figure 9. Residuals from exponential decay for 14C decay rate measurements by triple-to-double coincidence measurements at NMISA.
Download figure:
Standard image High-resolution image
Figure 10. Annual average residuals from exponential decay for 14C decay rate measurements by TDCR at NMISA.
Download figure:
Standard image High-resolution image4. Cobalt-60
4.1. Decay characteristics
Cobalt-60 disintegrates by β− emission to excited levels of 60Ni, followed by emissions in cascade of the characteristic 60Ni gamma rays of 1173.2 keV and 1332.5 keV [15]. The radionuclide 60Co has applications in reference sources for gamma detector calibrations, radiation sources for medical radiotherapy, sterilisation of medical equipment, food and blood and as a tracer for cobalt in chemical reactions.
On the basis of measurements with a Geiger–Müller counter, Parkhomov [7] claimed that the decay rate of a 60Co source shows systematic annual variations with a magnitude of 0.2% and related this effect to seasonal changes in cosmic neutrino flux affecting beta decay.
4.2. 60Co @NIST (#1)
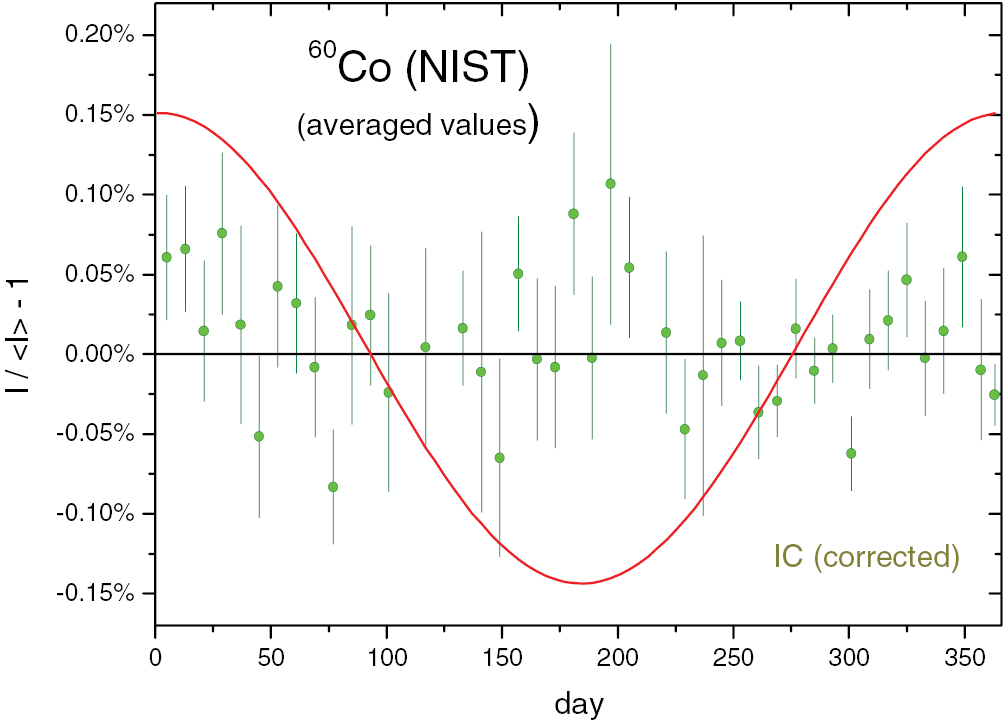
Between 1968 and 2007, 250 current measurements of the 60Co source #4203 were performed in an ionisation chamber (IC 'A') at the NIST (USA). Whereas the chamber suffered from geometrical changes in the suspension of the source holder over these 4 decades (see section 9.5), the effect on the 60Co measurements was relatively small owing to the high energy of the emitted gamma rays. Linear corrections were applied to the data, even though this had little effect on the residuals to an exponential fit (besides a difference in slope of the fitted exponential). The residuals in figure 11 show residuals in the permille range and the averaged values in figure 12 are free of annual oscillations at the 10−4 level or even lower (A = 0.007 (7)%, a = 0 d). An additional set of 46 measurements of source #274 was analysed as well, yielding incomplete coverage over the year and less conclusive evidence of stability (A = 0.036 (15)%, a = 80 d). The stability of these results proves that annual oscillations at the permille level are neither a common feature of beta decay in general, nor of 60Co decay in particular.
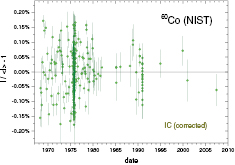
Figure 11. Residuals from exponential decay for 60Co activity measurements with ionisation chamber 'A' at NIST, after applying linear corrections for the gradual efficiency changes due to slippage of the source holder.
Download figure:
Standard image High-resolution image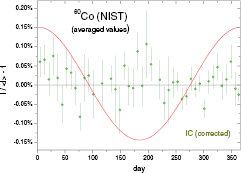
Figure 12. Annual average residuals from exponential decay for 60Co decay rate measurements with IC 'A' at NIST.
Download figure:
Standard image High-resolution image4.3. 60Co @NIST (#2)
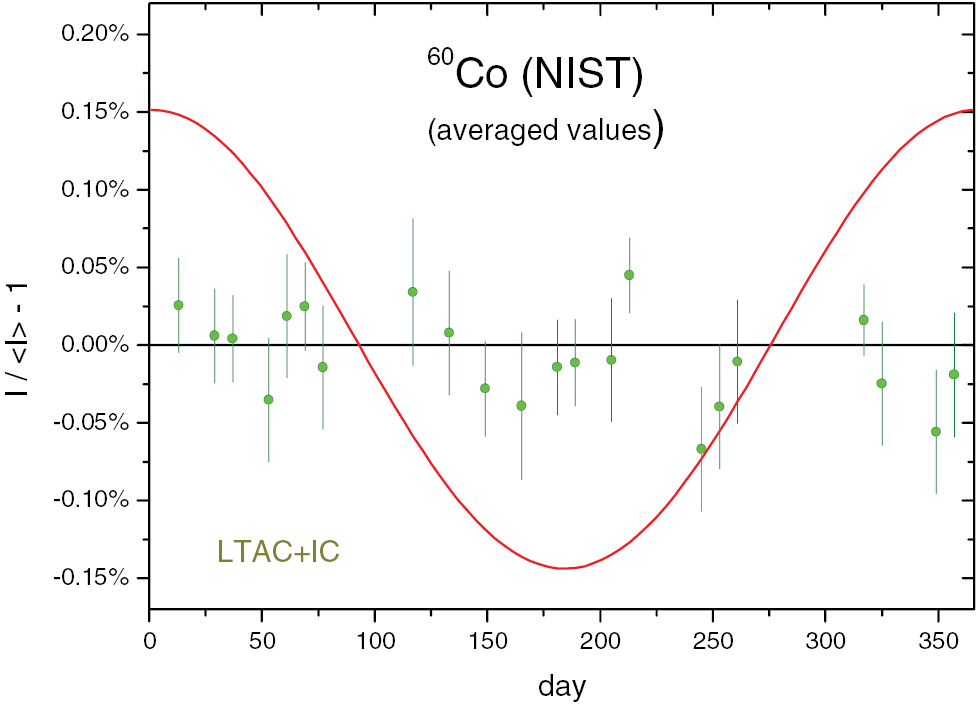
Between 2007 and 2015, the NIST has performed 26 primary standardisation measurements of two 60Co sources by means of live-timed anticoincidence counting (LTAC). This method is accurate in the sense that it gives a precise absolute value of the source activity which is largely insensitive to small changes in the efficiencies of the LTAC detectors [37]. In the same period, a few measurements of a higher-activity 60Co source were performed with comparable precision in the 'AutoIC' ionisation chamber and these data were added to the analysis. The residuals for the LTAC and IC data are all within 0.1% of an exponential slope (figure 13), and the annual averages (figure 14) show no statistically significant seasonal effects (A = 0.007 (9)%, a = 18 d). This is evidence of purely exponential decay down to the 10−5 level.

Figure 13. Residuals from exponential decay for 60Co activity measurements of two sources by 4πβ − γ anti- coincidence counting at NIST and 60Co current measurements in the AutoIC.
Download figure:
Standard image High-resolution image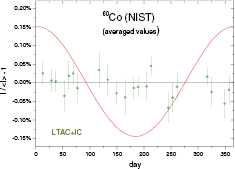
Figure 14. Annual average residuals from exponential decay for 60Co activity measurements by LTAC and AutoIC at NIST.
Download figure:
Standard image High-resolution image4.4. 60Co @JSI
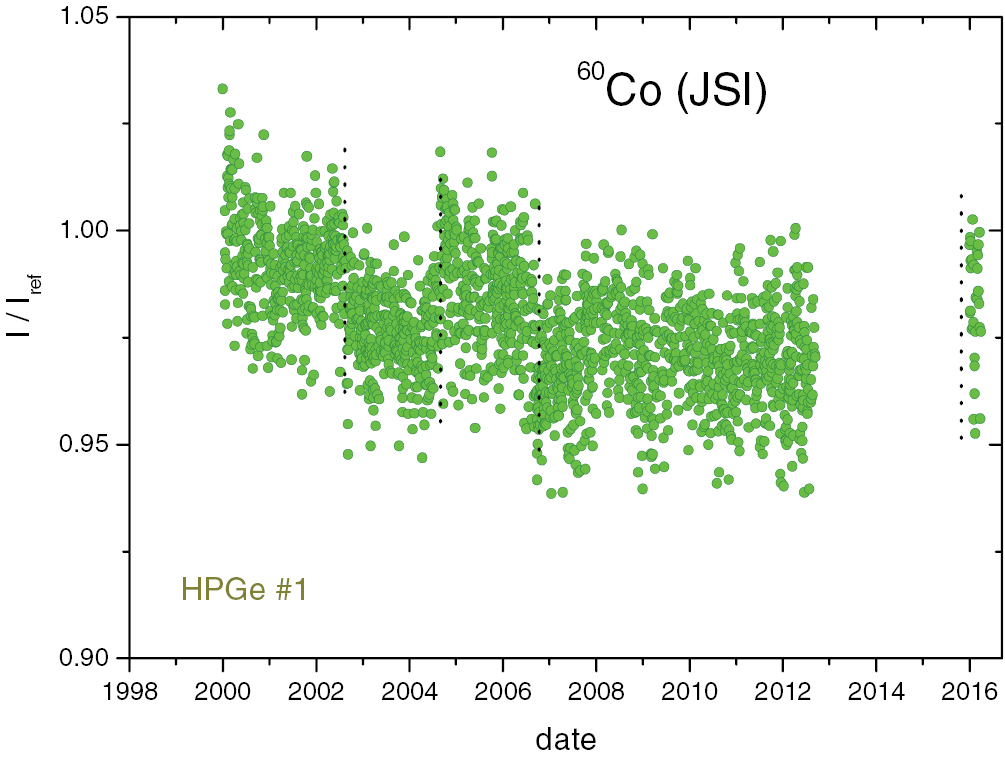
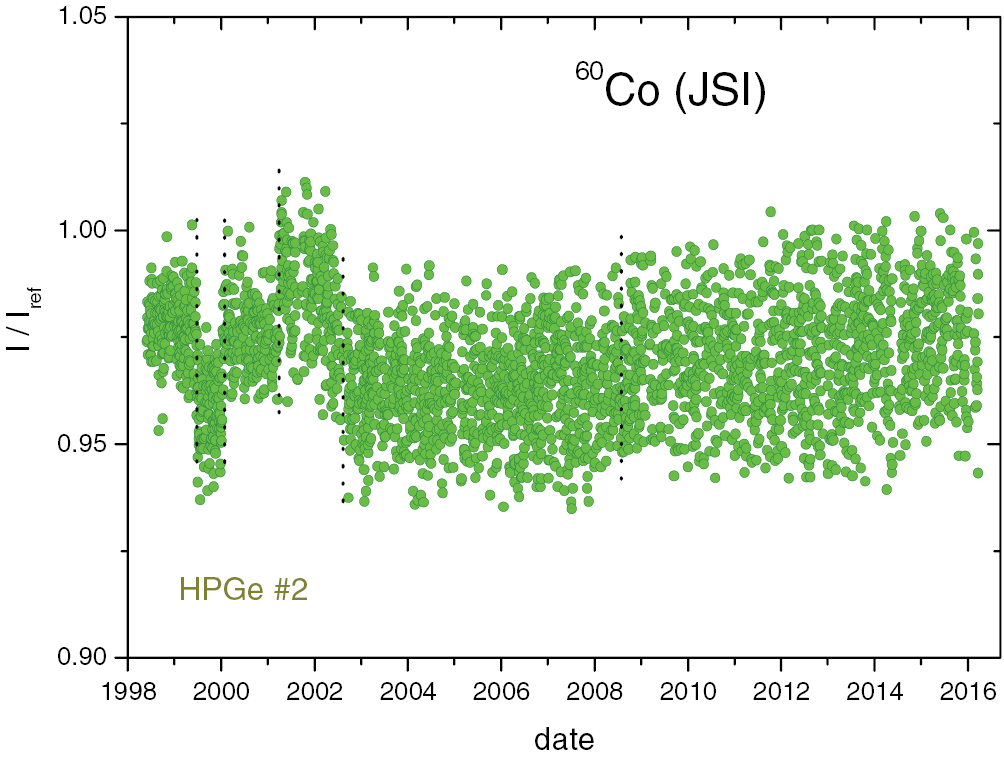
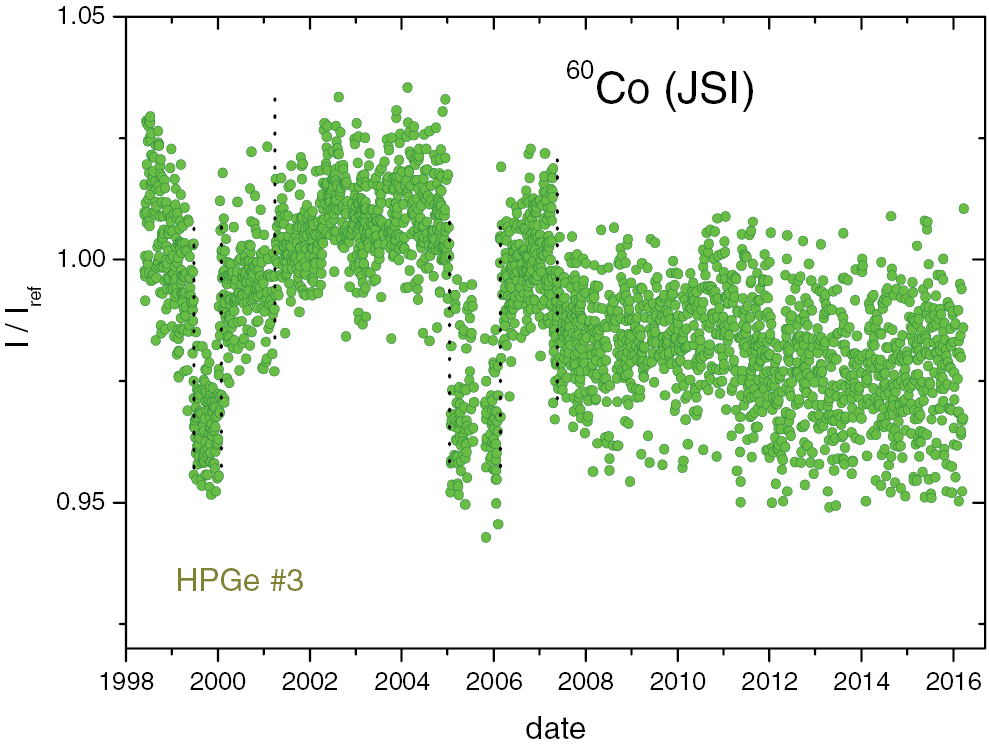
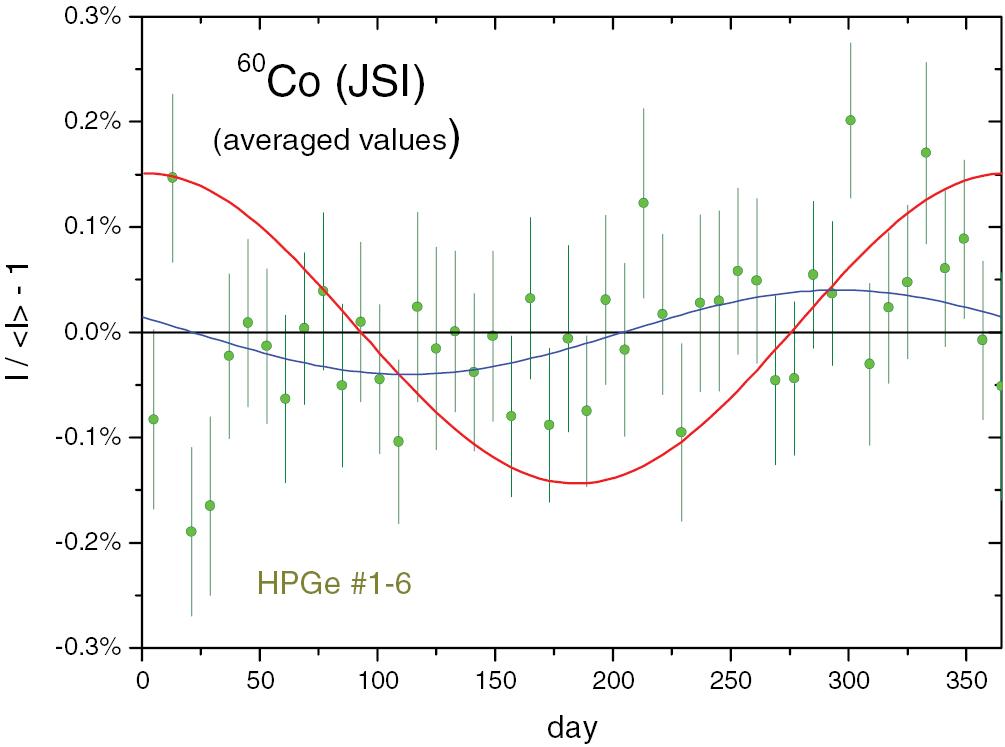
In the frame of quality control of gamma-ray spectrometry, the JSI (Slovenia) has performed 2183–3250 60Co point source measurements on 6 HPGe detectors between 1998 and 2016. The activity values were recorded relative to the certified value of the source. In figures 15–17, the data sets are presented for three detectors. They show explicit jumps due to recalibrations of the detectors. Two subjective actions were performed to produce the annual averages in figure 18: (1) groupings were identified by eye and renormalised, and (2) an 8% fraction of extreme data was eliminated. Assuming that these interventions were mainly compensating for temporary instrumental instabilities and recalibrations, one can conclude that the spectrometry data were barely affected by annual changes through physical processes (A = 0.041 (14)%, a = 161 d).
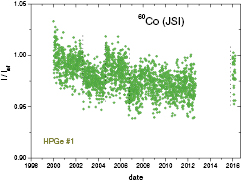
Figure 15. Residuals from exponential decay for 60Co activity measurements by γ-ray spectrometry with HPGe #1 at JSI. The jumps (at the dotted lines) correspond to recalibrations of the detector.
Download figure:
Standard image High-resolution image
Figure 16. Residuals from exponential decay for 60Co activity measurements by γ-ray spectrometry with HPGe #2 at JSI. The jumps (at the dotted lines) correspond to recalibrations of the detector.
Download figure:
Standard image High-resolution image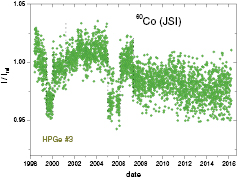
Figure 17. Residuals from exponential decay for 60Co activity measurements by γ-ray spectrometry with HPGe #3 at JSI. The jumps (at the dotted lines) correspond to recalibrations of the detector.
Download figure:
Standard image High-resolution image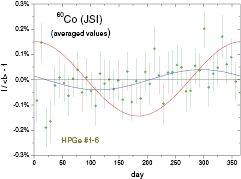
Figure 18. Annual average residuals from exponential decay for 60Co activity measurements by γ-ray spectrometry with 6 HPGe detectors at JSI. The (blue) line with 0.041% amplitude is a sinusoidal fitted to the data.
Download figure:
Standard image High-resolution imageConsidering that the residuals in the 6 data sets show non-random, auto-correlated deviations from the exponential law, some authors may be tempted to perform a frequency analysis to extract 'relevant frequencies' and look for correlations with cosmic phenomena which could have influenced the decay rate. However, the fact that the structure of the residuals for the same source in one laboratory over the same time period differs from one detector to another should be a hint that the instabilities are of a local nature rather than of cosmic origin.
5. Krypton-85
5.1. Decay characteristics
Krypton-85 (10.752 (23) a) disintegrates by β− emission mainly to the ground level (99.562 (10)%) and the 514 keV excited level (0.438 (10)%) of 85Rb [15]. There is a 'weak' characteristic gamma ray of 514 keV with 0.435% intensity.
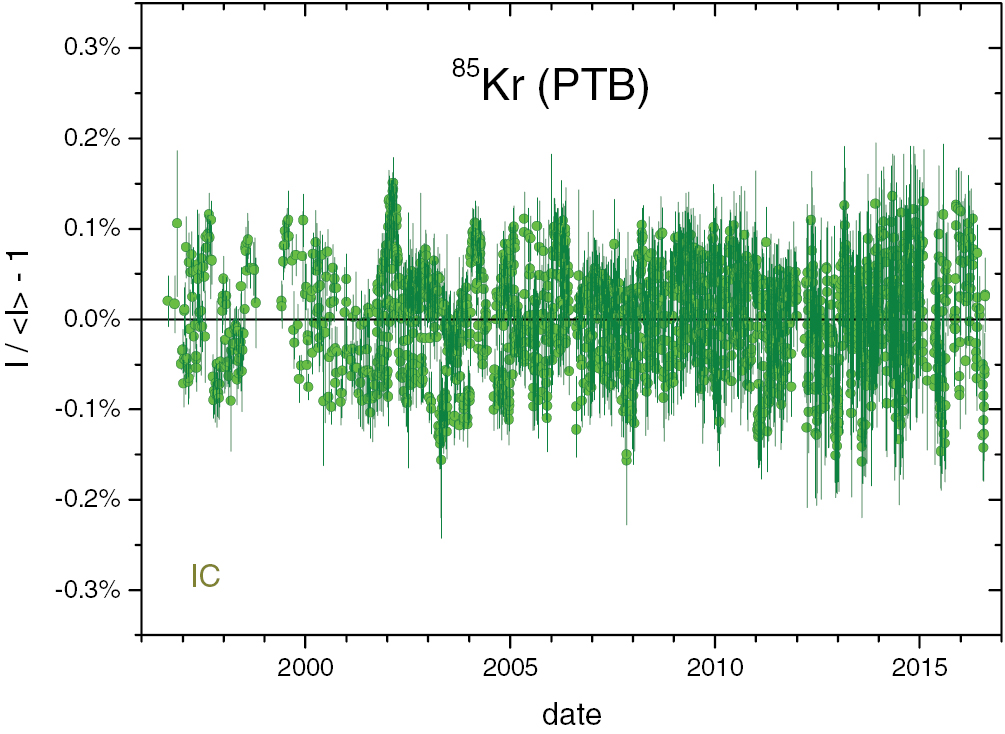
Mueterthies et al [13] listed 85Kr as one of the radionuclides showing annual oscillations of 0.1% amplitude, based on IC measurements at PTB. Similar modulations in this IC have been observed for other nuclides (90Sr, 108mAg, 133Ba, 137Cs, 152,154Eu), and they can be significantly reduced by taking a ratio with the ionisation current of the 226Ra check source or another long-lived radionuclide measured in parallel [38, 39].
5.2. 85Kr @NIST
A series of 98 decay rate measurements were performed of a 85Kr source in the NIST IC 'A' from 1980 until 2007. As can be seen from the residuals to the fitted exponential curve (figure 19) and the annual averaged data (figure 20), the measurements are not evenly distributed in time and do not cover every period in the year. The amplitude of the fitted sinusoidal remains nevertheless well below the permille level (A = 0.036 (15)%, a = 153 d).
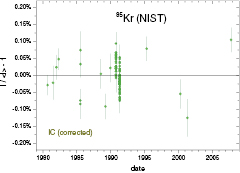
Figure 19. Residuals from exponential decay for 85Kr decay rate measurements with IC 'A' at NIST, after applying linear corrections for gradual efficiency changes.
Download figure:
Standard image High-resolution image
Figure 20. Annual average residuals from exponential decay for 85Kr decay rate measurements with IC 'A' at NIST. One (red) line represents relative changes in the inverse square of the Earth–Sun distance, normalised to 0.15% amplitude, and the other (blue) line a sinusoidal function fitted to the data.
Download figure:
Standard image High-resolution image5.3. 85Kr @PTB
As with the IC measurements of 226Ra at the PTB before 1999 [1], ionisation current measurements of 85Kr from 1990 to 1995 showed a clear annual modulation of permille-level amplitude which can be attributed to instability of the Townsend balance current measurement system. The residuals have been published and discussed by Schrader [38]. In figure 21 the annual average residuals are presented with the fitted sinusoidal oscillation (A = 0.074 (3)%, a = 67 d). They are of similar amplitude and phase as the 226Ra readouts (A = 0.084 (5)%, a = 64 d) over exactly the same time period [1].

Figure 21. Annual average residuals from exponential decay for 85Kr ionisation current measurements with the IG12 IC at PTB between 1990 and 1996. The data were not normalised to a check source and the oscillations are due to instabilities in the townsend balance current readout.
Download figure:
Standard image High-resolution imageIn the current work, analysis is performed on 2163 85Kr measurements collected from 1996 to 2016 in the same IC, but with a more stable electrometer [39]. The data were taken relative to the 226Ra reference source (A = 0.016 (1)%, a = 194 d) [1, 3] to compensate—at least partly—for instrumental instability. The decay-corrected IC output in figure 22 shows a permille-level long-term drift which was also observed with other nuclides measured over the same period (e.g. 133Ba [2]). This was compensated for in this work by linear adjustments over 4 time regions and exclusion of 46 extreme data (in value or uncertainty). The resulting residuals in figure 23 have a standard deviation of 0.06% and show some local non-random structures. The averaged residuals in figure 24 exhibits an annual modulation of comparable amplitude as for other nuclides in the same IC (A = 0.013 (2)%, a = 37 d). It may have been caused by the normalisation relative to the 226Ra check source [1] (see sections 6.2, 9.4 and 10.2).

Figure 22. Decay-corrected ionisation currents of a 85Kr source in the IG12 IC at PTB as a function of date of measurement.
Download figure:
Standard image High-resolution image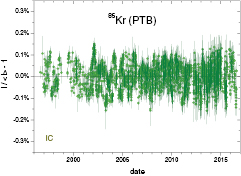
Figure 23. Residuals from exponential decay for 85Kr ionisation current measurements (relative to the 226Ra check source) with the IG12 IC at PTB, after applying linear detrending corrections.
Download figure:
Standard image High-resolution image
Figure 24. Annual average residuals from exponential decay for 85Kr ionisation current measurements (relative to the 226Ra check source) with the IG12 IC at PTB.
Download figure:
Standard image High-resolution image6. Strontium-90
6.1. Decay characteristics
Strontium-90 (28.80 (7) a) decays 100% by β− emission to the ground state of 90Y (2.6684 (13) d), which in turn decays by β− emission to 90Zr, mainly to the ground state (99.983%) and a small branch to the level at 1760 keV [15].
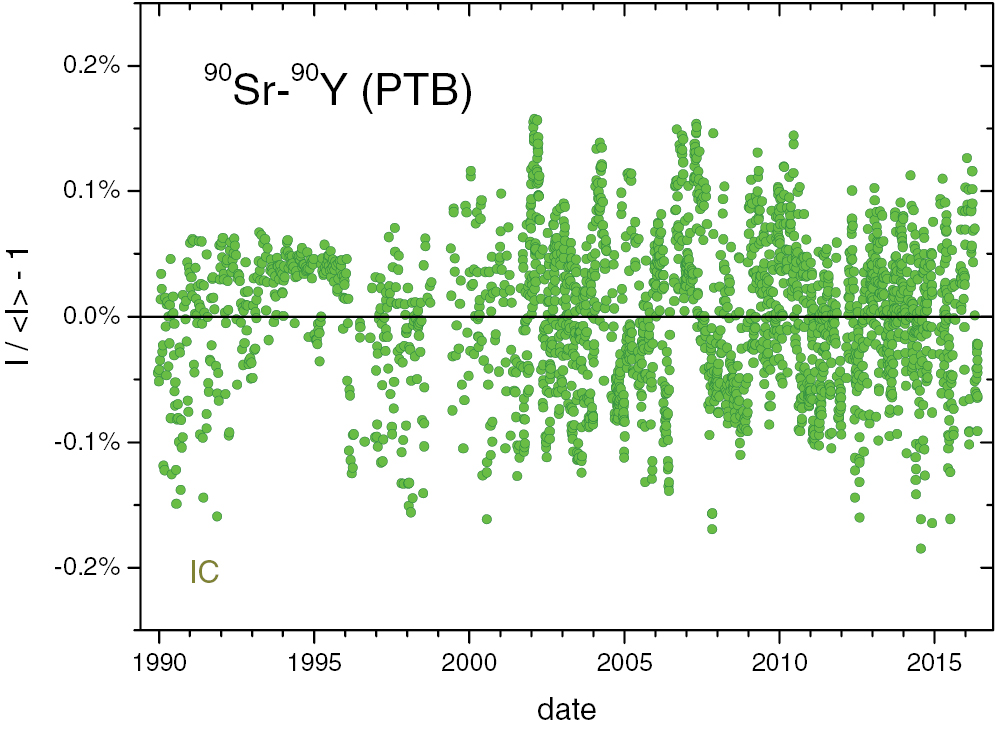
On a time scale of weeks or months, the activity of the short-lived daughter 90Y may be assumed to be in equilibrium with its long-lived parent nuclide 90Sr, irrespective whether the 90Y half-life is constant or modulated as a function of time. According to Parkhomov [7], count rate measurements with a Geiger–Müller counter of beta particles emitted by a 90Sr–90Y source show a distinct annual modulation with 0.13% amplitude. Sturrock et al [40] claim the presence of an 11 a modulation in at least one of the 90Sr–90Y decay rate measurements performed at the PTB (see section 6.3), and called it 'suggestive of an influence of internal solar rotation'.
6.2. 90Sr–90Y @PTB (#1)
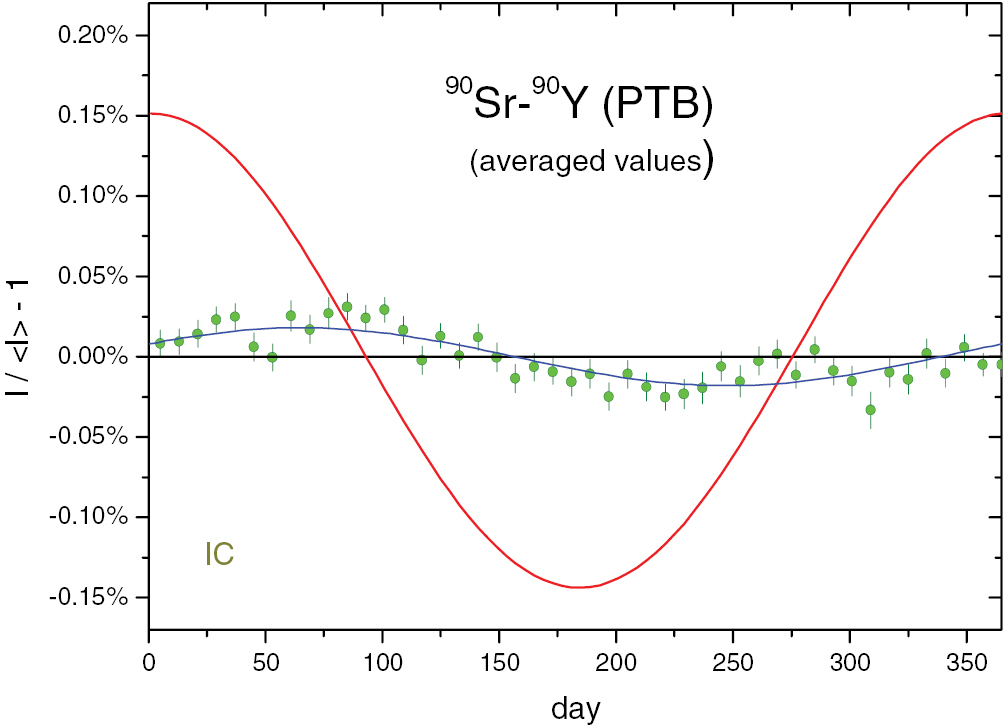
From the end of 1989 until 2016, in total 2207 measurements were performed of a 90Sr solid source in the IG12/A20 IC at the PTB. Since the data set showed trending behaviour over different multi-annual periods of time, the data were subdivided in five time regions and realigned through a linear transformation in each region. By doing so, possible annual modulations would remain visible in the residuals to an exponential fit, whereas the effects of long-term instabilities would be suppressed. The residuals in figure 25 are in the permille level and show some autocorrelation. The annually averaged residuals in figure 26 show a distinct but small sinusoidal seasonal dependency (A = 0.018 (2)%, a = 26 d) which is almost identical to the modulations observed in the decay of 137Cs (section 9.4) and other nuclides with the same IC [2]. Since the measurement results were analysed relative to the signals of the 226Ra check source, one has to take into account that the modulations in the 226Ra data (A = 0.016 (1)%, a = 194 d) [1, 3] have been transferred inversely through the normalisation procedure.

Figure 25. Residuals from exponential decay for 90Sr–90Y activity measurements (relative to the 226Ra check source) with the IG12 IC at PTB. One (red) line represents relative changes in the inverse square of the Earth–Sun distance, normalised to 0.15% amplitude, and the other (blue) line a sinusoidal function fitted to the data.
Download figure:
Standard image High-resolution image
Figure 26. Annual average residuals from exponential decay for 90Sr–90Y activity measurements (relative to the 226Ra check source) with the IG12 IC at PTB.
Download figure:
Standard image High-resolution image6.3. 90Sr–90Y @PTB (#2)
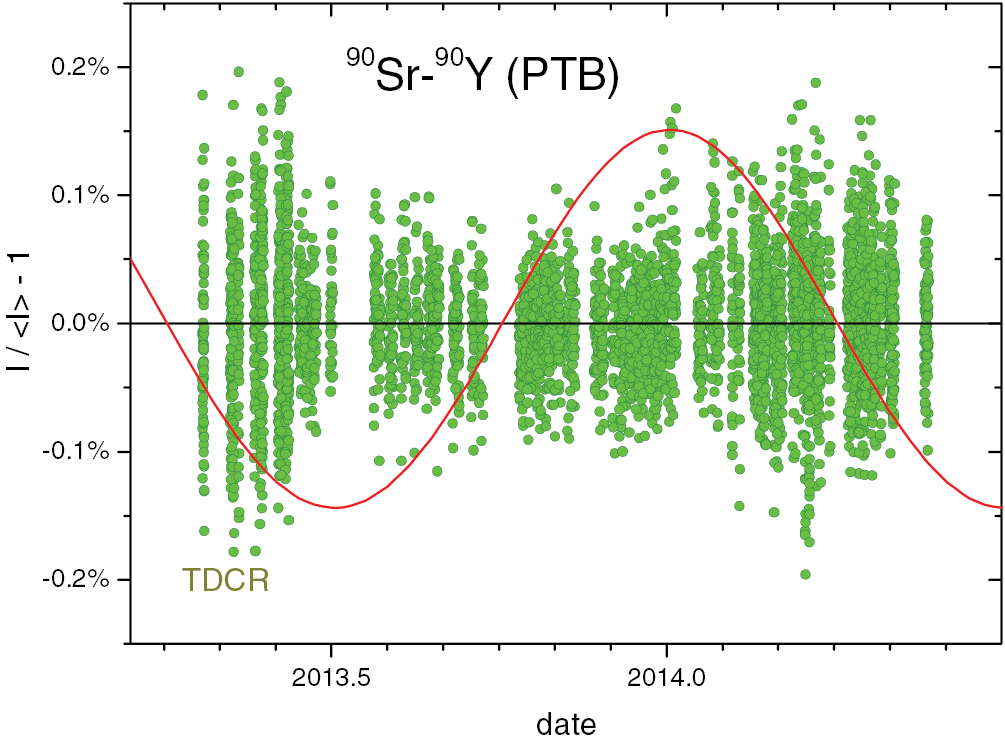
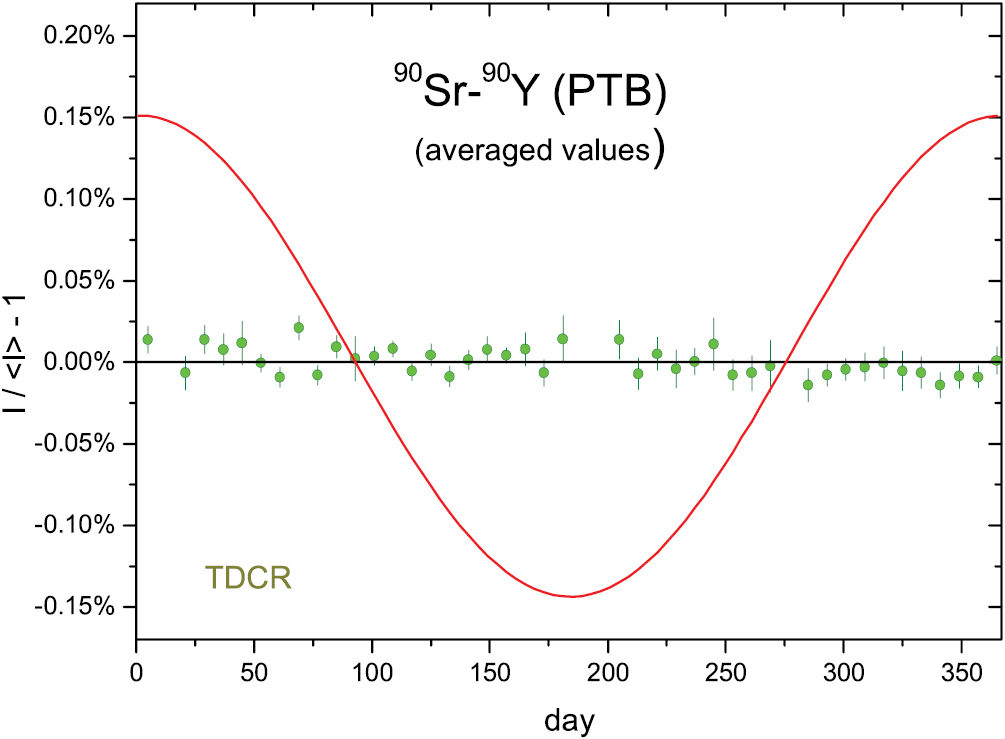
In 2015, Kossert and Nähle [28] published a long-term measurement series performed between 24 April 2013 and 26 May 2014 of three 90Sr–90Y sources. They used a custom-built liquid scintillator set-up with three photomultiplier tubes and a sample changer and applied TDCR. With this primary standardisation technique, the detection efficiency is derived from the measurement itself, thus leading to a more reliable activity measurement [36] than e.g. the unstable Geiger–Müller measurements of 90Y by Parkhomov [7]. The PTB collected 4493 data (figure 27) with a standard deviation of 0.05%, and the averages in figure 28, show remarkable stability (A = 0.004 (2)%, a = 362 d). This refutes the conjecture that beta decay of 90Sr–90Y would be modulated at the permille level [7]. The data exclude systematic modulations at any frequency between a day and a year.
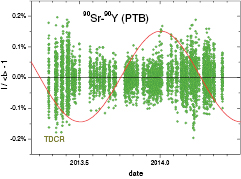
Figure 27. Residuals from exponential decay for 90Sr–90Y activity measurements by TDCR with liquid scintillation counters at PTB.
Download figure:
Standard image High-resolution image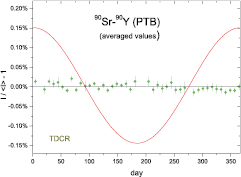
Figure 28. Annual average residuals from exponential decay for 90Sr–90Y activity measurements by TDCR at PTB.
Download figure:
Standard image High-resolution imageOn the basis of these data, Sturrock et al [40] admitted that earlier reports of annual oscillations in 90Sr–90Y decay could have been caused by environmental factors instead of solar proximity, but then tried to make a new case for solar rotation effects occurring at a frequency of 11 a. They claim that a power analysis of the data set (covering only 1 year of measurement!) shows significant proof for the presence of an 11 a modulation, at least for source S2 (mostly measured at night) but not for source S4 (mostly measured during the day). They give an unsubstantiated explanation in which it is assumed that neutrino-induced beta decay not only confines beta particle emission to a cone in the direction of the incoming neutrino, but apparently also the scintillation photons produced in the cocktail, thus giving rise to an angular dependency of triple coincidences in the TDCR. In this work, an 11 a sinusoidal function was fitted to the residuals of the S2 and S4 data and no significant amplitude was found (A < 4 × 10⁻⁶) in comparison to the standard deviation of the data (5 × 10⁻⁴).
7. Antimony-124
7.1. Decay characteristics
The relatively short-lived radionuclide 124Sb (60.208 (11) d) disintegrates through β− emission to various excited levels in 124Te, which deexcite through gamma transitions of various energies [15].
7.2. 124Sb @JRC
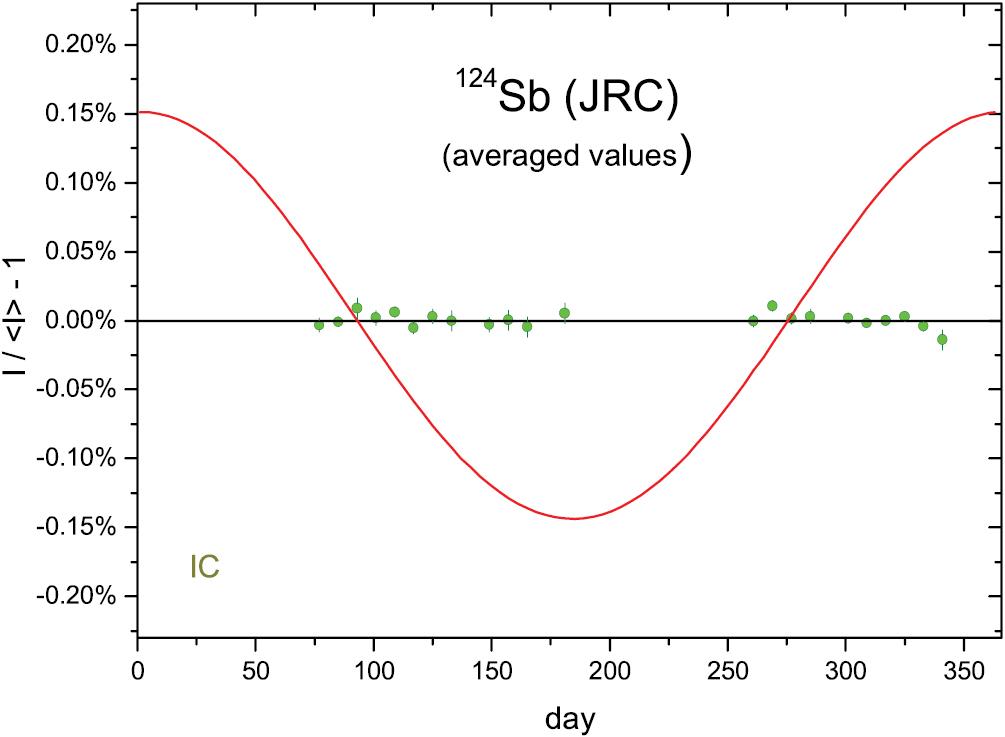
In 2007, Paepen et al [41] performed 10138 current measurements of a 124Sb source in the IG12 IC at the JRC and took daily averages keeping only 46 values quasi-free from background and interfering signals over 221 d (A = 0.0006 (18)%, a = 281 d). A reanalysis was done taking 59 data into account covering 259 d and still showing remarkable stability (A = 0.003 (2)%, a = 241 d) in the average residuals in figure 29. Whereas not a full year was covered, the absence of seasonal effects has been convincingly demonstrated at the 10−4 level or lower.

Figure 29. Annual average residuals from exponential decay for 124Sb activity measurements with an ionisation chamber at JRC.
Download figure:
Standard image High-resolution image7.3. 124Sb @PTB
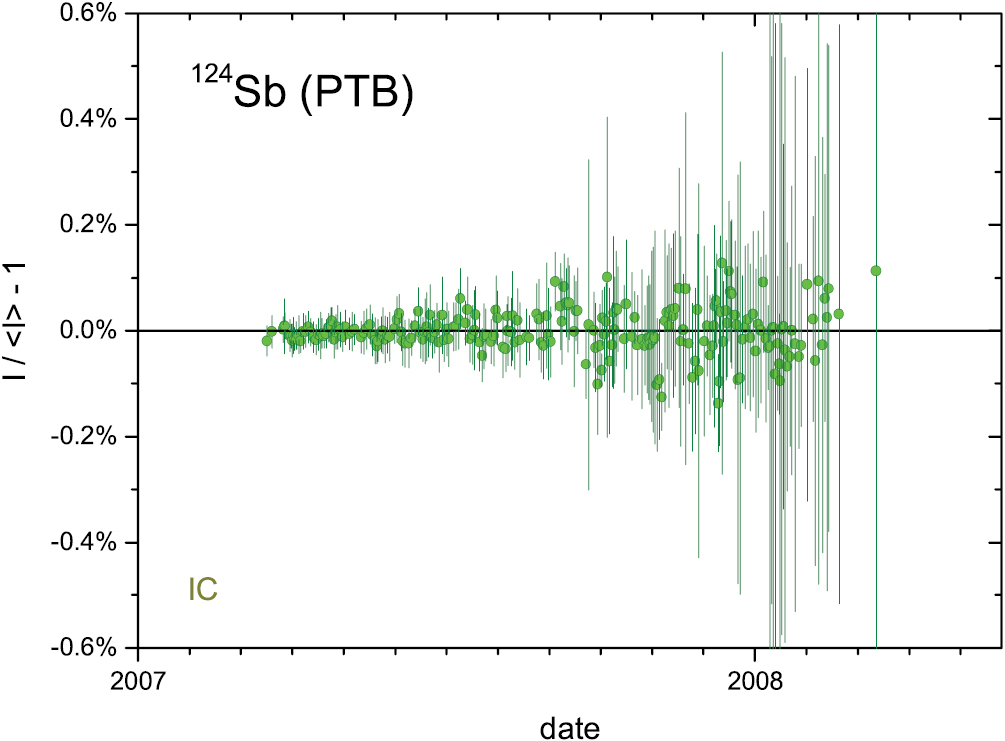
From March 2007 to April 2008, the PTB performed 232 ionisation current measurements of a 124Sb source (from the same stock solution as the JRC) in the IG12/A20 IC, of which 226 data were selected for analysis. A small linear detrending correction was performed on the decay-corrected data obtained after November 2007, resulting in the residuals presented in figure 30. The average residuals in figure 31 confirm that there are certainly no annual modulations at the 10−4 level (A = 0.006 (3)%, a = 201 d).
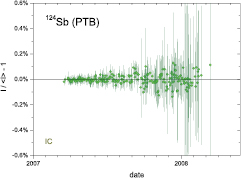
Figure 30. Residuals from exponential decay for 124Sb ionisation current measurements at PTB, with a small linear correction for data measured after November 2007.
Download figure:
Standard image High-resolution image
Figure 31. Annual average residuals from exponential decay for 124Sb ionisation current measurements at PTB.
Download figure:
Standard image High-resolution image8. Cesium-134
8.1. Decay characteristics
Cesium-134 (2.0644 (14) a) decays mainly by β− emission to excited levels of 134Ba, and an insignificant fraction (0.0003%) undergoes electron capture [15]. It is abundantly produced in nuclear fission reactors through neutron capture of 133Cs and has gamma transitions which are useful for energy calibrations of spectrometers typically in the 475 keV–802 keV energy region.
8.2. 134Cs @JRC
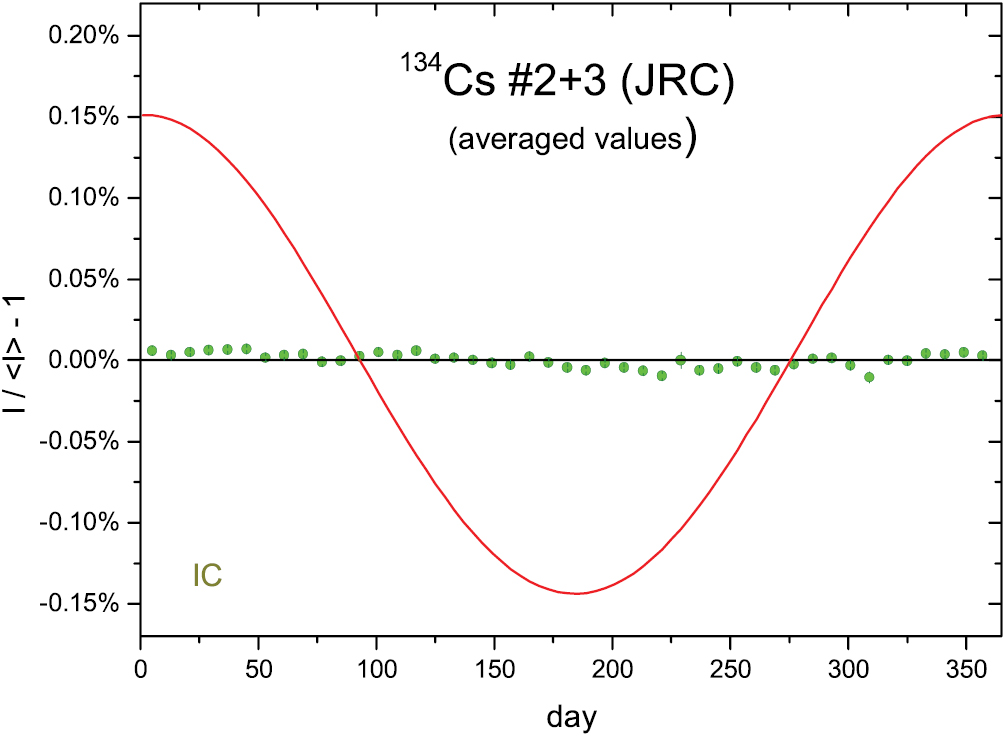
Three 134Cs sources were measured between 2010 and 2016 in the IG12 IC at the JRC, at initial currents of 10.9 pA (#1), 229 pA (#2), and 85 pA (#3). The most stable decay rates were obtained from the latter two, for which the residuals from exponential decay (see figures 32 and 33) are mostly within an extremely narrow margin of 0.02%. The annual averages in figure 34 are conclusive evidence of the invariability of the decay constant for beta decay at the same level of precision as for alpha decay (A = 0.0051 (5)%, a = 48 d).

Figure 32. Residuals from exponential decay for 134Cs activity measurements of source #2 with the IG12 ionisation chamber at JRC. The line represents relative changes in the inverse square of the Earth–Sun distance, normalised to 0.15% amplitude.
Download figure:
Standard image High-resolution image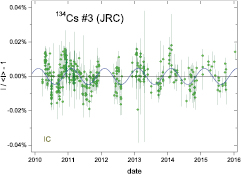
Figure 33. Residuals from exponential decay for 134Cs activity measurements of source #3 with the IG12 IC at JRC. The line represents a sinusoidal function fitted to the (averaged) data.
Download figure:
Standard image High-resolution image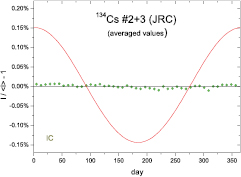
Figure 34. Annual average residuals from exponential decay for 134Cs activity measurements of sources #2 and #3 with the IG12 IC at JRC.
Download figure:
Standard image High-resolution image9. Cesium-137
9.1. Decay characteristics
Cesium-137 (30.05 (8) a) disintegrates by β− emission to the ground state of 137Ba, either directly (5.6%) or via the 661 keV isomeric level (2.55 min) [15]. This nuclide is often used as mono-energetic γ ray calibration source. It is of major concern in environmental measurements after nuclear accidents, due to its high production yield in the fission process.
9.2. 137Cs @IRA
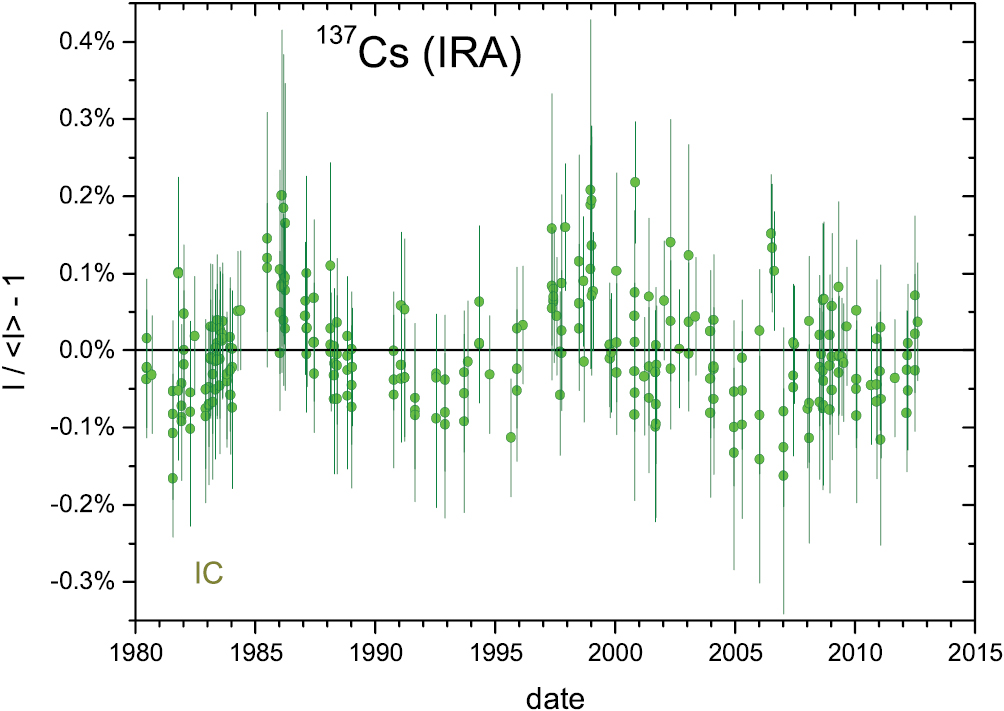
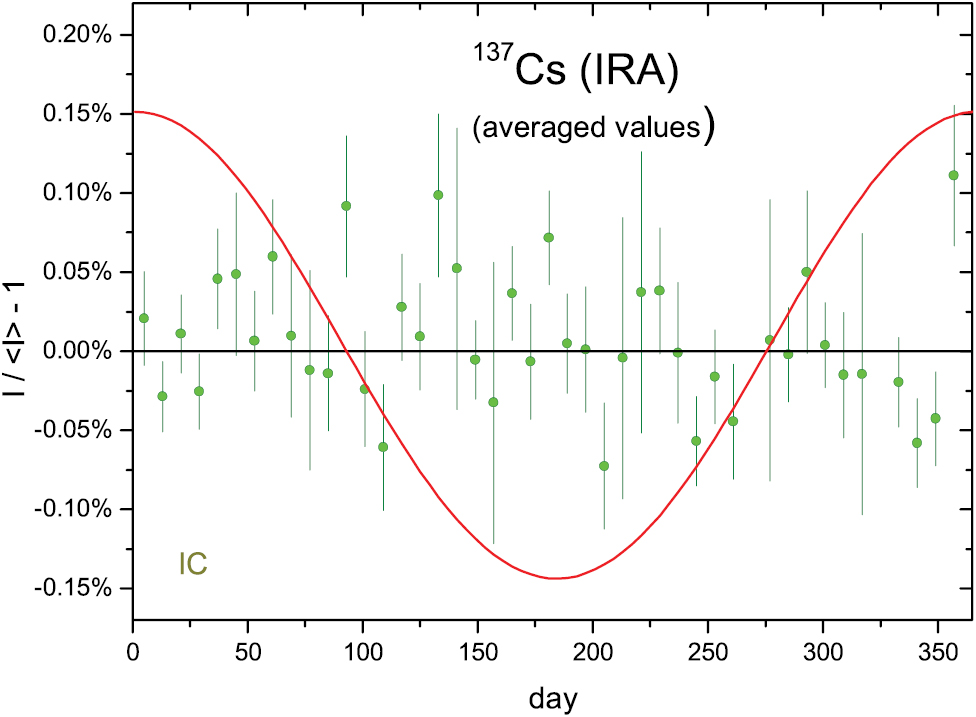
At the IRA (Switzerland), a 137Cs source was measured 281 times in an ionisation chamber between 1980 and 2012 [42] (see figure 35). The IC is a sealed well type 4πγ Centronic IG11, filled with argon at a pressure of 2 MPa. The chamber is surrounded by a 5 cm-thick lead shielding and is located in a temperature-controlled room. The chamber operates at a positive DC voltage of 1000 V and an automated electronic system—based on the principle of the Townsend balance with stepwise compensation—measures the current. A typical measurement cycle corresponds to the time needed to collect the charge produced by the ionisation in the chamber and to load a given capacitor up to 0.1 V. The obtained current is corrected for saturation, background and decay during the measurement. From the average residuals in figure 36, it appears that there are no annual oscillations at permille level (A = 0.018 (9)%, a = 342 d).

Figure 35. Residuals from exponential decay for 137Cs activity measurements with an ionisation chamber at IRA.
Download figure:
Standard image High-resolution image
Figure 36. Annual average residuals from exponential decay for 137Cs activity measurements with an IC at IRA.
Download figure:
Standard image High-resolution image9.3. 137Cs @NRC
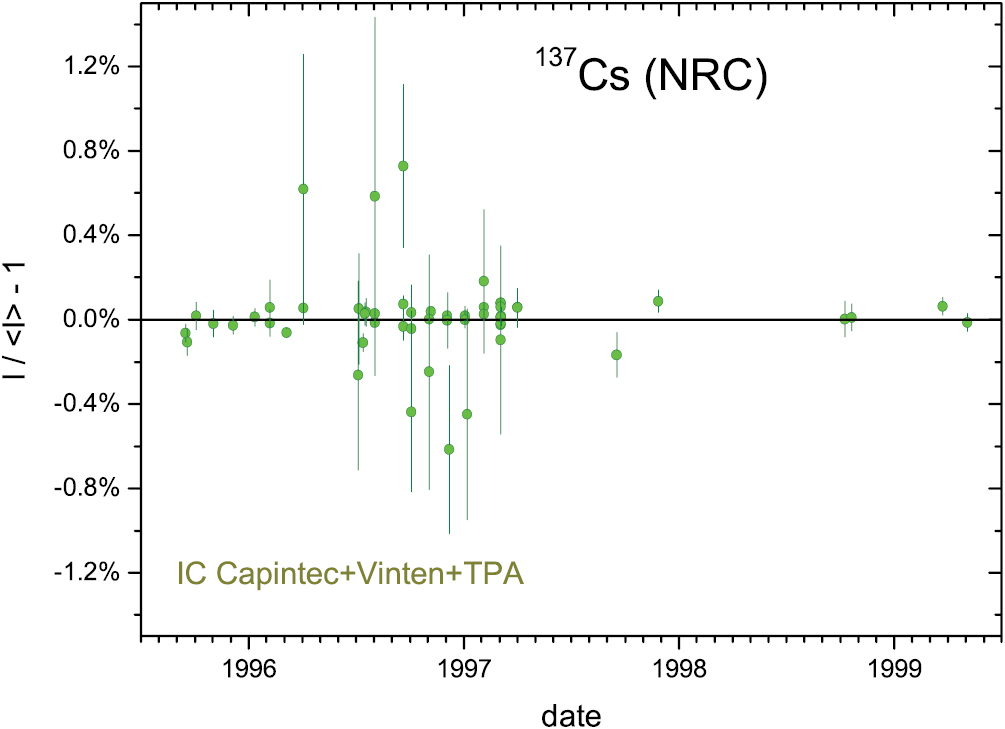
At NRC (Canada) three small data sets were available from 137Cs in three different ICs (Capintec, Vinten and TPA). Decay curves were fitted to each data set, and the residuals are combined in one graph in figure 37. The graph with averages (figure 38) does not cover every period of the year, but supports stability at permille level (A = 0.006 (22)%, a = 147 d).
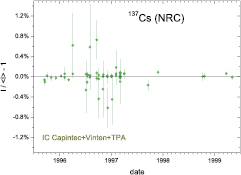
Figure 37. Residuals from exponential decay for 137Cs activity measurements with three ionisation chambers at NRC.
Download figure:
Standard image High-resolution image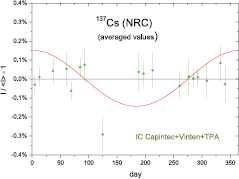
Figure 38. Annual average residuals from exponential decay for 137Cs activity measurements with three ionisation chambers at NRC.
Download figure:
Standard image High-resolution image9.4. 137Cs @PTB
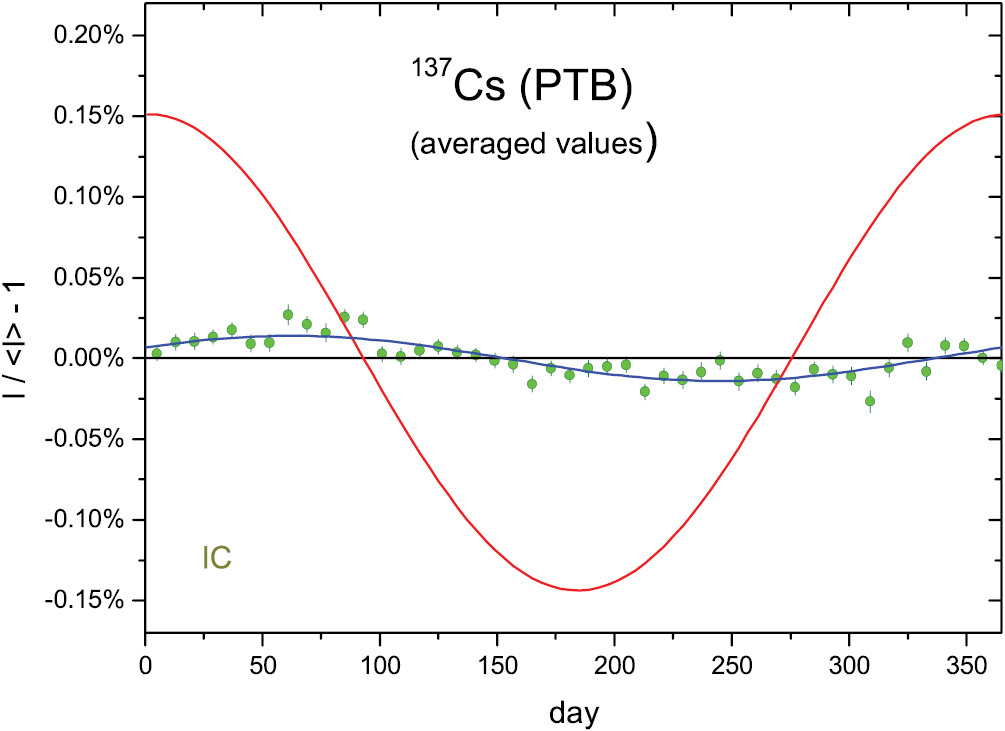
The decay of a 137Cs source was followed from 1997 to 2016 with the PTB IG12/A20 IC, the same instrument as for the 226Ra measurements from 1984 to 1998 in [1], but under more stable conditions due to a commercial electrometer replacing a Townsend balance method since October 1998 [39]. An exponential curve was fitted to the ratio of the 137Cs current with the corresponding current from the 226Ra reference source and the residuals are shown in figure 39. Whereas some auto-correlated effects are still present, they are smaller and less cyclic than in the past [1]. Averaged on a yearly basis (figure 40), the amplitude of the oscillations is down by an order of magnitude (A = 0.014 (1)%, a = 29 d). Just as for 90Sr in section 6.2 (and 54Mn and 152Eu in Part III [2]), it seems no coincidence that the oscillation is of similar magnitude as for the 226Ra reference source measured in the time period 1999–2016 (A = 0.016 (1)%, a = 194 d) [1, 3] and that the phase shift differs by about half a year.

Figure 39. Residuals from exponential decay for 137Cs activity measurements (relative to the 226Ra check source) with the IG12 IC at PTB.
Download figure:
Standard image High-resolution image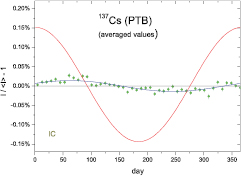
Figure 40. Annual average residuals from exponential decay for 137Cs activity measurements (relative to the 226Ra check source) with the IG12 IC at PTB. One (red) line represents relative changes in the inverse square of the Earth–Sun distance, normalised to 0.15% amplitude, and the other (blue) line a sinusoidal function fitted to the data.
Download figure:
Standard image High-resolution image9.5. 137Cs @NIST
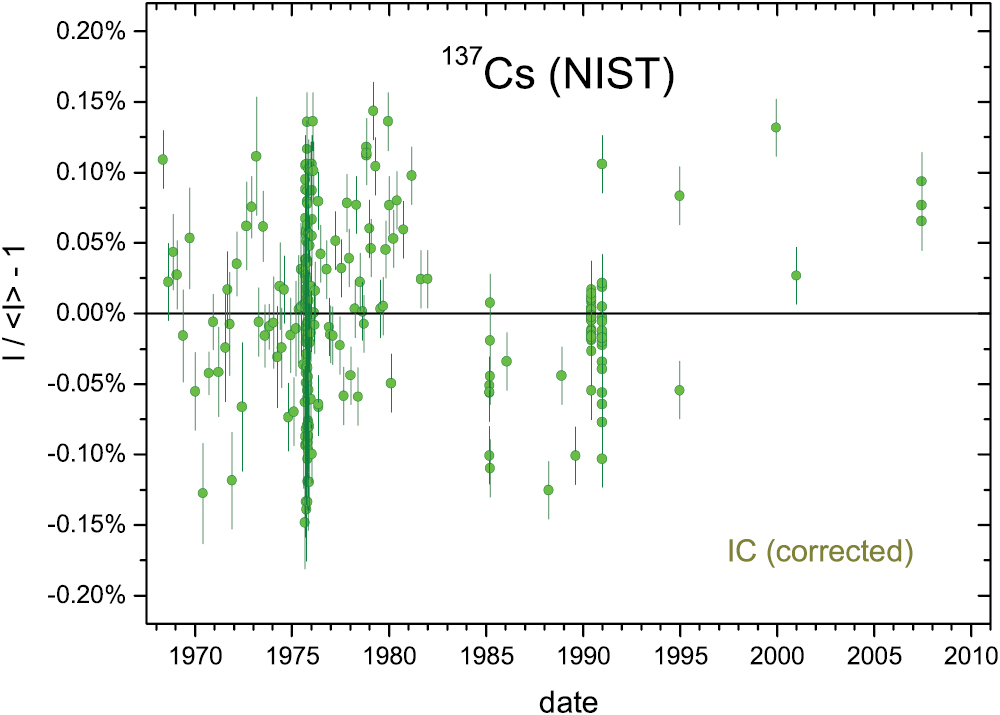
The NIST (USA) has a tradition of long-term activity measurements with the IC 'A' and is a major decay data provider [43, 44]. With time, as the precision of the measured half-life values of intermediately long-lived nuclides such as 85Kr (10.752 (23) a), 133Ba (10.540 (6) a), 137Cs (30.05 (8) a),152Eu (13.522 (16) a) and 154Eu (8.601 (4) a) improved, a mysterious mismatch became apparent between the NIST values and those of others. An example is presented in figure 41, showing a comparison of the NIST 137Cs decay curve between 1973 and 2007 with PTB data (from the original analysis of part of the data in section 9.4). Both decay curves look exponential, but the NIST half-life was significantly longer. If unresolved, such discrepancy would have put the invariability of decay constants into question. The solution to the enigma came with the discovery of a slippage of the positioning ring of the sample holder of the NIST IC, causing slow variation of the detection efficiency [45]. Applying energy-dependent correction factors, the discrepancies for the mentioned nuclides were resolved [44, 46].
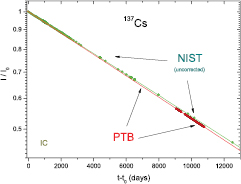
Figure 41. Comparison of the measured decay curves of 137Cs sources with ionisation chambers at the NIST and PTB. A systematic difference occurred through gradual efficiency changes in the NIST IC 'A' due to slippage of the source holder.
Download figure:
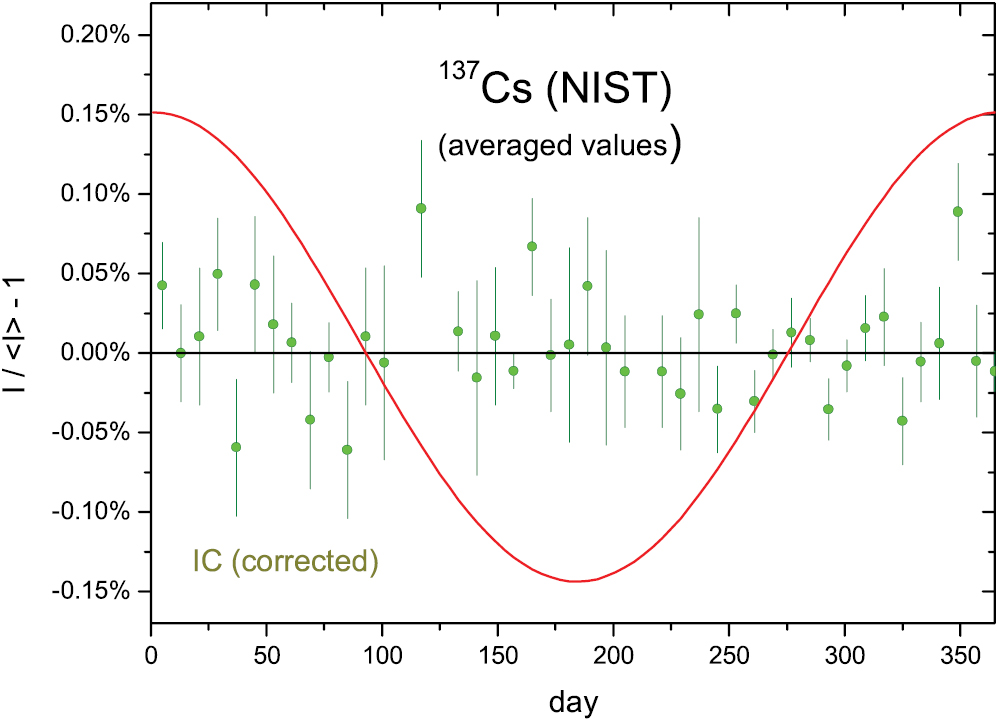
Standard image High-resolution imageIn figure 42, the residuals of the linearly corrected data to an exponential fit are presented. The corrections have adequately compensated for the slope changes, but in the residuals some signs of autocorrelation have remained. For example, one can see that a significant efficiency increase must have occurred between 1977 and 1982. This systematic trend results in increased scatter in the annual averages in figure 43, but even then the data disprove the conjecture of seasonal effects at sub-permille level (A = 0.004 (6)%, a = 33 d). The same conclusion could be drawn from an independent fit to the uncorrected values, which show similar residuals for a different slope.

Figure 42. Residuals from exponential decay for 137Cs activity measurements with IC 'A' at NIST, with linear corrections for the gradual efficiency changes.
Download figure:
Standard image High-resolution image
Figure 43. Annual average residuals from exponential decay for 137Cs activity measurements with IC 'A' at NIST.
Download figure:
Standard image High-resolution image10. Europium-154
10.1. Decay characteristics
Europium-154 (8.601 (4) a) disintegrates by 99.982% by β− decay to excited levels of 154Ga and by 0.018% electron capture via excited levels of 154Sm [15]. Transitions to the ground states of 154Ga and 154Sm have not been observed.
10.2. 154Eu @PTB
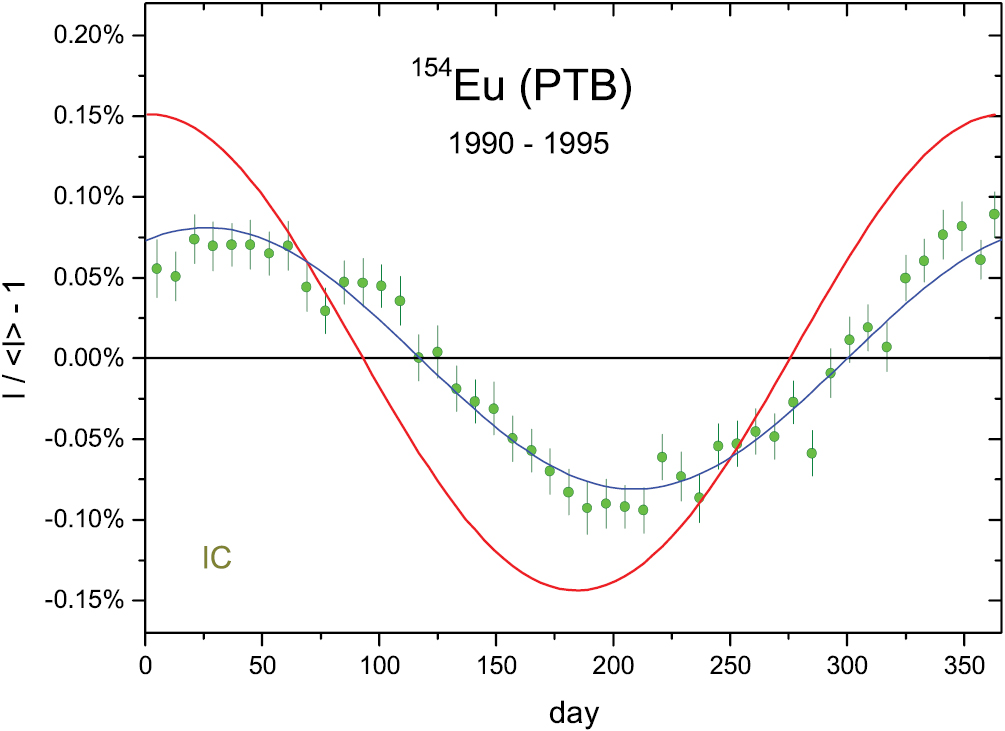
Europium-154 is one of the radionuclides measured in the IG12/A20 IC at the PTB covering periods before and after October 1998, i.e. the date at which the Townsend balance method for the current readout was replaced by a commercial electrometer [31, 38, 39]. Schrader [38] has published raw—i.e. not relative to a reference source—residuals from exponential decay, showing the characteristic 0.1% annual periodicity in the period 1990–1995, and far less modulation in the period 2000–2008. In figures 44 and 45, annual averaged residuals are presented for both periods, after applying linear detrending corrections over 4 time zones in the 2000–2008 data set. The annual modulations (A = 0.081 (3)%, a = 65 d) in the 154Eu data from 1990 to 1995 match those of the 226Ra check source (A = 0.084 (5)%, a = 64 d) in exactly the same period. The more recent (raw but detrended) 154Eu data show a relatively small annual modulation (A = 0.007 (3)%, a = 50 d) compared to the analyses of the 85Kr (section 5.3), 90Sr (section 6.2) and 137Cs (section 9.4) IC data normalised through the 226Ra check source.
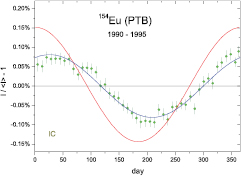
Figure 44. Annual average residuals from exponential decay for 154Eu ionisation current measurements with the IG12 IC at PTB from January 1990 to December 1995. The data were not normalised to a check source.
Download figure:
Standard image High-resolution image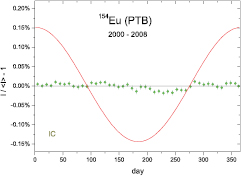
Figure 45. Annual average residuals from exponential decay for 154Eu ionisation current measurements with the IG12 IC at PTB from January 2000 to December 2008. The ionisation currents were detrended, but not normalised to a check source.
Download figure:
Standard image High-resolution image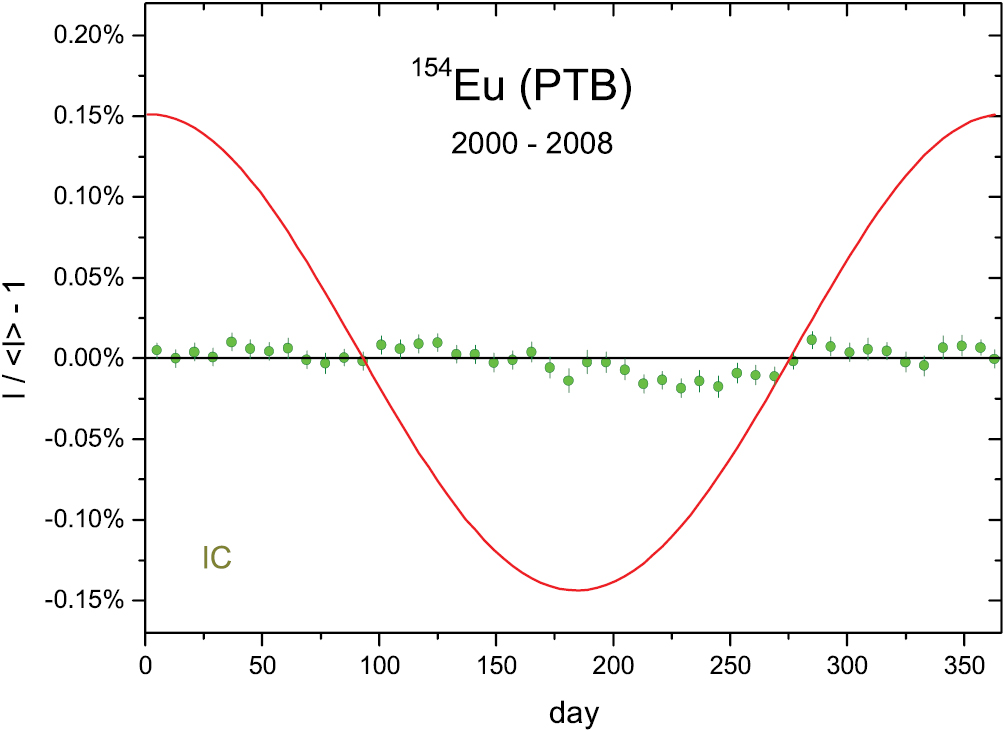
11. Conclusion
A unique collection of long-term decay rate measurements of β− emitting nuclides was obtained from radionuclide metrology laboratories. Excellent measurement stability was achieved with ICs for β− decay accompanied by γ-ray emission of sufficiently high energy. Maintaining a constant gain, stable working conditions and a clear separation of the measurand from interfering signals contributed to the accuracy of the measurements. Primary standardisation methods (LTAC, TDCR) have shown their remarkable repeatability capabilities without need for corrections or rescaling over a long measurement campaign.
Just as for α decay [1, 3] and EC/β + decay [2, 3], no evidence was found of annual oscillations in β− decay in phase with Earth–Sun distance. For the most stable decay rate measurements, the amplitudes of annual sinusoidal modulations are below 0.007% for 60Co, 90Sr, 134,137Cs, 124Sb and 154Eu and below 0.05% for 3H, 14C, and 85Kr. This appears to be an instrumental limitation rather than a physical one. Even though non-random periodical deviations from exponential behaviour do occur in some data sets, they show no mutual coherence in amplitude or phase. Since the deviations differ from one instrument to another, even within the same laboratory, it appears more likely that they originate from local conditions rather than from cosmic influences on the decay rates of radionuclides.
Acknowledgments
The authors thank all past and present colleagues who contributed directly or indirectly to the vast data collection over different periods spanning six decades. They are particularly indebted to Michael Unterweger, Ryan Fitzgerald, Denis Bergeron and Leticia Pibida of the National Institute of Standards and Technology (NIST, USA) for generously providing data sets for various nuclides.
Disclaimer
Certain commercial equipment is identified in this paper to foster understanding. Such identification does not imply recommendation or endorsement by the participating laboratories, nor does it imply that the materials or equipment identified are necessarily the best available for the purpose.