

Abstract
Aiming at the subband division of ultra-wide bandwidth low-frequency (UWL) signal (frequency coverage range: 704–4032 MHz) of the Xinjiang 110 m QiTai radio Telescope (QTT), a scheme of ultra-wide bandwidth signal is designed. First, we analyze the effect of different window functions such as the Hanning window, Hamming window, and Kaiser window on the performance of finite impulse response (FIR) digital filters, and implement a critical sampling polyphase filter bank (CS-PFB) based on the Hamming window FIR digital filter. Second, we generate 3328 MHz simulation data of ultra-wideband pulsar baseband in the frequency range of 704–4032 MHz using the ultra-wide bandwidth pulsar baseband data generation algorithm based on the 400 MHz bandwidth pulsar baseband data obtained from Parkes CASPSR observations. Third, we obtain 26 subbands of 128 MHz based on CS-PFB and the simulation data, and the pulse profile of each subband by coherent dispersion, integration, and folding. Finally, the phase of each subband pulse profile is aligned by non-coherent dedispersion, and to generate a broadband pulse profile, which is basically the same as the pulse profile obtained from the original data using DSPSR. The experimental results show that the scheme for the QTT UWL receiving system is feasible, and the proposed channel algorithm in this paper is effective.
Export citation and abstract BibTeX RIS
Corrections were made to this article on 4 December 2023. Author names were corrected.
1. Introduction
Radio telescopes are used to receive very weak radio signals from the universe, which are processed and analyzed to extract information on the location, velocity, temperature, density, and chemical composition of the emitting objects. They have a wide range of applications in cosmology, astrophysics, and planetary science, and play a crucial role in unraveling the phenomena of dark matter, dark energy, gravitational waves, and cosmic microwave background radiation (Marr et al. 2015).
In order to increase the sensitivity of radio telescopes as much as possible, the bandwidth of the front-end receiving system has been developed to wide bandwidth and ultra-wide bandwidth. For example, the Australian 64 m Parkes radio telescope uses 0.7–4.0 GHz ultra-wide bandwidth receivers (Johnston et al. 2021), the German Effelsberg 100 m radio telescope has ultra-wide bandwidth receivers covering 0.6–3.0 GHz (Lazarus et al. 2016), the U.S. Green Bank Telescope has developed 0.5–3.0 GHz ultra-wide bandwidth receivers for pulsar timing observations (MacMahon et al. 2018) and the ultra-wide bandwidth receiving system of Five-hundred-meter Aperture Spherical radio Telescope in China is equipped with frequency coverage of 500–3300 MHz (Zhang et al. 2023a). Ultra-wide bandwidth can cover a wider frequency range and collect more radio signals, which can effectively improve the sensitivity of the radio telescope receiving system. The broadband nature of the ultra-wide bandwidth receiving system allows for higher frequency resolution and time resolution, and has a wider dynamic range to detect fainter celestial signals and events.
To meet the demand for high-precision radio astronomical observation, the backend digital equipment needs real-time signal processing at a wider bandwidth, with higher time and frequency resolution. An ultra-wide bandwidth receiving system has a strong signal collection capability, with 2 GHz bandwidth, dual polarization, and 16 bit quantization accuracy, for example, 128 Gb of real-time data streams need to be processed per second. Based on the current standard communication equipment and related technologies, a single channel cannot achieve real-time data transmission and processing. As a key technology for processing wideband signals, channelization techniques use parallel ideas to decompose wide bandwidth signals into multiple mutually adjacent subbands and segment the output subband signals. Channelization-related technology can effectively reduce backend system pressure and improve signal processing efficiency (Morrison et al. 2020).
The implementation of digital channelization technology is theoretically based on filtering algorithms, and traditional channelization methods are based on discrete Fourier transform (DFT) filters, which are usually implemented using fast Fourier transform (FFT) algorithms. However, DFTs are prone to spectrum leakage and cannot achieve high-precision channelization (Ghandour et al. 2020). Polyphase filter bank (PFB) channelization technology has become the mainstream technology to achieve channelization because of its flexibility and suitability for efficient implementation on a field-programmable gate array (FPGA) hardware platform. In recent years, with the development and use of ultra-wide bandwidth receiving systems, PFB-based channelization technology has become a research hotspot in the field.
The Parkes ultra-wide bandwidth low-frequency (UWL) project team divided the 704–4032 MHz ultra-wide bandwidth signal into three radio frequency (RF) bandwidths, which were further divided into 26 contiguous subbands with a 128 MHz bandwidth based on an FPGA. The preprocessing stage used a critical sampling polyphase filter bank (CS-PFB) to divide the subbands, and to eliminate the subband edge aliasing generated by CS-PFB. A 5 MHz bandwidth was removed from each subband boundary. Parkes UWL planned to use an oversampled polyphase filter bank (OS-PFB) in the future to solve the problem of inter-subband aliasing generated by CS-PFB channelization, and the related technology is being studied but not yet realized at this stage (Hobbs et al. 2020). Burnett et al. (2020) presented the design ideas and initial progress in the development of the Arecibo radio telescope digital backend system, which was planned to use 18 ZCU111 boards to digitize and channelize the signal. They relied on 2048-point oversampling PFBs to achieve subband division and eliminate spectral leakage, and no further progress was found in related work. A two-stage PFB was designed in the Australian Square Kilometre Array Pathfinder digital backend, where signals with a bandwidth of 384 MHz were obtained from 188 PAF receivers and processed by a two-stage filter bank, with the first stage being an OS-PFB with a sampling rate of 32/27 and the second stage using a CS-PFB (Tuthill et al. 2015). The Australian Murchison Widefield Array interferometric array telescope observes the 80–300 MHz bandwidth with two stages of channelization, both using a CS-PFB, and resolves the aliasing caused by critical sampling by removing some of the bands (Ord et al. 2015).
The Qitai Radio Telescope (QTT) will adopt the world's cutting-edge technology, oriented to major scientific problems such as gravitational wave detection, the molecular origin of life in the universe, dark matter and black hole research, to build a world-class observation platform for breakthroughs in the frontier field of radio astronomy, while meeting the needs of major national strategic tasks, and will become an important support platform for China's national defense and space exploration (Wang et al. 2023).
The realization of QTT multi-science objectives requires continuous breakthroughs in ultra-wide bandwidth reception technology and multi-functional digital backend technology, and requires continuous exploration of technological frontiers based on the actual needs of QTT and the future development direction of backend data processing. Among them, the QTT UWL receiving system is planned to cover the frequency band of 704–4032 MHz, and the planned ADC sampling accuracy is 12 bit with dual polarization sampling. Like others, the QTT UWL receiving system will also face great challenges, including the problem of radio frequency interference, the problem of real-time transmission and processing of massive signals generated by ultra-wide bandwidth, etc.
In this paper, we analyze the ultra-wide bandwidth scheme of the QTT UWL receiving system, and plan to divide the ultra-wide bandwidth signal into three consecutive analog bands. Using the channelization algorithm designed and implemented in this paper, the three analog bands are further divided into 26 narrow bands of 128 MHz.
2. QTT UWL Digital Backend Sampling and Frequency-banding Scheme
The QTT UWL digital backend system data transmission process is diagrammed in Figure 1. The ultra-wide bandwidth receiver and reference antenna observation data stream are divided into three segments for transmission, and the three segments of the bandwidth range of 704–1344, 1344–2368, and 2368–4032 MHz RF analog signals are sent to three RFSoC boards to achieve sampling and data preprocessing. After channelization, the data are transmitted via 100 Gb Ethernet to the GPU cluster for parallel processing, and the preprocessed astronomical signals are finally stored in the disk array.
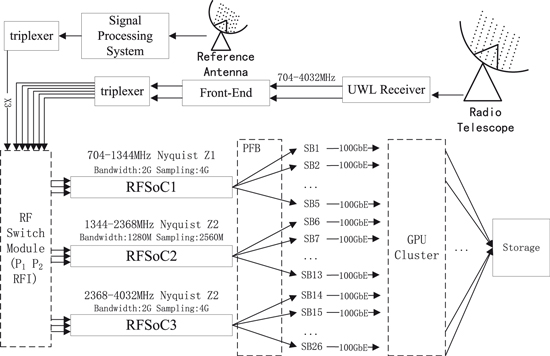
Figure 1. QTT UWL receiving system digital terminal data transmission process.
Download figure:
Standard image High-resolution imageThe channel division of the QTT UWL receiving system is illustrated in Figure 2, referring to the channelization design of the Parkes UWL receiving system for the first part of the bandwidth of 704–1344 MHz RF analog signal. It was planned to use a 4096 MHz sampling frequency to achieve sampling in the first Nyquist zone, employ the channelization algorithm to process the signal, and retain the five bandwidths of 128 MHz subbands (SB1-SB5) in the frequency range 704–1344 MHz. The output band is drawn on the left side of Figure 2 in red.
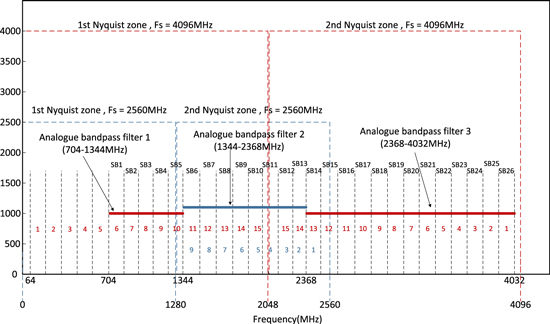
Figure 2. QTT UWL channelization.
Download figure:
Standard image High-resolution imageFor the second bandwidth of the 1280–2560 MHz RF analog signal, we planned to use the 2560 MHz sampling frequency to achieve sampling in the second Nyquist zone, and retain eight subbands (SB6-SB13) of 128 MHz bandwidth in the data frequency range 1344–2368 MHz. The output band is displayed in the middle blue horizontal line part of Figure 2. The spectral information obtained in the second Nyquist zone is opposite to that of the first Nyquist zone, so the subbands are marked in reverse order.
For the third channel bandwidth of the 2048–4032 MHz RF analog signal, it is planned to use the 4096 MHz sampling frequency to achieve sampling in the second Nyquist zone, and use the channelization algorithm to process the signal in the second Nyquist zone. We retained 13 bandwidth 128 MHz subbands (SB14-SB26) in the frequency range 2368–4032 MHz. The output band is shown with the red horizontal line part on the right side of Figure 2, because the spectral information obtained in the second Nyquist zone is opposite to that of the first Nyquist zone, and the spectrum is marked in reverse order.
The final output of each subband after PFB processing at both sampling rates was complex data with a bandwidth of 128 MHz.
3. Design and Implementation of CS-PFB
3.1. Prototype Low-pass FIR Filter Design Based on Window Function
Finite impulse response (FIR) digital filters are filters with a finite length of unit impulse response h(n), which is a stable system. The expression of the N-tap FIR filter is written in Equation (1), and the system output y(n) can be expressed as a linear convolution of the input sequence x(n) with the unit impulse response h(n) in the time domain, multiplied in the frequency domain

The FIR digital filter consists of a digital multiplier, an adder, and a delay unit, which are essentially a combination of delayed and weighted operations on a string of input signals. It delays the signal step by step and accumulates the weighted output of each level of delay to obtain the filtered output. As diagrammed in Figure 3, x(n) is the input signal, h(n) is the FIR filter coefficient, y(n) is the filtered signal, N denotes the number of taps of the FIR filter and the order of the filter is N − 1.
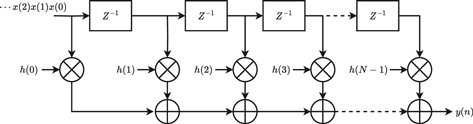
Figure 3. FIR filter structure.
Download figure:
Standard image High-resolution imageFIR requires N multiplications and N − 1 additions for each filtering operation, and when the order is large, the delay is too high for high-speed signal processing.
Commonly applied window functions are the Rectangle window, Bartlett window, Hamming window, Hanning window, Blackman window, and Kaiser window (Kumar et al. 2014). When using the window function method to design the FIR filter, its performance depends on the filter order and window function type. With the same order, an FIR low-pass filter with a cutoff frequency of 100 Hz and a sampling frequency of 800 Hz is designed with a filter length of 64, and a comparison of the performance of different window function filters is depicted in Figure 4.
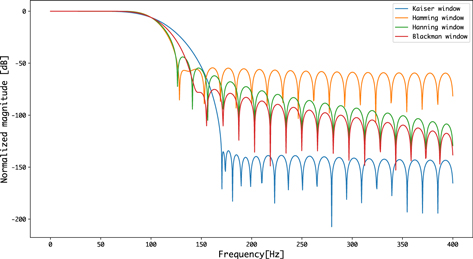
Figure 4. Low-pass filter with different window functions.
Download figure:
Standard image High-resolution imageThe Blackman window in Figure 4 has the largest first parametric attenuation, followed by the Hamming window, which has a steeper transition band, for the same filter order. Considering the characteristics of various window functions, the Hamming window method is chosen to design the FIR digital filter as the prototype low-pass filter.
3.2. Design of CS-PFB
The structure of the PFB is illustrated in Figure 5, which decomposes the input sequence and prototype filter coefficients into multiple "phases" or "branches" to provide an efficient filter implementation.
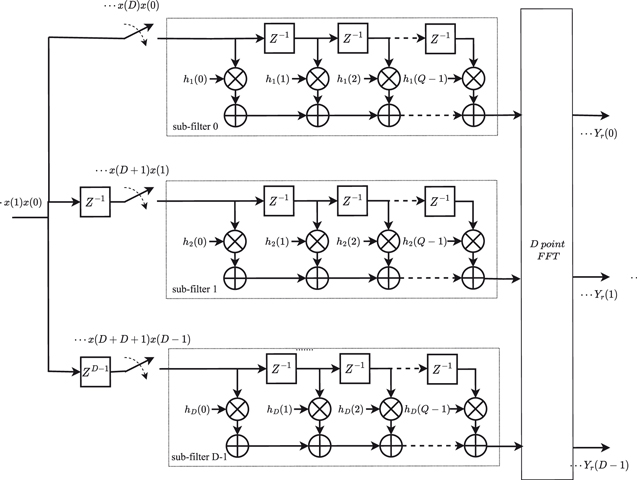
Figure 5. CS-PFB structure.
Download figure:
Standard image High-resolution imageThe PFB algorithm requires fewer multiplication and addition calculations per unit time than conventional implementations. For N order filters, M level polyphase implementations require (N + 1)/M multiplications and N/M additions per unit time, and the input data can be processed in parallel at a much lower sampling rate.
For the polyphase decomposition of the original input sequence, the input data x(m) can be extracted by D to generate the D grouped samples xD(m), and the data from each branch after grouping are passed through each filter for convolution operation separately. Figure 6 visualizes the polyphase decomposition of D = 3, which decomposes the input signal (a) into (b), (c) and (d).
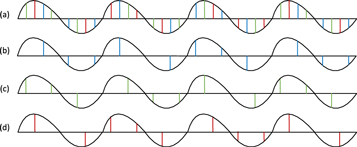
Figure 6. Polyphase decomposition of the input data.
Download figure:
Standard image High-resolution imageWe design the prototype low-pass FIR filter hLP(n) with the transfer function  . The FIR filter hLP(n) has length N and each sub-filter has length Q. Let N/D = Q such that Q takes an integer, and if it cannot be integrable, the filter coefficients are complemented by zeros. Figure 7 illustrates how the 15 coefficients of the prototype filter are polyphase decomposed into three branches, with each branch consisting of five FIR filter coefficients.
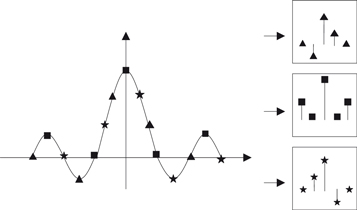
Figure 7. Polyphase decomposition of the prototype filter coefficients.
Download figure:
Standard image High-resolution imageAfter the polyphase decomposition is completed, the filter coefficients and input data are rearranged, which are manifested by flipping the input data matrix and the filter coefficient matrix up and down. After that, the convolution operation is performed on the rearranged data and coefficients of each sub-channel, and the FFT or inverse FFT (IFFT) is executed on the result after each convolution to obtain the channelized subband data. If the input data are D point real numbers, the output is D/2 valid points due to the FFT or IFFT conjugate symmetry property, which means that D/2 valid channels are output; if the input data are D point complex numbers, D valid channels are output.
4. UBPB Algorithm
To verify the feasibility of the signal scheme for the QTT UWL receiving system, we design the ultra-wide bandwidth pulsar baseband data generation (UBPB) algorithm to simulate the generation of UBPB data. The basic idea of the algorithm is to use the existing pulsar-wide bandwidth baseband data to generate the UBPB data by changing the sampling rate, adding dispersion, and other operations. The specific process is diagrammed in Figure 8. The pulsar baseband data are processed in blocks to improve the processing efficiency, and the time domain data are converted to the frequency domain by FFT to perform coherent dedispersion (Zhang et al. 2023b) using information such as center frequency, bandwidth, and dispersion measure (DM). After that, the center frequency, bandwidth, and DM of the newly generated UBPB data are set and the dispersion is added to the dispersive data (the inverse of coherent dispersion), which are converted to the time domain by IFFT and finally stored as baseband data.
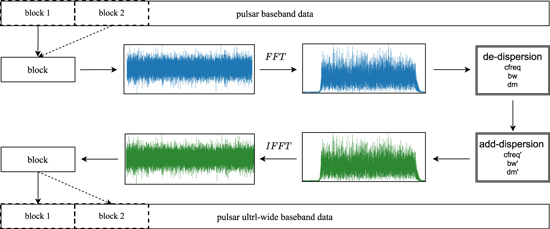
Figure 8. UBPB algorithm process.
Download figure:
Standard image High-resolution imageWhen the UBPB data are generated, we need to impose certain constraints on the block size and parameters during the generation of UBPB data. We assume that the bandwidth of the existing pulsar-wide-width baseband data is B, the frequency range is fl
to fh
, the dispersion is DM, the observation time is t seconds and the block size is K per processing. The bandwidth of the generated ultra-broadband pulsar baseband data is  , the frequency range is
  to
to  , the dispersion is
  and the observation time is
  seconds, then the constraints are as in Equation (2)

For the pulsar baseband data, the sampling rate fs
= 2 × B,  , Δt and
  are the dispersion delays of the highest and lowest frequencies in the pulsar baseband data and the generated UBPB data, respectively, as displayed in Figure 9 and calculated as expressed in Equation (3)

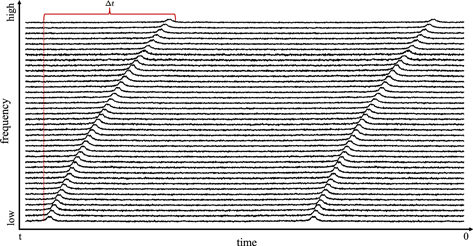
Figure 9. Pulsar subband dispersion delay.
Download figure:
Standard image High-resolution imageAccording to the above description, the constraint expresses the meaning that the block size of each processing and the generated UBPB data must contain the complete full bandwidth pulse information and be less than or equal to the length of the baseband data.
5. Experimental Analysis of Channelization
5.1. Simulation of Ultra-wide Bandwidth Pulsar Baseband Data
We apply the UBPB algorithm proposed in Section 4 to the original baseband pulsar data with a bandwidth size of 400 MHz, center frequency of 1382 MHz, and DM of 2.64476 cm−3 pc. The simulation generates UBPB data with a bandwidth of 3328 MHz, center frequency of 2368 MHz, and DM of 2.64476 cm−3 pc as experimental data. A comparison of the basic information of the original baseband data and the generated UBPB data is shown in Table 1. Since the number of pulses contained in the same data length is equivalent, the folding period P2 of the generated UBPB data is calculated as expressed in Equation (4), where P1 is 0.00575730363767324 s, and P2 can be derived as 0.0006919836102972644 s. The 400 MHz dual polarization baseband data spectrum is displayed in Figure 10(a), and its bandpass frequency range is 1182–1582 MHz. The phase spectrum is obtained using DSPSR/PSRCHIVE (Hotan et al. 2004; van Straten et al. 2012) as depicted in Figure 11(a), and the collapsed pulse profile is shown in Figure 11(b). After performing the dedispersion, the phase spectrum is presented in Figure 12(a), and the collapsed pulse profile is displayed in Figure 12(b)

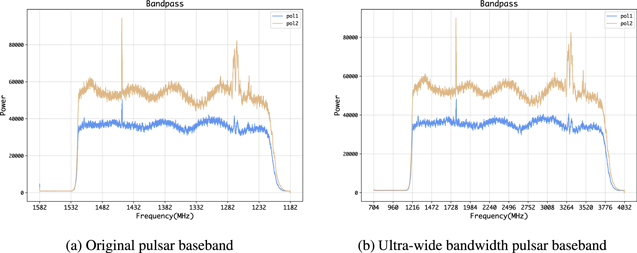
Figure 10. Dual polarization baseband data spectrum.
Download figure:
Standard image High-resolution image
Figure 11. 400 MHz wideband baseband data.
Download figure:
Standard image High-resolution image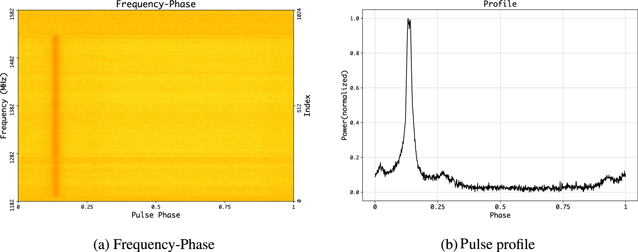
Figure 12. 400 MHz wideband baseband data (dedispersion).
Download figure:
Standard image High-resolution imageTable 1. Raw Data and Simulation Data Information
| Parameters | J0437-4715 | Pulsar-test |
|---|---|---|
| cfreq (MHz) | 1382 | 2368 |
| bandwidth (MHz) | 400 | 3328 |
| nbit | 8 | 8 |
| npol | 2 | 2 |
| folding period (s) | 0.00575730363767324 | 0.0006919836102972644 |
| DM (cm−3 pc) | 2.64476 | 2.64476 |
| tsamp (ms) | 0.00125 | 0.00015024038461538462 |
Download table as: ASCIITypeset image
The 3328 MHz dual polarization simulation data spectrum is shown in Figure 10(b), and its bandpass frequency range is 704–4032 MHz. The phase spectrum is obtained using DSPSR/PSRCHIVE as depicted in Figure 13(a), and the pulse profile is obtained by folding as displayed in Figure 13(b). To realize coherent dispersion, the phase spectrum is obtained using DSPSR as presented in Figure 14(a), and the pulse profile is obtained by folding as shown in Figure 14(b). These simulation data can get the dual polarization spectrum information and the pulse contour can be obtained by folding.
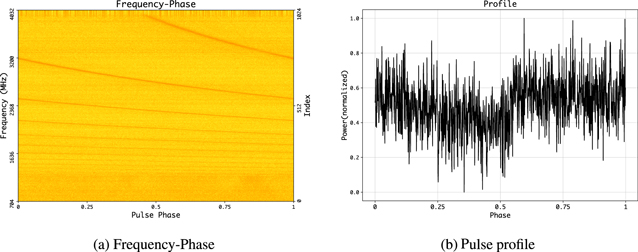
Figure 13. 3328 MHz ultra-wide bandwidth baseband data.
Download figure:
Standard image High-resolution image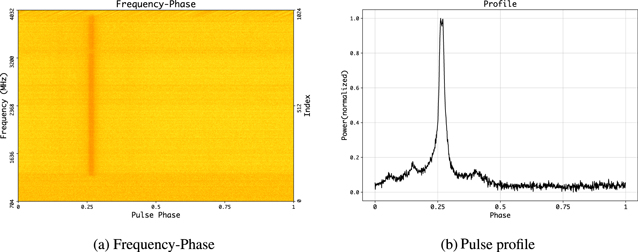
Figure 14. 3328 MHz ultra-wide bandwidth baseband data (dedispersion).
Download figure:
Standard image High-resolution image5.2. Ultra-wide Bandwidth Data Channelization
The CS-PFB is used to channelize the ultra-wide bandwidth data generated by the simulation, and a total of 26 subbands are divided. The number of coefficients of each sub-filter is set to 64, and two different channelization structures are set according to two different sampling rates. A scheme with 16 output subbands and 1024 coefficients (scheme 1) and another scheme with 10 output subbands and 640 coefficients (scheme 2) are set.
The first band range is 0–2048 MHz, and scheme 1 can be used to retain five subbands in the bandwidth range 704–1344 MHz. The second band range is 1280–2560 MHz, and scheme 2 can be used to reserve eight subbands in the bandwidth range 1344–2368 MHz. The third band range is 2048–4096 MHz, and scheme 1 can be used to reserve 13 subbands in the bandwidth range of 2368–4032 MHz.
The pulse profiles are obtained by folding each subband. The pulse profiles of the five subbands in the frequency range 704–1344 MHz are shown in Figure 15, where the 1st, 2nd, and 3rd subbands have noisy signals and no pulse profile. The pulse profiles of the eight subbands in the frequency range 1344–2368 MHz are displayed in Figure 16. The 13 subband pulse contours for the frequency range 2368–4032 MHz are presented in Figure 17.
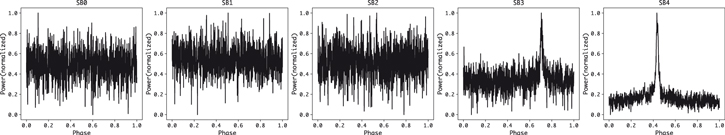
Figure 15. The five subbands with a bandwidth of 704–1344 MHz.
Download figure:
Standard image High-resolution image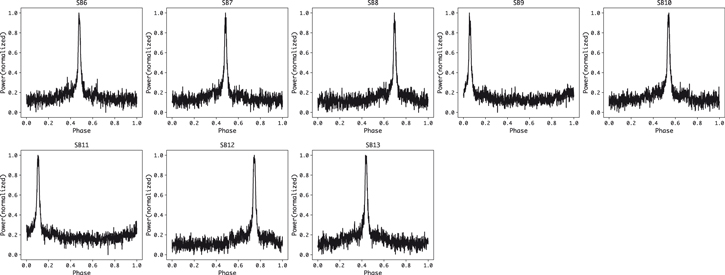
Figure 16. The eight subbands with a bandwidth of 1344–2368 MHz.
Download figure:
Standard image High-resolution image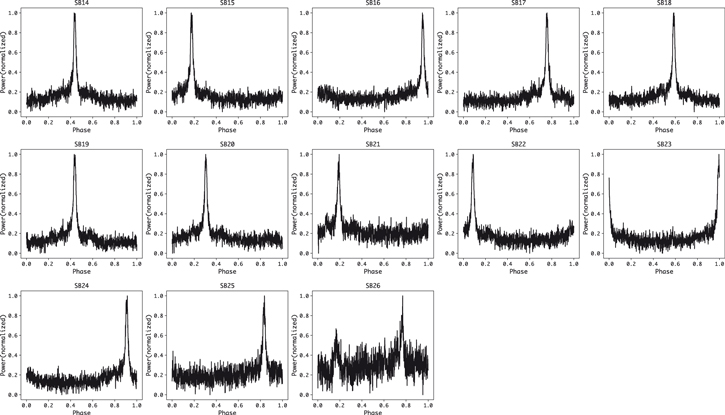
Figure 17. The thirteen subbands with a bandwidth of 2368–4032 MHz.
Download figure:
Standard image High-resolution imageThe frequency-phase diagram of the 26 subbands after channelization is shown in Figure 18(a), whose horizontal coordinates indicate the phase and vertical coordinates are the number of channels and frequency. There is a phase delay in each subband, and the time delay can be calculated by non-coherent dedispersion to achieve pulse alignment in each subband. The difference in pulse arrival time Δt between the ith channel with center frequency fi and the channel where the reference frequency fref (usually the center frequency of the entire passband is chosen) is denoted as (5)

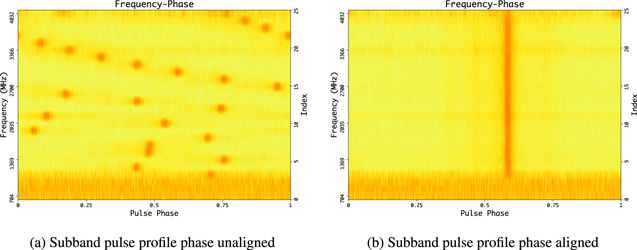
Figure 18. The phase spectrum of 26 subbands after channelization.
Download figure:
Standard image High-resolution imageThe number of time delay points that each subband pulse signal should move is calculated from the time difference Δt in Equation (5), which can be expressed as (6)

where pfold is the number of pulse periods and nbin is the number of points in each subband after folding. After phase alignment, the frequency-phase diagram of the 26 subbands is obtained as illustrated in Figure 18(b).
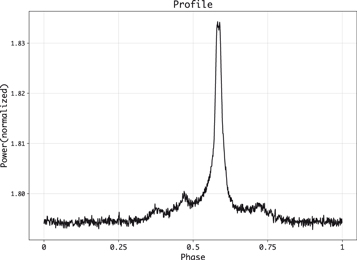
The subbands are reorganized to form an ultra-wide bandwidth, and the pulse profile is folded as demonstrated in Figure 19 and compared with Figure 14(a), and 100 sampling points are taken at on-pulse and off-pulse. The standard deviation is calculated after subtraction, and the std = 0.02094 at on-pulse and std = 0.01191 at off-pulse are obtained. The distributions at on-pulse and off-pulse are consistent, and the two contours are basically the same, which affirms the correctness of this channelization method.
Figure 19. The ultra-wide bandwidth pulse profile after channelization and composition.
Download figure:
Standard image High-resolution image
6. Conclusion
Referring to the Parkes ultra-wide bandwidth signal receiving and preprocessing scheme, this paper proposes a signal scheme for the QTT UWL receiving system. The FIR digital filter is designed as a prototype low-pass filter based on the Hamming window, which is polyphase decomposed to form each sub-filter with 64 coefficients to form the CS-PFB through the frequency domain dissipation plus dispersion process. Based on the 400 MHz pulsar baseband data obtained from the Parkes CASPSR backend observation, the 3328 MHz pulsar ultra-wide bandwidth signal is generated by simulation using the UBPB algorithm. Based on the CS-PFB designed and implemented in this paper, the 3328 MHz ultra-wide bandwidth signal generated by the simulation is divided into 26 subbands of 128 MHz, and the pulse profile of each subband is obtained by coherent dedispersion, integration, and folding. The pulse profile after subband reorganization is further obtained by aligning the phase of each subband using incoherent dedispersion, and its comparison with the pulse profile obtained from the original ultra-wide bandwidth data using DSPSR shows that the phase and amplitude are basically the same and the distribution is consistent. In this paper, the feasibility of the QTT UWL signal scheme and the effectiveness of the channelization algorithm are experimentally verified, and the designed and implemented channelization algorithm can be applied to QTT UWL signal channelization in real-time in the future.
Acknowledgments
This work is supported by the National Key R&D Program of China (Nos. 2021YFC2203502 and 2022YFF0711502), the National Natural Science Foundation of China (NSFC, Grant Nos. 12173077 and 12003062); the Tianshan Innovation Team Plan of Xinjiang Uygur Autonomous Region (2022D14020); the Tianshan Talent Project of Xinjiang Uygur Autonomous Region (2022TSYCCX0095); the Scientific Instrument Developing Project of the Chinese Academy of Sciences, grant No. PTYQ2022YZZD01; China National Astronomical Data Center (NADC); the Operation, Maintenance and Upgrading Fund for Astronomical Telescopes and Facility Instruments, budgeted from the Ministry of Finance of China (MOF) and administrated by the Chinese Academy of Sciences (CAS); Natural Science Foundation of Xinjiang Uygur Autonomous Region (2022D01A360).