

Abstract
The James Webb Space Telescope (JWST) is NASA's flagship mission successor to the highly successful Hubble Space Telescope. It is an infrared observatory featuring a cryogenic 6.6 m aperture, deployable Optical Telescope Element (OTE) with a payload of four science instruments (SIs) assembled into an Integrated Science Instrument Module (ISIM) that provide imagery and spectroscopy in the near-infrared band between 0.6 and 5 μm and in the mid-infrared band between 5 and 28.1 μm. JWST was successfully launched on 2021 December 25 aboard an Ariane 5 launch vehicle. All 50 major deployments were successfully completed on 2022 January 8. The observatory performed all midcourse correction maneuvers and achieved its operational mission orbit around the Sun–Earth second Lagrange point (L2). All commissioning and calibration activities have been completed, and JWST has begun its science mission. This paper will provide a description of the driving requirements and their technical challenges, the engineering processes involved in the design formulation, the resulting observatory design, the verification programs that proved it to be flightworthy, and the measured on-orbit performance of the observatory. Since companion papers will describe the details of the OTE and SIs, this paper will concentrate on describing the key features of the observatory architecture that accommodates these elements, particularly those features and capabilities associated with accommodating the radiometric and image-quality performance.
Export citation and abstract BibTeX RIS

Original content from this work may be used under the terms of the Creative Commons Attribution 3.0 licence. Any further distribution of this work must maintain attribution to the author(s) and the title of the work, journal citation and DOI.
1. Introduction
The James Webb Space Telescope (JWST) Mission was conceived in the mid-1990s as a successor to the highly successful Hubble Space Telescope to investigate the early universe with a goal to detect "first-light objects," to study the evolution of galaxies from this period to the present day, and to study the star birth and the evolution of solar systems in our own galaxy. Later, since the system design was assessed to be capable without change, these four science objectives were expanded to include investigations of some of the roughly 5000 known exoplanets.
These science objectives required a 6 m class infrared Optical Telescope Element (OTE) and science instrument (SI) payload, cooled to cryogenic temperatures of 55 K or less. The science mission calls for imagery and spectroscopy in the near-infrared (NIR) band from 0.6 to 5 μm, and in the mid-infrared (MIR) band from 5 to 28 μm. Four SIs were selected; the Near Infrared Camera (NIRCam) from the University of Arizona, the Near Infrared Spectrometer (NIRSpec) from the European Space Agency (ESA), the Mid Infrared Instrument (MIRI) from the European Consortium (EC) and the Jet Propulsion Laboratory (JPL), and the Fine Guidance Sensor (FGS)/Near Infrared Imaging Slitless Spectrometer (NIRISS) from the Canadian Space Agency (CSA). The OTE and Spacecraft Element (SCE) provides the traditional subsystems; Command and Data Handling (C&DH), Electrical Power Subsystem (EPS), Telecommunication Subsystem (Telecom), Attitude Control Subsystem (ACS), Propulsion Subsystem, Thermal Control Subsystem (TCS) was provided by Northrop Grumman, and their primary subcontractor Ball Aerospace.
The JWST observatory was designed to operate at the Earth–Sun second Lagrange (L2) point for a minimum science mission life of 5 yr. An Ariane 5 Launch Vehicle was selected to launch the observatory and insert into a direct inject trajectory to a 180 day period around the L2 point. Since the deployed configuration of the observatory far exceeds the volume of the Ariane 5 fairing as well as any other currently available launcher fairing, the observatory is folded for launch and undergoes a complex series of deployments on its way out to the L2 point.
Science and mission operations are conducted from the Space Telescope Science Institute (STScI). Low-data-rate S-band command and telemetry and high-data-rate Ka-band science communications with the observatory are provided by the NASA Deep Space Network (DSN).
An overview of the Mission System Architecture is illustrated in Figure 1.

Figure 1. The JWST mission system architecture.
Download figure:
Standard image High-resolution imageThis paper is organized to describe some of the unique aspects of this first and only of its kind observatory. Section 2 will describe the driving mission and observatory requirements and the challenges they presented. Section 3 will describe the aspects of the systems engineering process that were employed to meet these challenges, in particular the trade study methods and Integrated Modeling (IM). Section 4 will describe the resulting observatory design. Section 5 will describe the verification program, and Section 6 will present a summary of the measured on-orbit performance of the observatory capability to support the science mission. A more detailed presentation of the science performance is presented by companion papers (McElwain et al. 2023; Rigby et al. 2023a), so this paper will concentrate on the observatory's ability to provide the necessary thermal and stability environments to support the radiometric and image quality performance.
2. Driving Requirements and Technical Challenges
The JWST mission and engineering requirements are structured in a hierarchical framework to document the allocation of derived lower-level "children" requirements to the various system segments (Ground Segment, Launch Segment, Observatory Segment) and then to the elements, which, for the Observatory Segment, consist of the OTE, SCE, and Integrated Science Instrument Modules (ISIM), which includes the four SIs. This hierarchical structure also serves to trace the "bottoms-up" path for the process of requirements verification.
Mission-level requirements are documented in the JWST Program/Project Plan (JWST-PLAN-000633). These are the most fundamental requirements used to establish overall mission success. Table 1 lists the driving Level 1 requirements.
Table 1. Driving Level 1 Requirements
| Reqt # | Requirement |
|---|---|
| L1-1 | Measure space density of galaxies to 2 μm flux density of 10−34 W m−2 Hz−1 |
| L1-2 | Measure spectra of at least 2500 galaxies with R between 100 and 1000 to a 2 μm line flux density of 5.2 × 10⁻²² W m−2 |
| L1-3 | Measure physical and chemical properties of young stellar objects, circumstellar disks, extrasolar planets, and solar system objects |
| L1-21 | Data Volume: JWST shall deliver and process 229 Gbits per contact |
| L1-10 | Data Availability: JWST shall deliver 95% of all Real Time (RT) and Stored Data |
| L1-8 | Observing Time: 5 × 10⁷ s for 5 yr |
| L1-9 | Mission Life: 5 yr |
| L1-12 | Orbit: L2 orbit |
Download table as: ASCIITypeset image
Level 1 requirements are flowed down to Level 2 requirements, documented in the JWST Mission Requirements Document (JWST-RQMT-000634) that governs the design of the JWST segments including the observatory. Table 2 lists the subset of these requirements that drive the observatory design from a science performance perspective. These include spectral bandwidth, radiometric sensitivity, optical throughput, stray light, image quality and image quality stability, and observatory field of regard (FOR), all necessary to achieve the science objectives for this mission.
Table 2. Level 2 Requirements Driving the Observatory Design
| Reqt # | Requirement |
|---|---|
| MR-51 | Wavelength Coverage: The observatory spectral coverage shall extend from 0.6 to 27 μm. |
| Sensitivity: The observatory shall achieve the following signal-to-noise ratios (S/Ns) for the following source with a spectral resolution of R: | |
| λ = 1.15 μm (NIRCam): 1.10 × 10⁻³¹ W m−2 Hz−1 S/N = 10 in 104 s or less at R = 4 | |
| λ = 2 μm (NIRCam): 6.25 × 10⁻²¹ W m−2 Hz−1 S/N = 10 in 104 s or less at R = 4 | |
| λ = 1.4 μm (NIRISS): 1.26 × 10⁻³³ W m−2 Hz−1 S/N = 10 in 104 s or less at R = 150 | |
| λ = 3.0 μm (NIRSpec): 1.32 × 10⁻³³ W m−2 Hz−1 S/N = 10 in 104 s or less at R = 100 | |
| λ = 2.0 μm (NIRSpec) : 5.72 × 10⁻²² W m−2 S/N = 10 in 105 s or less | |
| λ = 10 μm (MIRI Imager): 7.0 × 10⁻³³ W m−2 Hz−1 S/N = 10 in 105 s or less at R = 5 | |
| λ = 21 μm (MIRI Imager): 8.7 × 10⁻³² W m−2 Hz−1 S/N = 10 in 105 s or less at R = 4.2 | |
| λ = 9.2 μm (MIRI Spec): 1.0 × 10⁻²⁰ W m−2 S/N = 10 in 105 s or less at R = 2400 | |
| λ = 22.5 μm (MIRI Spec) : 5.6 × 10⁻²⁰ W m−2 S/N = 10 in 105 s or less at R = 1200 | |
| MR-121 | Maximum NIR stray-light levels in MJy Ster−1: |
| λ = 2 μm: 0.091 | |
| λ = 3 μm: 0.070 | |
| MR-122 | Maximum MIR stray-light levels in MJy Ster−1: |
| λ = 10 μm: 3.9 | |
| λ = 20 μm: 200 | |
| MR-211 | OTE Area * transmission >22 m2 for wavelengths greater than 2 μm |
| MR-110 | NIRCam Strehl greater than 0.8 over the NIRCam FOV |
| MR-116 | MIRI Strehl at λ = 5.6 μm greater than 0.8 |
| MR-113 | 24 hr Encircled Energy (EE) Stability: Without ground commands there shall be less than 2% rms variation in EE stability within a 0 08 radius at l = 2 μm over a 24 hr period 08 radius at l = 2 μm over a 24 hr period |
| MR-114 | Conditions for Stability: The 24 hr stability requirement shall be met for any combination of target locations within the FOR including those separated by a worst-case thermal slew of 10° |
| MR-115 | EE Long-term Stability: The EE within a radius of 008 at a λ = 2 μm shall not change by more than 2.5% in less than 14 days following a worst-case slew |
| MR-104 | The observatory field of regard shall be at least 35% of the celestial sphere |
Download table as: ASCIITypeset image
These Level 2 requirements drive the following major design challenges for the JWST observatory:
- 1.Cryogenic Challenge: The radiometric sensitivity and MIR stray-light requirements require low detector noise levels and low thermal emissions from the OTE optics. Operational temperatures for the OTE optics must be below 55 K, and NIR SI detectors that use HgCdTe must be below 45 K. The MIRI (Si:As) detector must be cooled to 6 K. Given the mass and size of the 6.6 m diameter OTE, the only reasonable option is to passively cool the OTE and NIR SIs by giving them good views to cold space and insulating them from solar illumination via a sunshield. NIR detectors will use cold space radiators, and the MIRI detector will be cooled by a dedicated cryocooler. Such large-scale passive cooling requires a highly effective insulating sunshield, very careful design and characterization of all parasitic heat paths, and sufficient cryogenic radiator margin to cover their uncertainties.
- 2.Size/Deployment Challenge: Radiometric sensitivity drives the OTE to an aperture greater than 6 m in diameter, and to effectively shadow the OTE over the FOR specified by MR-104, the sunshield must be approximately 15 m wide by 21 m long, about the size of a tennis court. An observatory of this scale cannot fit into the volume of any of the largest currently available launcher fairings, which have diameters of about 5 m. This forces the folding of the observatory for launch and unfolding it on orbit in a series of complex deployments. Such deployments have inherent reliability risks since they necessarily involve many mechanisms that are potential single-point failures. Additionally, deployments of items such as flexible "non-deterministic" sunshield membranes and cables pose risks of unintentional snagging and tearing and must be carefully managed and controlled during all stages of the deployment. Furthermore, the testing of such large deployments requires very complicated Ground Support Equipment (GSE) to provide effective gravity off-loading during all the configurations of the observatory experienced during all steps of the deployment
- 3.Mass Constraints: Early estimates of the mass of the observatory showed that margins against the lift capability of the available launchers for direct injection transfer trajectories would be tight. Since mass is the "currency" used by spacecraft engineers to solve problems, this constraint coupled with many of the other design challenges. Tight mass margins also force a more integrated architecture, where functional interfaces are not as "clean" as desired. Traditional methods of dynamic, thermal, and electrical isolations between elements and interfaces had to be balanced against their cost in mass. Such coupling results in the need for more detailed integrated analyses to compute performance since modifications to one subsystem could have significant impacts on others.
- 4.Optical Stability: The stability of the NIR point spread functions (PSFs) is specified in terms of an encircled energy (EE) stability over time periods of 24 hr and 14 days. Given the technical and program constraints, it was decided to address this requirement without using more complex active control systems. Therefore, the observatory was designed to provide structural–thermal stability as it slewed through its various attitudes in the FOR. This presented challenges not only for the design but also for the tests and analyses necessary to verify the level of stability.
- 5.Performance Verification: Its size, mass and range of temperatures (ambient on the hot side of the sunshield, 55 K or less on the cold side) make any flight performance tests of the observatory impractical. This challenge was realized very early in the mission formulation (Menzel et al. 2006). The verification of on-orbit performance requirements must therefore ultimately rely on analytical integrated models of the observatory, assembled from element or subsystem models that are correlated or validated by tests at these levels for metrics such as cryogenic margin, optical stability, stray light, and pointing performance. This approach must carefully allocate performance margin for interface interactions between those parts that are not correlated/validated by these individual tests. Additionally, performance degradation due to workmanship has to be either estimated and covered with acceptable margin allocations or bounded by observatory-level workmanship tests. This effort elevates the importance of the integrated systems analysis over and above that of a tool for trade studies and design evaluation.
3. Design Process
Fifty years ago, the design tools and methods for space systems development had a heavy dependence on physical "engineering models" or "breadboards" to allow testing to the levels of margin to be confident in the flight system robustness. Given the size and cost of systems like JWST, such methods could not be employed. There has been rapid evolution toward increasing dependence on analysis for this purpose, as sophisticated design tools have developed. However, JWST required a much heavier dependence on analysis than previous missions. The design process for the JWST involved all the traditional disciplines and practices but gave particular attention to the coordination of many unique trade studies given the fact that this observatory architecture had no precedent in past designs. Because of the mass constraints, many individual trade studies were highly coupled at the systems level and so it was difficult for any one element or subsystem to select a trade option without having significant impacts on others. Attention was also given to the role of Integrated Systems Analyses or Integrated Modeling (IM) to not only predict on-orbit performance but also ultimately as part of the verification process. Both of these areas were managed by the Project Mission Systems Engineering (MSE) Organization.
3.1. Observatory Design Trades
Well over 70 observatory-/system-level trade studies were conducted prior to the JWST Critical Design Review in 2010 April. These trades involved the selection of the orbit parameters, launcher adapters, angular momentum management, command and telemetry formats and data rates, observatory thermal design architecture, propulsion subsystem design, and test facility design.
There were three practices used by MSE to coordinate these trades, many of which were executed in parallel:
- 1.Every trade team submitted a plan to MSE for review. As a minimum, this plan contained the options that were being considered, the trade criterion, the analyses that would generate the performance metrics, and a rough schedule. The MSE review and coordination of these plans ensured that all considered options, analyses and analyses assumptions, and boundary conditions were compatible with the overall system, or with the other trades that were being conducted.
- 2.MSE managed a system baseline at all times. This was used as a point of departure for each trade study to assess system impacts (interface and/or unexpected behaviors) in parts of the system not necessarily considered by the trade team. The baseline could only be changed by MSE and was monitored by both MSE and Project Management in terms of a list of system-level Technical Performance Metrics (TPMs)
- 3.The final selection of the trade option involved approval from MSE. It is almost an axiom in dealing with highly integrated systems, that what is optimal for a given part or subsystem is not optimal for the system. As part of this methodology, the trade studies usually presented a set of recommended solutions and their quantified benefits and risks to MSE and the Project. MSE then used this "menu" of recommended solutions from the various trades to assemble a system solution.
3.2. Integrated Systems Analyses
Systems engineering analysis played a key role at all the stages of JWST development and implementation where many of the performance requirements could not be tested as-you-fly prior to launch due to the complexity and size of the observatory. The end-to-end performance verification entailed the combination of models spanning the engineering disciplines affecting JWST performance: thermal, structures (jitter, thermal distortion, launch environments), attitude control line-of-sight, optics including 0-G alignments, wave-front control, and stray light. The interdependencies between the discipline models are depicted graphically in Figure 2 and are what are generally referred to as integrated modeling (IM). For instance, the analyses supporting verification of the image quality requirements are (1) thermal distortion, or structural–thermal–optical, to estimate optical WFEs from alignment and figure thermal drift due to observatory repointing and other transient factors; (2) jitter, to estimate the blurring and distortion due to uncompensated pointing and vibration; and (3) wave-front sensing and control, to estimate the postcalibration alignment and figure errors. Information about each of the discipline models and analyses is reported in these references (Howard 2004, 2007, 2011; Howard & Ha 2004; Hyde et al. 2004; Johnston et al. 2004; Knight et al. 2012; Howard et al. 2008; Lightsey & Wei 2012).

Figure 2. The JWST integrated modeling process.
Download figure:
Standard image High-resolution imageJWST relied on modeling to a degree surpassing previous NASA Astrophysics programs. Furthermore, JWST did not benefit from modeling experience or flight data from previous missions to offer an a priori measure of the predictive accuracy of such a complex system. For these reasons, novel and robust processes were established to provide the needed credibility of the analysis predictions for requirements verification. In many respects, JWST flight model development, implementation, and verification followed the rigorous principles applied to flight hardware to ensure the best IM outcome. Highlights of the JWST IM approach are reported herein; for more extensive details check Mosier et al. (2004), Muheim et al. (2010), and Muheim & Menzel (2011).
Many of the JWST critical requirements were captured in specific values that were tracked as TPMs. IM mainly supported JWST Missions Systems Engineering for tracking and verification of the TPMs of the image quality and environmental requirements. At the top level, the requirements for image quality are specified in terms of Strehl ratio and EE stability. In turn, these are then flown down into the optical error budget, which sets allocations for (1) actuator range as the observatory cools down from ambient to its coldest temperatures, (2) static WFEs from on-orbit alignments, and wave-front sensing and control corrections, (3) quasi-static and dynamic WFEs from thermal drifts, as well as alignment and figure vibrations, and (4) image motion (line of sight) (Lightsey et al. 2004). The sensitivity requirement is the basis for allocations to radiometric performance, stray-light suppression, and detector performance. Separately, IM provided inputs for the analytical assessment of the Attitude Control System (ACS) line-of-sight (LOS) requirements to on-orbit thermal drifts through the Star Trackers and to vibration sources such as the Reaction Wheels and Cryocooler. All the analyses described above were performed in the observatory Deployed Configuration. The Environmental Requirements governed the Stowed Dynamics analyses for Launch Loads, as well as Launch and Ascent assessments in the Deploying configuration.
3.3. Accommodating Model Uncertainties
In general, requirements verification was performed with worst-case analyses in the most stressing observational scenarios, which provided additional buffer for modeling uncertainties. This included extreme slews from hot to cold attitudes, assuming disturbances from the six Reaction Wheels were applied in phase with conservative cryogenic damping and End-of-Life (EOL) material properties. Separately, analyses performed in support of commissioning activities applied realistic conditions for best estimate predictions of flight data, these included the post-launch thermal cool-down and commissioning calibration for thermal slew and pointing stability using Beginning-of-Life (BOL) properties. There were also "Day-in-the-Life" analyses to help with the scheduling of science observations based on the Design Reference Mission (DRM).
Depending on the physics and parameters represented in the model, several approaches were implemented to estimate model uncertainties, where the performance error budgets tracked model predictions plus their uncertainties against performance requirements to evaluate margins. Model uncertainties included variations in material properties, assembled tolerances, and approximations in numerical solutions and boundary conditions:
- 1.To ensure the robustness of performance prediction many model parameters were set at their conservative expected extreme values. The bounding parameter values can be based upon specification, where it is known through test that the components will comply. Examples were reaction wheel imbalances, gyroscope and star tracker noise, and cryocooler heat load.
- 2.The bounding values also came from tests on an ensemble of coupons that were exposed to the appropriate environmental profile. The ensemble was sufficiently large to establish a statistical basis for the prediction of the extreme value. Examples of parameters that were determined through ensemble tests were EOL surface absorptivity determined after accelerated radiation exposure, and coefficient of thermal expansion determined after cryocycling.
- 3.An alternative approach was the use of a model uncertainty factor (MUF) to cover reasonable uncertainties in the physical model of the observatory. The MUF included subfactors reflecting design maturity as well as the degree of model validation based on tests. In some cases, the MUF value was based on experience with test-model correlation from heritage programs, such as in the case of stowed and deployed dynamic analysis.
- 4.Stochastic methods were also used to determine prediction bounds and MUFs due to known statistical variations in the most sensitive model parameters. Stochastic analysis was performed using Monte Carlo methods on the same flight models used for the nominal performance prediction. Most notably, stochastic analyses were run to assess the Thermal Distortion analysis MUF due to variations in the Coefficient of Thermal Expansion (CTE) in the composite structures.
The accuracy of each discipline model was eventually validated against a series of tests as defined in each discipline's Model Validation Roadmap. Tests were prescribed from the lowest level of assembly up to the system level, as appropriate, where the success criteria for correlation were often derived from the allowable uncertainty in the model predictions. Because of cost and schedule constraints, model validation tests were reserved for the most critical aspects and configurations of the model. In some instances, validation was limited to comparing analysis results from two independent teams and modeling tools, known as model cross checks as addressed later. Also, in the early phases of the project, significant effort was applied to testing material properties including sample-to-sample material variability and temperature-dependent properties down to cryogenic temperatures. The information was compiled into a JWST Materials Property Database for common reference across the Project.
The Model Validation Database summarized the planned tests and model correlation efforts dating back to 2005, where each individual activity was referenced to one or more relevant reports and collected into the Project Library for future access if necessary. Similarly, as part of the Deliverable Item List, the Element and Observatory models for each discipline and their documentation were provided and collected into the Project Library.
3.4. Managing the Modeling Effort
In essence, the IM task was, first, one of management, where the IM Lead's prime responsibility was to certify the analysis results to the Mission Systems Engineer for requirements verification. This begins with defining requirements for model verification and validation as specified in two key project documents, the JWST Math Model Guidelines and the JWST System Model Validation Plan. These documents establish requirements on the analyses to be performed for requirements verification, manages the interface and transfer of data between the various discipline models, plan modeling cycles in support of the key Project milestones, and define the model validation roadmaps for each of the modeling disciplines, as mentioned previously. These Project modeling plans also enforce model configuration, the tracking of model changes over time, the reviews of the model verification and analysis results, the reviews of the model validation test plans and results, and documentation of all models and analyses for requirements verification at the various project reviews.
However, it should be noted that the IM effort was more than just exercising the discipline models to predict key on-orbit performance. Because JWST was verified primarily by analysis, the predictions needed to be accurate, and all flight models needed to be treated and managed with the same attention to detail as the flight hardware. This was especially critical since many component and discipline models were delivered from disparate groups, within NASA itself as well as the prime contractor and its subcontractors. Over the years, nearly 500 people from all over the country have contributed to the JWST IM effort, all working collaboratively and remotely since the early phases of the Project.
The individual modeling disciplines, or "threads," were organized as working groups with badgeless membership from both the NASA and contractor teams. It was the individual working group's responsibility for each discipline to construct the flight and test models and execute the analyses, to define the discipline model validation plans and success criteria, to define and execute tests for model validation, and to review the discipline-centric analyses prior to passing the results as inputs to the next discipline analysis. As an added measure, most discipline threads created two independent models by the NASA and contractor teams to cross check the analysis results. While appearing to be a duplication of effort, this approach has proven extremely beneficial in detecting modeling errors or inconsistent assumptions otherwise not identified through model verification and test validation.
The purpose of IM evolved with the project phases. In early Phase A, coarse models were used to investigate the sensitivities of the design to key performance metrics and to evaluate design trades. For example, the preliminary Yardstick Design from 2000, with only 900 structural elements was used to investigate pointing jitter, thermal stability and wave-front sensing and control (WFSC) as shown in Figure 3(a). Through this analysis, it was determined that there needed to be a 1 Hz isolator between the spacecraft and telescope in addition to the reaction wheel isolators to bring down the LOS jitter to the desired performance. The 1 Hz isolator remained a key component of the flight design. Other trades investigated with the Yardstick model that were not retained in the final design included a deformable mirror in addition to the segment 3 DOF control and WFSC control using active thermal control of the segments.

Figure 3. (a) Phase A yardstick structural model (2000): 900 elements. (b) Final thermal distortion model 2020 (7.5M elements, 71M degrees of freedom).
Download figure:
Standard image High-resolution imageThe size of the IM models grew rapidly after the pre-Phase A trades. For instance, the thermal distortion models culminated at over 7.5M elements and 71M degrees of freedom for the PSR cycle as shown in Figure 3(b). The final Stowed Dynamics model had over 2.83M elements and the Deployed Dynamics model had over 2.75M elements. All structural analyses were performed with NASTRAN. The thermal analyses performed with SINSA/TSS used over 97.7 K nodes and 12.5M conductors. For thermal distortion, temperature mapping techniques were developed to apply the temperatures predicted from the thermal model to the structural nodes.
Through Systems Requirements Review, IM supported the flow-down of requirements and allocations to lower levels of assembly. As the design matured for the Preliminary Design Review (PDR), the role of modeling became to validate the design concept by showing that it met the requirements with margin, subject to reasonable assumptions, and that initial suballocations to observatory elements and subsystems were also reasonable. Through CDR, the IM goals transitioned its activities from design formulation to requirements verification and model validation, starting with the component-level testing for model validation and requirements verification. Finally, past CDR, IM primarily focused on the element and observatory model validation tests for the system-level requirements verification and commissioning support.
There were 16 cycles for observatory-level performance assessment over the course of the project, including those in support of the major project reviews (e.g., PDR, CDR), as well as intermediate cycles for design or model changes such as the System Look-Back Review. Not included in this cycle count were modeling cycles at the element level, which formed the basis of the observatory model and for which element-level requirements verified by analyses were documented by each element at their Pre-ship Review prior to the Systems Integration Review (SIR): OTE, ISIM, and SCE. On average, a modeling cycle required 4–6 months. Each analysis cycle commenced with a Model Configuration Review (MCR). The objective of the MCR was to establish the design baseline for the current analysis cycle and to agree on all discipline model inputs and outputs among the working groups. The MCR was followed by the individual discipline analysis reviews with typically a final review of the results to the Project Systems Engineer.
There were also additional modeling cycles for major system-level tests requiring IM support and serving model validation goals. These included the OTE–ISIM (OTIS) tests in Chamber A at JSC and its three prior Pathfinder tests with a total of 13 modeling cycles, the Spacecraft thermal vac test, and the OTIS and observatory environmental tests in the stowed configuration. For these systems tests, separate test IM models were built in the test configuration, including the flight components with additional test GSE and interfaces, in the test-specific environments. The Test IM models were built, verified, and controlled with the same process and rigor as the flight models, including model reviews, documenting model configuration and model verification, and tracking modeling changes, as well as running test IM analyses for test requirements and performance verification ahead of the tests. Model uncertainties were also tracked and coupled with measurement errors to assess the model prediction against the test data. In the case where the model prediction deviated from the test data, it was then determined whether the difference was due to a test error, a hardware workmanship issue, or a modeling concern (e.g., IEC thermal cycling and frill effects identified during the OTIS tests). Any changes to the IM test models identified from model validation were then applied to the IM flight models with the appropriate considerations for flight conditions and configuration.
The conservative modeling assumptions, MUF strategy, and the managed approach to model integration, verification, and validation described herein were verified on orbit where most flight performance results were at or better than the predictions, affording JWST a substantial margin to potentially operate over the extended 20 yr mission life. Notable deviations included thermal time constants post slew, which was not unexpected since thermal transient models were not validated, as well as evidence of stray-light leakage.
4. Observatory Design
4.1. Observatory Overview
A summary of the observatory is illustrated in Figure 4, which shows the deployed configuration and the stowed launch configuration. The observatory consists of three major elements: the OTE, the ISIM, and the SCE, which consists of the Spacecraft Bus and the Sunshield. The OTE and ISIM are shaded from solar illumination by the sunshield and passively attain a temperature below 55 K. The spacecraft bus and its traditional subsystems are on the "hot" side of the sunshield and operate at temperatures closer to ambient.

Figure 4. Summary of the JWST Observatory.
Download figure:
Standard image High-resolution image4.1.1. Optical Telescope Element (OTE)
The OTE, illustrated in Figure 5 is a Tri-Mirror Anastigmat Cassegrain telescope. Its optical configuration consists of an all-reflective four-mirror design in a three-mirror anastigmat configuration (Contreras & Lightsey 2023). It contains an elliptical primary, hyperbolic secondary, elliptical tertiary, and an actively controlled fine steering mirror for image stabilization. The primary mirror encompasses a maximum 6.6 m circumscribed circle and is formed from an array of 18 smaller hexagonal mirror segments (PMSA), with each one having an edge-to-edge distance of 1.2 m (1.52 m point to point). The primary mirror is launched with its segmented wing mirrors folded, which were unfolded after launch. The secondary mirror is circular and has a diameter of 0.738 m. The tertiary mirror, along with the Fast-Steering Mirror (FSM), is contained in the Aft Optical System (AOS) housing on the center of the Primary Mirror. This housing also contains baffles and the pupil mask.

Figure 5. JWST optical telescope element.
Download figure:
Standard image High-resolution imageThe secondary mirror is held in place by the Secondary Mirror Support Structure (SMSS), which consists of three M55J composite struts. This tripod folds at four hinges to deploy the SM from its stowed location to its deployed position. The OTE assembly has an open geometry with no baffle tube around its elements. This reduces mass, but more importantly allows more efficient radiative cooling of the telescope optics to achieve the requisite cryogenic temperatures. All the mirrors and mirror segments were made from light-weighted Beryllium. Each primary mirror segment has a mass of less than 40 kg of which 20 kg is the bare beryllium mirror with the remaining mass consisting of the actuator assembly and support. Beryllium was chosen over several materials due in part to its light weight, thermal conductivity, coefficient of thermal expansion, and ability to maintain its figure stability over operating temperatures for low, mid, and high spatial frequency content (Feinberg et al. 2012). Each PMSA and the SM have six actuators and are actively controlled in a hexapod configuration. The hexapods enable a 6 degree of freedom rigid-body position of the segments. The PMSAs also use a seventh actuator for the radius of curvature adjustment. This arrangement enables dual axial adjustment of the primary mirror segments and the secondary mirror. The PMSAs are coated with gold and topped with a protective overcoating of silicon oxide. The gold coating provides a reflectivity of over 97% for most wavelengths above 1 μm. The primary mirror effective area is required to be over 25 m2 and was verified through analysis, testing, and flight measurements. The telescope's wavelength-dependent transmission ranged from 0.786 at 0.8 μm to 0.933 at 28 μm. This exceeds requirements at each wavelength.
The PMSAs are mounted on an M55J composite-tube Primary Mirror Backplane Support Structure (PMBSS), which has two deployable wings attached to a fixed center assembly that fold to the stowed launch configuration.
The PMBSS is attached to the spacecraft bus during launch by four Launch Release Mechanisms (LRMs) at its four "feet." After launch, these LRMs are released and the OTE is raised away from the spacecraft by a telescoping Deployed Tower Assembly (DTA).
Finally, a fixed Tertiary Mirror (TM) and Fine Steering Mirror (FSM) are housed in the AOS behind the Cassegrain focus. The FSM is controlled in two DOFs by the Fine Guide Control (FGC) loop based on error signals from the Fine Guidance Sensor to provide a ∼1 Hz LOS pointing control during science observations.
4.1.2. Integrated Science Instrument Module
The four SIs are mounted in a common assembly called the ISIM illustrated in Figure 6. The M55J composite ISIM structure mounts to the OTE PMBSS to provide optical metering between the SIs and the telescope.

Figure 6. The integrated science instrument module.
Download figure:
Standard image High-resolution imageAside from their science functions, two of these SIs provide broader observatory-level housekeeping functions. The NIRCam SI provides image data used for WFSC to align and phase the optical elements of the OTE after their initial deployment and for periodic adjustments during the mission. The FGS provides the error signal for a specific guide star for each science observation for the Fine Guidance Control loop to control the OTE FSM.
The ISIM structure and the four SIs are housed by a thermal enclosure provided by the OTE, which also provides the cold space radiators that passively cool the NIR SI detectors to 45 K. The MIRI detector, which must operate at 6 K, is cooled by a dedicated cryocooler.
The majority of the SI electronics that control mechanisms and process the focal plane signals are designed to operate at room temperatures. Locating them in the spacecraft bus would require up to 10 m of signal path, which could add electrical noise and pose additional complications for SI testing at the OTE–ISIM level. For this reason, the ISIM provided a highly insulated, ambient temperature ISIM Electronics Compartment (IEC) on the cold side of the observatory. The IEC mounts to the OTE PMBSS just below the ISIM thermal enclosure. The IEC uses directional radiators to dump the roughly 230 W of power dissipated by the ambient electronics boxes in a direction that avoids impingement on the cold side of the sunshield.
In order to reduce electrical noise, the NIR SIs have cryogenic Application Specific Integrated Circuits to perform analog to digital conversion of the focal plane signals before sending them to the Focal Plane Electronics housed in the IEC.
The ISIM also provides a dedicated ISIM Command and Data Handling (IC&DH) processor housed in the Spacecraft Bus to control ISIM and SI flight software functions. Among these is ISIM Fault Management.
4.1.3. Sunshield
The large, deployed Sunshield, illustrated in Figure 7, provides the necessary shading from the Sun and needed heat attenuation to enable passive cryogenic cooling of the telescope and instruments. The Sunshield consists of five individual thin film membranes pulled into position and separated by six spreader bars. Layer-to-layer separation allows incident solar energy to escape to space prior to reaching the cryogenic side of the observatory. These five layers are fan-folded for launch and structurally supported for launch via a system of 107 pins, Membrane Release Devices (MRDs) that attach them to the two large composite Unitized Pallet Structures (UPSs). The UPSs provide the primary structural support to the five membranes during launch. After launch lock release, a spooler assembly winds up a cable and pulls through a four-bar mechanism at the base of each UPS, pulling it down into position. The deployed hub/rim assembly connects the five layers to the top of the Spacecraft Bus. Two composite telescoping booms, Mid-Booms, are pushed out with an internal stem drive and pull out the folded membrane stack into its deployed position. A series of six Membrane Tensioning Systems (MTS) on each of the six corners, two on each UPS and one on each mid-boom, winds in a series of cables to raise and separate each layer on its spreader bar and stretch the membranes into their final shape. Each MTS winds and controls 15 individual cables, with each membrane corner having three separate pull points. The higher-tension main pulls on the embedded catenary and provides the main shape to the layer, while two lower-tension pulls provide tension to the membranes outline edges. Within the MTS, a series of constant force negator springs provide the cable tension and ensure the shield layers stay in position as shield temperatures change and the observatory changes attitude.

Figure 7. The JWST sunshield design.
Download figure:
Standard image High-resolution imageThe sunshield was sized to satisfy the requirement that the Field of Regard (FOR) exceed 35% of the celestial sphere while keeping the OTE and ISIM shadowed for passive cooling. As illustrated in Figure 8, the designed sunshield allows the observatory to slew in pitch of 5° toward the Sun and 45° away from the Sun. The observatory can slew in yaw 360° about the Sun line to yield an FOR of 39% of the celestial sphere. The sunshield is further sized to allow the observatory to roll about the target boresight by ±5°.

Figure 8. JWST field of regard.
Download figure:
Standard image High-resolution imageThe Sunshield Membranes, shown in Figure 9, are manufactured from Kapton E. Layer 1, the hot Sun-facing layer is 0002 thick and coated on the Sun side with metallized silicon to modulate temperatures while providing electrical conductivity and long-term durability. Its back side is coated with vapor deposited aluminum (VDA). Layer 2 is identical to layer 1 to provide some redundancy in case there are any large tears in layer 1. Layers 3–5, with 5 facing the telescope, are 0001 thick and coated with VDA on both sides. Each membrane layer has an embedded catenary to distribute the pulling forces of the deployed hard structure. This catenary and the edge of each membrane incorporate a corrugated "compliant" border to prevent shear loads from buckling and distorting the layers in their final tensioned state. Each layer also has a large number of small-precision located vent holes and MRD support holes for hold-down and venting during launch.

Figure 9. The JWST sunshield membrane design.
Download figure:
Standard image High-resolution image4.1.4. Spacecraft Bus
The Spacecraft Bus illustrated in Figure 10 provides the traditional flight subsystems: Structures, Electrical Power, Command and Data Handling, Telecommunications Attitude Control Subsystem (ACS), and Propulsion. Table 3 summarizes the key points of these subsystems.

Figure 10. The JWST spacecraft bus.
Download figure:
Standard image High-resolution imageTable 3. Summary of Spacecraft Bus Subsystems
| Subsystem | Features |
|---|---|
| Bus Structure | -Primary structure consists primarily of M60J/RS-3C composite laminates |
| -Composite central cone with bolted interface to Al LV interface ring | |
| -Composite panel shear panels bolted to central cone | |
| -J3 composite panels | |
| Electrical Power Subsystem | -2138 KW triple junction gallium arsenide five-panel solar array. 12.9 m2 with 4060 total cells |
| -126.9 Amp-Hour ABSL lithium-ion battery (De-rated to 105.6 A-H). Operating voltage from 24 to 33.6 V. | |
| -Telemetry Acquisition Unit (TAU): Relay Switching, Heater Drives, Ordnances, Pulse Cmds | |
| -Power Control Unit (PCU): Main Bus Voltage Control, SAR Control, Load Control, Fusing | |
| Command and Data Handling | -Command Telemetry Processing (CTP): Spacecraft Controller, CMD Decoder, Tlm Encoder, Data Formatter |
| -Configuration Control Unit (CCU): CTP Autonomous Fault Manager, | |
| -471 Seakr Solid State Recorder (seven for eight board redundancy) | |
| Telecommunications | -S-band Transponder for Command & Telemetry |
| -Command Rates (250 bps to 16 kbps) | |
| -Telemetry Downlink Rates (200 bps to 40 kbps) | |
| -Doppler ranging | |
| -Ka-band Science Downlink at 28 Mbps, Tesat Spacecom Modulator, and 2 for 1 50 W TWTA Tesat Spacecom | |
| -HGA/MGA from RUAG. 0.6 m dia dish 42.3 dBi peak gain | |
| Attitude Control Subsystem | -6 for 5 Reaction Wheel Assemblies (RWAs), Rockwell Collins Deutschland 68 NMs at 6000 rpm |
| -2 for 1 Inertial Reference Units (IRUs), HGES, HRGs, each unit has 4 for 3 gyros, and 2 for 1 electronics | |
-2 for 1 Fine Sun Sensors (FSSs), Selex, accuracy 0 06 06 | |
| -3 for 2 Star Tracker Assemblies (STAs) Selex, NEA (23:, 22, 2,2'') | |
| Propulsion Subsystem | -Bipropellant Systems with 5 lb Secondary Combustion Augmentation Thrusters SCATs (Isp = 305 s to 272 s) |
| - 1 lb Monopropellant Rocket Engines (MRE) | |
| -178 kg N2H4 tank, 132 kg N2O4 with GHe pressurant. Max pressure 350 psi. |
Download table as: ASCIITypeset image
The JWST Command and Data Handling System and Telecommunications are sized to store 471 Gbits of science and engineering data at End of Life (EOL) and downlink high-rate science and engineering data at a maximum rate of 28 Mbps via a Ka-band RF link. Low-rate data can be transmitted via an S-Band downlink at a maximum rate of 40 Kbps. Commands are uplinked to the observatory via an S-band Uplink at a maximum rate of 16 Kbps.
The final as-measured mass and power-load budget for the observatory is shown in Table 4 down to the subsystem level for the spacecraft bus. Power loads are for average loads for normal operations. Harness power includes primary power line and distribution losses. The observatory solar array maximum output power was 2300 W at 6 yr on orbit and 2294 W at 10.5 yr. During launch and ascent, observatory power is provided by a 105.6 amp-hour (nameplate) lithium-ion battery.
Table 4. Observatory Mass and Power Loads
| Element/Subsystem | Mass (kg) | Power (Watts) |
|---|---|---|
| Optical Telescope Element | 2333 | 33 |
| Integrated Science Instrument Module | 1245 | 243 |
| MIRI Cryocooler and Accommodation Hardware | 79 | 384 |
| Sunshield | 687 | |
| Spacecraft Bus (Dry) | 1516 | 1369 |
| Structure & Mechanisms | 691 | |
| Attitude Control Subsystem | 122 | 184 |
| Electrical Power Subsystem | 164 | 64 |
| Command & Data Handling Subsystem | 39 | 140 |
| Telecommunications | 20 | 170 |
| Electrical Harness | 266 | 227 |
| Thermal Control Subsystem | 129 | 437 |
| Propulsion (Dry) | 74 | 118 |
| Deployment Control Subsystem | 11 | 29 |
| Propellant | 301 | |
| Total | 6161 | 2029 |
Download table as: ASCIITypeset image
The observatory carried 301 kg of propellant, which was sized to correct a 3σ injection dispersion from the launch vehicle plus a 10.5 month operational mission life, which included a periodic station keeping to maintain the L2 orbit and periodic unloading of angular momentum stored in the ACS Reaction Wheel Assemblies (RWAs). Because the Ariane 5 launch dispersions were well below its 3σ level, the onboard propellant reserves after dispersion correction can support a mission life over 20 yr.
4.2. Observatory Deployments
The mechanical architecture of the observatory is driven primarily by the complex series of deployments that must be executed to transition from its stowed configuration to it operational configuration. This involves the use of several hundred LRMs, some, such as those at the interface between the PMBSS and the spacecraft bus, that are in the primary path of launch loads.
This series of deployments, arguably the most complicated ever attempted in a space observatory are illustrated in Figure 11. These deployments begin immediately after launch vehicle separation at Launch (L)+31 minutes and extend over a period of 14 days.

Figure 11. JWST deployment sequence.
Download figure:
Standard image High-resolution imageImmediately following the observatory separation from the Ariane 5 upper stage, onboard software initiated the deployment of the solar array to provide electrical power and charge the observatory batteries. Prior to this, observatory power is provided by the batteries, which can maintain the observatory power load for up to 13 hr before reaching their critical voltage limit, making this deployment a time critical step. Since no other deployments had such time criticality, they were initiated by ground command, and conducted after the completion of Mid Course Correction maneuvers 1A and 1B (MCC-1A and 1B). These maneuvers performed at L+12.5 hr and 2.5 days, respectively, correct launcher dispersions and trim the observatory trajectory.
The first of these deployments involves the release and rotation of the Forward and Aft UPSs at L+3 days. These stow the folded sunshield membranes for launch and ascent. Following these deployments, at L+4 days, the OTE was released from its LRMs on the spacecraft bus and raised about 1.5 m by the telescoping DTA.
At L+5 days, 107 MRDs, which hold the five folded sunshield membranes and their protective covers to the UPSs, are actuated in groups. This allowed the protective cover to roll up and out of the way. Two telescoping Mid-Boom Assemblies (MBAs) then pulled out the sunshield membranes. Each of these five layers were then sequentially tightened to achieve their correct shape and layer-to-layer separation by motor-driven cable systems at the six spreader bar assemblies at each of the vertices of the sunshield.
The last of the major deployment steps unfolded and locked the OTE in its final configuration. The first of these, conducted at L+10 days, was the deployment of the secondary mirror by its tripod support structure. Finally, the wings of the primary mirror are rotated and latched into position at L+12 and L+13 days.
JWST deployment systems used numerous sensors of vary types to confirm actuation initiation, deploying motion, and completion. Fault management system used telemetry subsets to warn and/or stop motor-driven deployments in the event of selected telemetries exceeding preset limits. Most deployment actions use multiple data sets to confirm deployment actions. An example is the use of microswitch, solar cell power, and temperature data to confirm solar array deployment. It is important to note deployment telemetries (release/deploy) were not used as part of deployment commands. Operation teams were required to use telemetry data for confirming all deployment actions.
The deployment systems used redundant features where necessary to increase reliability without significant increase in complexity and/or resources such as mass, power, telemetry data. All release actuators, telemetry sensors, and deployment motors were configured with redundant electrical circuitry. All rotating bearing components and hinge lines were designed with multiple rotating paths. Other key redundant architectures are:
- 1.Primary and redundant sensor signals monitored simultaneously
- 2.Redundant drive electronics for each motor and release actuator
- 3.Redundant deployment spring configuration
- 4.Ground commands can be sent with varying parameters.
All deployment motors used heaters to maintain minimum operating temperature. The SMSS and PMBA hinge lines were actively thermally controlled prior to and during deployment. Spring-driven deployments and releases were designed with appropriate material and component selection for the predicted environment.
4.3. Optical Architecture
At the observatory level, JWST's optical architecture addresses the science mission objectives by optimizing performance in terms of image quality quantified by the Strehl ratio and optical WFE over an 18' × 9' field of view (FOV), optical throughput quantified by OTE area × transmission (A × T), and by minimizing stray light.
4.3.1. OTE Prescription and Ray Trace
The ray traces of the optical paths through the OTE are illustrated in Figure 12, which also shows the FOV allocations for the SIs at the OTE focal surface.

Figure 12. Optical ray trace and prescription of the JWST OTE.
Download figure:
Standard image High-resolution imageThe OTE is a reimaging system. The primary and secondary mirror forms an intermediate image within the AOS where a real exit pupil is formed. The entrance pupil is intentionally located at the primary mirror. This arrangement provides enhanced stray-light suppression and pointing stability. The telescope has an effective focal length of 131.4 m at f/20. The primary mirror has a radius of curvature of 15.87 m, the convex secondary is located 7.169 m away from the primary mirror and has a 1.779 m radius of curvature. The three-mirror anastigmat is used on axis in aperture but off axis in field. The 6.6 m primary mirror is an elliptical f/1.2. The mirror segments are conic sections with no higher-order aspheric departures. The hyperbolic secondary mirror is an f/9 and forms an intermediate image near the primary mirror vertex. The tertiary mirror is elliptical and images the pupil to the fine-steering mirror. The tertiary mirror is slightly decentered to maximize performance. It forms the common curved image surface for the SIs. The center of curvature of the image surface is located at the fine-steering mirror. This minimizes defocus during stabilization operations. The design provides a FOV of a nominally rectangular 18 2 × 91. However, the FSM vignettes a portion of the 18.2 × 9.1 space. This is necessary to minimize FOV and WFE distortion. The optical design was optimized to minimize differential field distortion, where differential distortion is defined as the change in the FOV mapping as a function of spacecraft jitter. Regular distortion can be calibrated out.
4.3.2. Image Quality
The primary requirement driving image quality was MR-110, which specifies a Strehl ratio of 0.8 at a wavelength of 2 μm over the NIRCam FOV. A total system WFE of 150 nm was derived from this and broken down into the following allocations:
- 1.Total static WFE (OTE + NIRCam) 99 nm
- 2.Thermal distortion/drifts: 58 nm
- 3.Figure vibrations 13 nm
- 4.Image motion 69 nm
- 5.Systems margin 66 nm.
The Total Static WFE allocation is addressed by design of the OTE and SI optical prescriptions and suballocations of random WFE among their optical elements.
Thermal distortion and their figure and alignment drifts were addressed by careful design and analyses of the thermal stability of the optical elements over the changing thermal environments induced by attitude changes over the observatory FOR, specifically those of changing pitch angle. One of the primary reasons beryllium was selected for the OTE optics to minimize sensitivity to these variations in temperature gradients, particularly at these cryogenic temperatures. Similarly, the thermal structural stability was one of the primary driving requirements for the design of the PMBA.
Figure vibrations and image motion allocations are addressed by the a variety of means including suppression of vibration transmission from sources in the observatory to their responding optical components. A more detailed description is given in Section 4.5.
Finally, the system margin allocation was reserved at the system level for verification uncertainties as well as potential on-orbit "unknown unknowns."
A key element of the JWST optical architecture is the WFSC subsystem necessary to perform the postdeployment alignment, focusing, and phasing of the OTE elements and perform periodic maintenance WFE corrections during the life of the mission. The NIRCam instrument is located near the center of the telescope focal plane and serves at the primary wave-front sensor for the observatory. NIRCam is equipped with specialized grisms and lenses to enable alignment of the mirrors with deployment errors of millimeters to the final alignment of nanometers. There is also a pupil imaging lens that checks for pupil alignment and is used to inspect the pupil for changes in transmission from micrometeoroids. Wave-front data taken from NIRCam is downlinked to the ground system, where it is analyzed, the mirror state corrections are determined, and the requisite commands to make the PM and SM mirror actuator moves are prepared. Imagery from all the SIs are used initially to ensure the corrections provide a well-balanced residual WFE over the entire OTE focal surface. This is discussed in more detail in McElwain et al. (2023).
4.3.3. Optical Throughput
Optical throughput, (A × T), is calculated to vary from 15.375 at 0.8 μm to 22 for wavelengths greater than 5 μm. The analysis of the telescope's throughput also accounts for particulate and molecular contamination that accumulate over time on the mirrors. The telescope's transmission is the product of the reflectivity for each of the four mirror surfaces. The spectral transmission range for the telescope element is from 0.6 to 29 μm in wavelength. The primary mirror effective area is required to be over 25 m2 and was verified through analysis, testing, and flight measurements. The telescope's wavelength-dependent transmission ranged from 0.786 at 0.8 μm to 0.933 at 28 μm. This exceeds requirements at each wavelength.
4.3.4. Stray-light Control
The optical architecture incorporates numerous features to block or substantially reduce stray light from reaching the SI's detectors. Stray light is required to be blocked from bright celestial sources, the natural background of zodiacal dust, and the MIR self-emission from the observatory itself. NIR stray light is the result of scattering or sneak paths from celestial sources. Because NIR stray light can vary with observatory pointing, the requirement was specified for a benchmark location where the background radiance is 1.2 times the minimum zodiacal brightness (Lightsey et al. 2014; Rigby et al. 2023b). NIR stray light is controlled by baffling and contamination control of optical surfaces. MIR stray light is the result of thermal emission from observatory optics and thermal surfaces, which get into the light path. MIR stray light is controlled by thermal control of critical surfaces. Contamination also affects the emissivity of these surfaces.
Although the sunshield blocks sunlight and earthlight and provides thermal isolation for the telescope and instruments, the telescope is still exposed to direct illumination from the celestial sphere. This celestial light can originate from the galactic and zodiacal sky that reflects or scatters from the observatory surface and finds its way, through reflections, to the instrument's focal plane. Critical features of the stray-light optical design are illustrated in Figure 13, which also illustrates two of the primary stray-light paths named the Truant Path and Rogue Path. These features include the incorporation of a "Frill" baffling around the Primary Mirror perimeter, an intermediate image baffle (pseudo field stop), and a classical Lyot baffle at the FSM. Each SI is arranged such that light can only enter the instruments through their fore optics and the SI optics are baffled such that their detectors see little light other than that which comes from their internal pupil stop. In addition, light entering the ISIM cavity is restricted to that which can enter through the OTE AOS entrance aperture. So, light entering the AOS entrance is either light that is within the optical train of the OTE forming an image of the sky at the OTE optical surface or weak illumination from the celestial sky coming through the AOS entrance, bypassing the OTE optics and illuminating instrument pick-off mirrors and other structures internal to ISIM. These paths have the potential to pass just beyond the edge of the FSM as marginal rays coming from the OTE exit pupil and go directly to the SI detectors. This is mitigated by the FSM oversized baffle.

Figure 13. Key stray-light paths and their mitigations.
Download figure:
Standard image High-resolution imageTo baffle unwanted light around the exit pupil, the clear aperture of the FSM mask has the shape of the image footprint from the tricontagon-shaped primary mirror. The mask is painted black to attenuate the unwanted light coming from the perimeter of the primary mirror. To prevent the mask from contributing to the MIR thermal background, the mask's emissivity was required to be below 0.6. This ensured that the mask had low reflectivity in the NIR. Additionally, there are a series of epaulets placed between the layers of sunshields to ensure passive cooling and manage stray light originating from solar illumination of the spreader bars and blocking its radiation from reaching the telescope optics.
Although the FSM mask is oversized, light still can make its way from around the perimeter of the primary mirror, converge along the path to the perimeter of the SM, reflect through the gap between the FSM mask and the edge of the PM exit pupil, then propagate to the SIs' focal plane. The marginal rays from this larger effective entrance pupil set by the back-projected image of the FSM are referred to as the truant-path rays. To help block these truant paths for light coming from behind the OTE, an opaque baffle called the Frill is placed around the periphery of the PM.
A shield referred to as the "BIB" is used in control of the illumination of the SM. The structure in the core region around the Deployed Tower Assembly is substantially hotter than the Frill and PM. If these hotter surfaces are allowed to be within the view of the SM, the illumination of the SM will be scattered into the imaging path and cause excessive stray light. The BIB mitigates this, it is deployed from the PM lower edge to the sunshield thereby blocking these hotter regions.
The rogue path is defined as the path where light from the sky bypasses the primary and secondary mirrors, enters the Aft Optic System entrance aperture mounted on the front bulkhead, and illuminates the pick-off mirror of an SI directly. It was shown through analysis that the oversized FSM baffle blocks most of these rogue paths.
4.4. Thermal Architecture
The JWST thermal architecture was challenged by several factors:
- 1.Passively cooling a ∼3000 kg payload (OTE + ISIM) to temperatures at or below 55 K via a sunshield that can see temperatures as high as 400 K on its Sun-facing side.
- 2.Accommodating an ambient temperature IEC on the cold side of the sunshield with a power dissipation of up to 230 W.
- 3.Complying with constraints on temperature as well as temperature limits for a variety of environments (Ground Test Facility, Launch Site, Launch and Ascent, and Flight) for a variety of configurations (Stowed, Partially Deployed, and Fully Deployed). Additionally, there were constraints on the relative cool-down profiles between flight elements to avoid water migration on orbit to sensitive thermal and optical surfaces.
The keys to addressing these challenges were a robust sunshield thermal design, detailed attention to all the potential parasitic heat flows between the hot and cold sides of the sunshield, ample margins on cryogenic radiator capabilities, and careful management of the release of these margins to address design problems and to cover verification uncertainties since the observatory would never be thermally tested as an observatory.
Figure 14 illustrates a top-level summary of the primary heat paths through the observatory. The key player in this architecture is the five-layer sunshield which is illuminated on the Sun side by 218,000 W of radiation. Most of this radiation is reflected by the metallized silicon coating of the Sun-facing layer (Layer 1). Residual power that leaks through is reflected between Layer 1 and Layer 2 and eventually emitted out of the perimeter gap between the two layers. Residual power that leaks through Layer 2 is similar by reflections between it and Layer 3, and so on for the subsequent layers, 4 and 5.

Figure 14. Observatory-level heat flow diagram.
Download figure:
Standard image High-resolution imageThe cryogenic side of the observatory uses cold space radiators, provided by the OTE to cool the NIR SI HgCdTe detectors to temperatures of 40 K or less. A cold space radiator is also provided to cool a thermal shield around the MIRI, which has its detector actively cooled to 6 K by a cryocooler. High-purity heat straps provide the heat path from these detectors to the radiators. Three of these radiators are fixed to the roof structure of the OTE–ISIM Thermal Enclosure, and two additional radiators are deployed to view cold space on the Aft Deployable ISIM Radiator assembly as shown in Figure 15, which cites radiator area and design to temperatures. The MSE team formulated strict management control of the cryogenic rejection margins of these radiators with a goal of completing the design phase of the observatory with 60% after accounting for all known parasitic uncertainties. This management resulted in a final margin just before launch greater than 80%.

Figure 15. ISIM cryogenic radiator configuration.
Download figure:
Standard image High-resolution imageThe accommodation of the ambient IEC on the cold side of the observatory offered a unique thermal challenge. Its 230 W of dissipation was rejected by radiators with highly reflective directional baffles to prevent impingement and scattering of the aft side of the sunshield, as shown in Figure 16.

Figure 16. ISIM electronics compartment and directional radiator baffles.
Download figure:
Standard image High-resolution imageA further thermal challenge was the accommodation of the MIRI cryocooler, a multistage hybrid cooler system using a Pulse Tube (PT) precooler and a Joule–Thompson (JT) cryocooler to cool the MIRI detector below 7 K. The cooler system traversed all thermal regions of the observatory. Its compressors and control electronics are located in the spacecraft bus, which provides radiators for up to 400 W of dissipation for a cool down. Cooling lines traversed the region between the OTE and the spacecraft and enter the ISIM thermal enclosure to cool the MIRI detector.
The thermal control of the spacecraft bus and its electronics was more traditional, using zone-based heater control and radiators.
4.5. Line-of-sight Stability and Pointing Control
LOS stability to meet the image motion allocation cited in Section 4.4 is achieved by interactions of the Spacecraft ACS, the ISIM FGS, the OTE FSM, and components of the Structure and Mechanism subsystems. The ACS provides the coarse-pointing control to execute slews to science targets, and the ACS and FGS provide the Fine Guidance Control (FGC) loop to control the OTE FSM to maintain fine pointing and small-angle maneuvers during science observations. The structures and mechanisms subsystem provides isolation and damping of high-frequency vibrations above the bandwidth of this control loop, referred to as jitter. The primary sources of these vibrations are the RWAs and the Cryocooler Compressors. The ACS manages the RWAs, which are used to slew the observatory and store angular momentum from external torque sources, most notably from solar pressure on the sunshield. The ACS management includes avoiding wheel speeds where structural isolation or damping is low or where there exist problematic structural resonances. Finally, in-orbit tuning of the cryocooler compressor provides a means to avoid similar problematic compressor speeds. The overall pointing control architecture is illustrated in Figure 17.

Figure 17. JWST pointing control architecture.
Download figure:
Standard image High-resolution image4.5.1. Coarse-pointing Control and Momentum Management
The pointing control system uses a coarse-pointing and a fine-pointing scheme to achieve its precision pointing. Coarse-pointing control is used to slew the observatory to new targets in the sky, to maintain accurate pointing for guide star identification and acquisition for transition into fine guiding, and to maintain roll orientation control during science observation (fine guiding). Coarse-pointing attitude control is accomplished using an Inertial Reference Unit (IRU) and Star Trackers as sensors and Reaction Wheel Assemblies (RWA) for actuators. In addition, the Fine Steering Mirror (FSM) is commanded, at the end of slews to a new science target, to expedite stabilization of the OTE boresight for transition into fine guiding (guide star identification, acquisition, and track).
The Pointing Control Law calculates the attitude and rate errors of the spacecraft and generates a torque command in the body frame (three axes) to correct for those errors. An attitude determination scheme, based on an extended Kalman filter, is used to estimate the attitude of the body frame with respect to the inertial frame, to estimate the rate bias of the IRU, and, when FGS centroid data are available (e.g., guiding), to update an estimate of the alignment of the guider to the body frame.
The Reaction Wheel Controller computes the commanded torque for each of the reaction wheels to produce the body torque command, as required by the Pointing Control Law. The torque command is converted to a body momentum vector, which is then distributed to each RWA based on an L-infinity distribution logic (Markley et al. 2010) to maximize momentum storage capacity. The wheel speed controller drives the signal to each wheel based on the difference between the commanded momentum and the estimated momentum derived from the tachometer measurements.
The spacecraft manages angular momentum with RWAs for momentum storage, a deployed Momentum Trim Flap at the end of the Sunshield Aft UPS to balance the center of the solar radiation pressure against the center of mass, and the propulsion subsystem to periodically unload angular momentum from the RWAs. To meet momentum storage requirements, the spacecraft uses the L-infinity algorithm. A property of the L-infinity algorithm is that in a six-RWA configuration, at least four RWA will operate at the same speed. In a five-RWA configuration (assuming one RWA is lost), at least three RWA will operate at the same speed. In both cases, the two remaining wheels will spin at rates less than or equal to the other RWA. The RWA arrangement and distribution logic provides for stored momentum capacity of 95 Nms, with six wheels, and 70 Nms, with five wheels (i.e., one failed wheel). A wheel speed management system, composed of three parts, shall command deviations from the L-infinity algorithm. The first part is a "push through algorithm" to "push" one or two wheels through critical speed regions by balancing momentum among the other RWA. Critical speed regions are defined as speed regimes potentially detrimental for RWA life and/or speed regimes where potential interactions with observatory modes may result in degraded fine-pointing performance. The second part is a "separation bias" to put all of the wheels at least one RPM out of phase with each other, nominally. Finally, the third part is a "large bias" to force the RWA to operate above the "critical" speed regions.
4.5.2. Fine-pointing Control
Fine-pointing control is used to stabilize the LOS for science observations. The Fine Guidance Control (FGC) loop uses the centroid data from one of the two FGS to actuate the FSM and attenuate Guide Star (GS) motion, which in turn stabilizes/controls image motion in the active SI along the tip and tilt axes. It computes the control error by taking the difference between the GS centroid measurement from the FGS and the commanded GS position. The error is processed by the controller to generate a position command for the FSM to correct the GS position error. The fine-guide loop also implements an option to compensate for predicted differential distortions at a specific field point in SI apertures. Because the FGS only measures the GS error in two axes, roll errors about the GS position are measured and controlled by the coarse-pointing controller for that axis using the spacecraft STAs. These STAs are mounted to structure that interfaces with the base of the OTE-deployed tower assembly to minimize any roll errors and distortions between their boresight and the boresight of the OTE. The residual misalignment drifts that can occur during an observation are accounted for in the thermal distortion budgets. While fine guiding, a low-bandwidth controller is used to off-load the nonzero FSM bias. The off-load loop controller helps avoid optical differential distortions in the science image. The measured position of the FSM is sent through the FSM off-load controllers to calculate a position and rate bias command that is sent to the pointing control law to have the observatory track the near DC motion of the FSM and keep it near its null position.
The autonomous transition from coarse-pointing control, used to slew the observatory to a science target and FGC, involves a six-step process:
- 1.For a given observation, the ACS is commanded to slew the observatory to a specified location.
- 2.The FGS then uses reference stars in its FOV to Identify (ID) the GS preselected for this science visit.
- 3.The FGS then performs GS Acquisition (ACQ) by isolating a 32 × 32 pixel subarray around the identified GS and updates the observatory attitude estimate based on the measured location of the GS.
- 4.Next, the observatory is commanded to make a Small Angle Maneuver (SAM) to place the GS at a location in the FGS field that will place the desired science target correctly in the field of the active SI and another GS Acquisition happens at that location followed by an observatory attitude update.
- 5.A zero SAM is completed and the FGS then enters TRACK mode (32 × 32 pixel subarray), and the Fine Guide Control is enabled to correct any residual errors in the position of the GS after the SAM.
- 6.Finally, the FGS reduces the active subarray around the GS to 8 × 8 pixels.
For a given GS, the observatory will attempt three times to make a correct GS identification for a given GS candidate. If no identification is successful, the Observation Planning Executive (OPE) will direct the observatory to try the next GS candidate. If none are successful, the OPE will direct the observatory to skip this observation and move on to the next planned observation. The primary reasons for GS Identification or Acquisition failure are bad or hot pixels that can pose as false reference stars and errors in the Guide Star Catalog that may list an unsuitable object such as a double or variable star or galaxy as a GS. To mitigate these, "Hot Pixel" maps are routinely uploaded to the observatory to keep track of these features, and the Guide Star Catalog is updated when such errors are found.
Pointing control capabilities includes tracking of moving targets (MT) for science observations. This is motivated by a desire to observe planets, asteroids, comets, and other Kuiper Belt Objects (KBOs), planetary satellites and rings, as well as surface features of planets and planetary satellites. Moving target-pointing capability is established based on the existing fine-pointing architecture. It is accomplished by updating the guide-star-commanded position and observatory attitude command based on the specified guide star ephemeris. MT tracking follows a specified guide star ephemeris such that the MT appears fixed within the SI's field of view. Depending on the specified ephemeris, MT control logic determines the time and position (along the ephemeris) the observatory can commence MT tracking.
4.5.3. Vibration Management
Jitter suppression on the JWST is achieved through passive isolation of the entire OTE from the spacecraft-bus-located vibration sources (six RWAs and the MIRI cryocooler). Passive isolation relies on the concept of vibration transmissibility whereby a soft suspension system, having a low resonant frequency, attenuates the much higher vibration frequencies of the vibration sources. With low-frequency isolation between the telescope and the vibration sources, the optics see very little vibration. This concept, along with thorough characterization and modeling of jitter "sneak paths," very precisely designed "quiet" reaction wheels and cryocooler, and judiciously placed Magnetic Tuned Mass Dampers (MTMDs) has allowed JWST to achieve operational LOS jitter in the 1–2 mas regime.
The overall passive isolation design includes four main components: (1) the main isolator—the 1 Hz IA (Isolator Assembly), which connects the OTE to the spacecraft bus, (2) direct isolation of the reaction wheels (the RWIA, Reaction Wheel Isolator Assembly), (3) isolation of the cryocooler designed into the heat pipe suspension system, and (4) attenuation of vibration along the cryocooler cooling lines with the Cryocooler Jitter Attenuation Assembly (CJAA) and specially designed cooling line mounts.
The IA, shown in Figure 18, forms the main isolation system on JWST. It consists of four composite fiber tubes with constrained layer damping, arranged in an "X" pattern, connecting the relatively stiff corners at the top of the spacecraft bus to the base of the telescoping tower that supports the OTE. The stiffness of these tubes is such that they produce a 1 Hz "bounce mode" of the OTE relative to the spacecraft. With such a low frequency, higher-frequency vibrations from the reaction wheels and cryocooler are attenuated before reaching the optics. Note that JWST is necessarily launched with the very soft isolation system "short-circuited" by four launch locks connecting the OTE to the spacecraft. It could not be otherwise, as even the 1 g ground loads would destroy the soft IA.

Figure 18. JWST isolator assembly (IA).
Download figure:
Standard image High-resolution imageThe RWIA is a proprietary Northrop Grumman design that relies on passive isolation, providing a "dual stage" isolation of the reaction wheels on a soft spring damper.
The cryocooler assembly, like the reaction wheels, are dual-stage isolated but, in this case, with a soft mounting structure designed into the cooler supports. The cryocooler pumps are mounted to a support plate that collects rejected heat and passes it off to space via radiator panels. These panels are connected to the cryocooler support plate with 12 tubular "heat pipes." These pipes, in addition to carrying excess heat away, serve as a soft suspension system for the cooler—a second stage of isolation for the cooler vibrations.
Finally, there is the problem of the cooling line itself, which runs directly from the cryocooler into the telescope optics. The initial design of the cooling line, a coiled section resembling a spring, was nicknamed "the slinky." Besides being shaped to allow the deployment of the telescoping tubular section holding the telescope, the slinky's coiled shape also provided some amount of springiness and presumably some isolation. However, as our models matured and the cooling line was modeled in greater detail, our models began to show large jitter contributions from the cooling lines. The solution was the introduction of more passive isolation. The CJAA is essentially a rigid mass attached to the cooling line and held by preloaded Vectran support chords. Like other JWST isolation systems, the six resonant modes of the CJAA were tuned to a low frequency, between 3 and 6 Hz, which attenuated the cooler vibration at around 30 Hz.
Each of these low-frequency isolation systems needed to be "launch locked" until JWST was on its way to L2. The only exception was the RWIA. Instead of a system that required six (or more) additional release devices, the RWIA was precisely centered between "bumpers," which reacted to the launch loads. Once on orbit, the RWIA naturally achieved an equilibrium position centered between the bumpers with operational loads so that that future bumper contact does not occur.
Another jitter suppression feature on JWST is the MTMDs, attached to the SMSS. Because of the required size of the SMSS, it was not possible to design the SMSS to be stiff enough that it would benefit from low-frequency isolation. And so, specialized MTMDs were judiciously attached to each of the three SMSS support struts. An MTMD uses magnetism to apply damping that is effective at the very cold temperatures on the shade side of the sunshield. The principle of a tuned mass damper is to tune the spring-mass system to lie directly on top of the resonant frequency of the underlying structure. When the structure and the dampers are combined, the two matching frequencies combine into two new resonances slightly separated in frequency but with each of the two new modes considerably damped. This damping is of great importance to the OTE as a whole, since damping is so very low at cryogenic temperatures and these SMSS resonances are too low to be helped by the passive isolation elsewhere.
In addition to design features, there are also operational options to minimize imported vibrations from the cryocooler. Changing operation speed changes the frequency of vibration and offers the opportunity for avoiding cryocooler-related jitter. The cooler could be tuned to operate between 29.5 and 31.5 Hz with 69 available speeds at which to operate for the JT cooler and 41 for the JT. The plan during JWST commissioning was to measure the actual LOS Jitter with the cooler operating at its initially chosen speed, 30.4878 Hz. NIRCam was fixed to a single point source and used to measure an 8 × 8 "postage stamp" time history of the focal plane "jitter." Once a baseline had been established, the plan was to vary the JT compressor speed across a range of frequencies in the 29.5–31.5 Hz region. Our predictions suggested that at least an order of magnitude reduction in LOS jitter was possible should our initial operating frequency prove to be problematic.
5. JWST Verification
Verification is the process of proving the "as-built" item complies with its requirements prior to its launch. The most reliable method of verification tests the completely integrated observatory in environments similar if not identical to or more stressing than those encountered in its operation. Such tests usually involve a series of vibration and acoustics tests to simulate the launch environment followed by performance tests of the observatory in its flight configuration in thermal vacuum chambers to simulate the space environments. This program adheres to the so-called "Test as You Fly" approach. Such a program for JWST was impractical if not impossible due not only to its size relative to existing test facilities, but also the range of thermal environments that exist in its operational configuration. Certain surfaces on the sunward side of the observatory operate at temperatures of 400 K while those on the side operate at temperatures 55 K or below. Existing thermal vacuum chambers could not be modified to provide such an environment for the deployed observatory especially given the mechanical ground support equipment (MGSE) necessary to off-load gravity for the fully deployed observatory.
The verification program is therefore a combination of tests and analyses. Environmental and performance tests were performed at the element levels of the observatory to validate their analytic models. These models are then integrated into observatory models that are ultimately used to predict and verify post-launch on-orbit performance. There are two general risks associated with this approach:
- 1.Analyses cannot accurately model any workshop errors associated with the final level of integration,
- 2.Analytical models can miss unexpected behaviors at the element–element interfaces.
These risks were addressed by conducting observatory-level tests that were not geared to proving performance but rather that the interface behavior was within expected bounds and that workmanship was correct.
It should also be noted that tracking of requirements verification for a first of a kind Class A flagship like JWST was in itself a daunting effort. The overall verification of the JWST Observatory follows industry and NASA standards of assessing requirements compliance via a combination of Inspection, Analysis, Demonstration, and Test. For JWST, this equated to 6893 requirements down to the element-specification and interface level and when accounting for lower-level requirements (such as element boxes), the total number of requirements verified for JWST was in excess of 35,000.
5.1. The JWST Integration and Test Program
The final JWST verification program leverages the Integration & Test (I&T) program of the environmental and performance testing of the Spacecraft Element (Spacecraft and Sunshield), and OTE and ISIM (OTIS) to validate their analytical models. The OTIS models were then integrated to the Spacecraft Element models to verify observatory performance. The I&T program also serves to prove workmanship. This test program is illustrated in Figure 19.
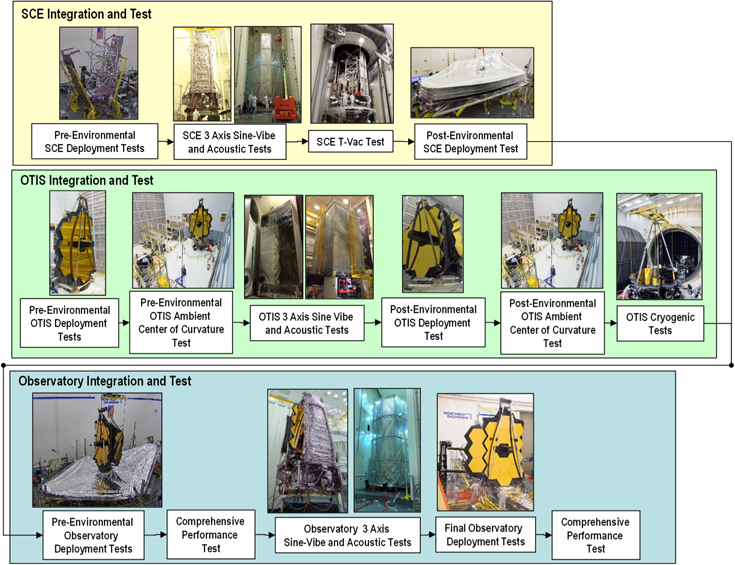
Figure 19. Final I&T program for JWST.
Download figure:
Standard image High-resolution imageThe SCE I&T starts with the pre-environmental deployment tests of the sunshield and spacecraft deployable components. The spacecraft and sunshield were then restowed to their launch configuration, and sine vibration and acoustic tests were conducted followed by thermal vacuum (T-Vac) testing to simulate the operational environments. Performance tests of the spacecraft bus electrical systems were conducted in these environments. Following this T-Vac test, the spacecraft deployment tests were repeated.
OTIS I&T starts in a similar way, with a series of pre-environmental deployment tests. Ambient optical tests of the deployed primary mirror were then conducted using a Center of Curvature (CoC) high-speed interferometer. The OTE optics were not figured to work at ambient temperatures but rather at their operational cryogenic temperatures, so this ambient CoC test was not intended to measure operational performance. Instead, the test was intended to measure changes to optical figures pre- and post-environmental exposure, so it was repeated after the OTIS sine-vibe and acoustics tests and the post-environmental deployments. Following these, the OTIS was shipped to JSC for its cryogenic tests, which included optical alignment and performance tests, as well as functional electrical tests.
After the successful completion of this cryogenic testing, the OTIS was shipped to Northrop Grumman, where it was integrated to the SCE for the start of the observatory I&T. This effort began with pre-environmental deployment tests. In this deployed configuration, a full comprehensive performance test (CPT) of the now-integrated observatory electrical subsystems was performed, followed by the final observatory sine-vibe and acoustics tests. Following these exposures, the final deployment tests were conducted as well as the final full CPT.
The verification program that leveraged this I&T flow can be partitioned into the following discipline "threads" or themes:
- 1.Launch survivability
- 2.Deployments
- 3.Thermal performance
- 4.Deployed structural and thermal stability
- 5.Optical performance.
Summaries of these discipline threads are described in the following sections.
5.2. Launch Survivability Verification
The verification that the observatory could survive launcher environments without changes that degrade final on-orbit performance consisted of (beyond the strength test of the primary structure) a series of sinusoidal vibration (sine-vibe) tests, acoustics tests and mechanical shock tests conducted at various levels of assembly, culminating in the OTIS, SCE, and observatory-level tests. The OTIS sine-vibe and acoustics tests were conducted at GSFC before it was sent to the Johnson Space Center (JSC) for cryogenic performance testing.
Sine-vibe tests subject observatory hardware to sinusoidal excitation in each of three orthogonal axes at frequencies from 5 to 100 Hz. This low-frequency range can excite relatively large deflections. The test sweeps through these frequencies at a rate of 4 octaves per minute and measures the acceleration response of the structural members. This test serves to prove the following:
- 1.The strength and or stiffness of key structural members is high enough to preclude damage or distortions.
- 2.The structural responses are consistent with predictions from the structural models.
- 3.When performed at subsequent levels of assembly, the tests serve to prove that there was no change to the structural response frequency that would be indicative of workmanship inconsistencies.
Since the actual vibration spectrum of most launchers is concentrated around a number or frequency peaks that are dependent on actual flight events (such as lift-off twang, motor pulsation, etc.), sine-vibe test specifications envelope these and thus can be more stressing and therefore require very special attention to ensure their excitation levels envelope flight levels with margin but not produce responses higher than flight at critical elements or components due to their specific structural resonances. To avoid this, detailed analyses were conducted to determine these individual frequencies and structural responses. Test levels at such frequencies are lowered or "notched" to avoid such responses above a factor times the flight level. As a safety measure, sine-vibe test input levels are progressively raised, and responses measured to make sure they are consistent with these sine-vibe model predictions before implementing the final levels.
Acoustics tests subject the hardware to sound pressure levels (higher frequency) produced by the launcher, particularly during the first few seconds after engine ignition, lift off, and when passing Mach 1. The tests prove hardware resilience to these levels, particularly for small mechanisms and components that could have higher susceptibility or for the exposed primary mirror segments that had the potential for significant responses to these levels due to their large surface area and low mass. The acoustic test levels for JWST had to be carefully determined to ensure they enveloped those levels experienced during launch (with margin) but did not overstress critical components. This was especially the case for the NIRSpec microshutter array, which required very special considerations for acoustic levels above the highest octave normally controlled for an acoustic test, 2 KHz.
5.3. Deployment Verification
Verification of JWST deployments was accomplished primarily via tests to demonstrate the successful release, full range of motion without snagging, or interference and latching into the final position to the specified accuracy of the specific deployable member. Deployment testing of the OTE optical elements had proved the final configuration had the alignments within the range necessary to begin the wave-front sensing and control operations, as well as the latching preload to ensure the dynamic stability of the optical elements. Figure 20 shows the deployment testing of the OTE SMSS and the deployment of the OTE wing assembly. Note that the design of the MGSE used to off-load these structures in 1 G dictated that the deployment tests could only be performed in certain orientations. The SMSS deployment had to be conducted with the OTE lying on its side, while the wing deployment, also shown in Figure 20, had to be performed with the OTE standing upright.

Figure 20. OTE deployment tests.
Download figure:
Standard image High-resolution imageDeployment testing of the sunshield members had to demonstrate the correct control and management of the large flexible membranes during their unfolding and that the membranes assumed the correct shape after tensioning. Unlike rigid structural members, the sunshield layers could not be effectively off-loaded for gravity and so the deployed shape for a nominal membrane in 1 G was predicted using analytic models, and the measured shape compared to those predictions. Figure 21 shows the deployed sunshield.

Figure 21. Sunshield deployment test.
Download figure:
Standard image High-resolution imageBecause of its size and off-loader constraints, the final observatory-level deployment tests shown in Figure 22 had to be conducted with the OTE in the upright configuration. Therefore, the full SMSS deployment could not be tested in these final tests; however, a "flinch" test was conducted to show the initial deployment motion without the release of the SMSS launch release mechanisms.

Figure 22. Final deployment test of the JWST observatory.
Download figure:
Standard image High-resolution imageKey deployment telemetry was monitored during these tests. These include deployment time durations, motor currents, and force loads. Kinematic models were developed to predict these metrics in a 1 G and 0 G environment. On-orbit deployment telemetries indicated deploying performance was at or near predictions and ground-test performances. Deployment telemetry comparison with prediction and ground-test data is shown in Table 5. Figure 23 shows the predicted and actual motor current versus time for the deployment of the forward and aft Unitized Pallet Structures. Figure 24 shows the predicted and actual motor current versus deployed distance for the Mid Boom Assemblies. Both figures show the excellent agreement between predictions and on-orbit measurements.
Table 5. Major Structural Deployment Performance Comparison
| Deployment System | Preflight Prediction | Ground Test | On Orbit |
|---|---|---|---|
| Solar Array | 37–53 s | 42 s | 39 s |
| Unitized Pallet Structure (Fwd., Aft) | See Figure 23 | ||
| Deployed Tower Assembly | 60–100 lbf (267–444N) | 60 lbf(267 N) | 64 lbf (285 N) |
| Primary Mirror Backplane Assembly Wings (+J2, −J2) | 232 mA, 232 mA | 231 mA, 300 mA | 180 mA, 250 mA |
| Secondary Mirror Structure Subsystem | 300 mA | 460 mA | 190 mA |
| Mid-Boom Assembly (+J2, −J2) | See Figure 24 | ||
| Membrane Tensioning Subsystem (Mid, Fwd, Aft) | (1160, 365, 335) mA (max) | ⋯ | ∼1% of Prediction |
| Aft Flap | 25–30 s | ⋯ | ∼30 s |
Download table as: ASCIITypeset image
There were two considerations that needed to be carefully factored into the deployment verification program. First, each full deployment test of the sunshield put wear and tear into the membranes that could present on-orbit performance degradations. Allocations for the degradations due to testing were established, but the number of full deployment tests had to carefully considered to keep the wear within these allocations.
Second, the deployment of the observatory involved 178 LRMs, all of which had to be reset after the final test and all were single-point failure items for the mission. In a sense, the deployment is much like a parachute, where its ultimate success is dependent on the workmanship of the final stowage, which cannot be tested prior to the final release. In light of this, Mission Systems Engineering and Mission Assurance paid particular attention to the workmanship of the final LRM reset operations. Additional mandatory inspection points were added into the stowage flows, and additional video and photographic records of the operations were generated and reviewed for each reset as described in Kalia et al. (2023).

Figure 23. UPS deployment motor current, flight telemetry, and prediction.
Download figure:
Standard image High-resolution image
Figure 24. MBA deployment motor current, flight telemetry, and prediction.
Download figure:
Standard image High-resolution image5.4. Thermal Verification
The thermal verification, as illustrated in Figure 25, included demonstration models, flight-like engineering models, and engineering test units (ETUs), all of which validated the analytic observatory thermal models.

Figure 25. JWST thermal verification program.
Download figure:
Standard image High-resolution imageThe first of these tests was a thermal vacuum test of a one-third scale model of the sunshield, which validated the flight model. A test of a full-scale engineering unit or of the flight sunshield would not provide accurate data given the excessive sunshield to chamber volume ratios (fill factors) these would present to the available thermal vacuum chambers. Thermal back-loading from the chamber walls in such configurations makes the validation of thermal models of the sunshield in a free space environment very difficult and unreliable. A one-third scale test offered a good compromise between the scaling of radiative and conductive sunshield modeling parameters, which scale differently with size, and a small-enough chamber fill factor to provide reliable model validation data.
The next critical tests were two thermal vacuum tests of a full-scale engineering model of the "Core" region of the observatory, the region between the lower base of the OTIS and the top of the spacecraft. As illustrated in the heat flow diagram of the observatory shown in Figure 14, this area contains many of the most critical thermal leak paths between the warm spacecraft and the cryogenic OTIS, and includes the room temperature IEC. The Core 1 Test characterized a full-scale demonstrator model of this region, and the Core 2 Test characterized a high-fidelity ETU. This Core 2 Test validated the observatory thermal model's detailed representation of these critical conductive and radiative heat flows.
A precursor to the Core 2 Test was a test of an engineering model of the IEC thermal radiator reflectors to confirm the directionality of their heat dissipation.
The flight elements of the observatory were thermally tested in three test configurations. The first was the cryogenic test of the ISIM conducted in the GSFC Space Environment Simulator chamber, which validated the ISIM thermal model. After this test, the ISIM was integrated to the OTE and combined OTIS was shipped to JSC for cryogenic testing in its modified Chamber A facility. This cryogenic test validated the OTIS thermal model. Finally, the SCE was thermally tested in the NG M4 Thermal Vac chamber to validate the SCE thermal model. The SCE was tested in its stowed configuration in order to fit in this chamber.
The thermal test program yielded validated thermal models of the SCE and the OTIS, which were integrated together into an observatory model used for the final verification of the observatory thermal performance.
5.5. Pointing Control and Line-of-sight Stability Verification
The verification of the line of stability was a complex combination of a multitude of performance and characterization tests, conducted mostly at the component or assembly levels that informed and/or correlated the element structural dynamic models, which are then integrated into the system's structural dynamics model for the final performance predictions. The flow diagram for this process is shown in Figure 26.

Figure 26. Verification of JWST jitter performance.
Download figure:
Standard image High-resolution imageThe tests that informed these models fall into the following categories:
- 1.Tests to characterize the disturbance outputs from assemblies such as the RWAs or cryocooler. These are often microdisturbance tests due to the very low output of these units.
- 2.Transmissibility tests to characterize the transmission properties of interfaces such as harnesses or cooling lines to transmit vibration disturbances.
- 3.Damping tests to characterize the damping properties of a device such as passive isolators or a Mag Tuned Mass Damper.
- 4.Stiffness tests to characterize the stiffness of a structural interface or component.
- 5.Structural modal tests, where electrodynamic shakers are used to excite and measure the predicted structural resonances.
Many of the modal tests for cryogenic elements had to be conducted at room temperature due to the size and/or complexity of the test precluding doing the test under cryogenic conditions. However, structural dynamic properties can be drastically different under cryogenic conditions, in particular stiffness and damping. Therefore, additional risk mitigation testing was conducted to understand or bound these differences. A significant effort toward this end was the cryogenic testing of a full-scale ETU of a portion of the composite PMBA, called the Backplane Stability Test Article (BSTA). The BSTA was subjected to cryogenic testing to determine the shift in frequency (a.k.a. stiffness) and damping of the unit from their values at room temperature. In particular, BSTA characterized not only the composite structural members but their bonded joints.
In addition to the structural verification shown in Figure 26, more conventional testing and analysis were performed on the ACS and fine guidance control loops to verify their accuracy. This analysis also included thermal distortion analysis between the STA and the OTE to account for roll errors.
5.6. Optical Verification
The optical verification of JWST for image quality and stray light was also a combination of systems-level analyses informed and/or validated by lower-level tests. The details of the optical test program are described in McElwain et al. (2023). The final test of the JWST optical verification program was conducted at the Johnson Space Center's Chamber A facility, which was modified to provide the necessary cryogenic environment. This facility is shown in Figure 27.

Figure 27. JWST OTIS in the JSC Chamber A Facility.
Download figure:
Standard image High-resolution imageThe cryogenic tests verified that following deployment, the segmented primary mirror could be aligned and phased, that the full optical system (OTE and ISIM) had the correct prescription and alignment, and that the full system behaved as expected to changing thermal gradients. Data from these tests were input into as-built cryo-optical models and combined with the pre-OTIS alignment data and pre-OTIS optical figure data and fed into an Integrated Telescope Model, which combined the optics data with predicts for on-orbit thermal distortion, dynamics modeling, structural modeling, and ACS simulations to yield the predicts for OTE WFE, Strehl ratio, and EE.
The actual temperature gradient changes expected on orbit were too small to be accurately emulated by the JSC facility, so this test was essentially an overdrive test, which subjected the system to larger gradient changes to determine if the system's analytical model predictions were correct. In a sense, this was a workmanship test and one that bore fruit. The initial tests determined two areas where test results were inconsistent with the model predictions.
First optical distortions were discovered, which were correlated to the heater duty cycles of the IEC. Investigations found that the majority of this effect was due to the test configuration itself, which allowed distortion stress paths that would not be present in the flight configuration. However, it did force the team to pay attention to this as a potential distortion effect and prepare contingency procedures for IEC heater operations.
The second distortion was found to be caused by stress transmitted by the light weight OTE frill, which cooled off much faster than the more massive OTE primary mirror structure. Areas of the frill were found to not have the proper amount of slack to compensate for the differential thermal expansion and contraction and were becoming taut imparting stress to the PM. These sections were reworked to include extra slack.
6. Observatory On-orbit Performance
The JWST observatory was successfully launched on 2021 December 25. All MCC maneuvers were completed on time and by 2022 January 8, 14 days after launch, all deployments were successfully completed, with only minor anomalies that were quickly resolved and resulted in no impact to science operations. The observatory successfully cooled down to operational temperatures and all commissioning activities were completed on schedule. These activities measured the science performance of the observatory to prove it was ready for science operations, which commenced on 2022 July 12, with the release of the first Early Release Observations. The following sections describe the observatory-level performance most relevant to science. Performance metrics such as radiometric sensitivity and stray-light performance are addressed in Rigby et al. (2023a and 2023b).
6.1. Thermal Performance
The observatory has successfully completed all thermal activities associated with Launch, Deployment, Cool down, and OTE/SI Commissioning. All required heaters are functional on the A side (i.e., redundancy is intact) and demonstrate expected load duty cycles with healthy margin. Only one temperature sensor failed (located on the SMSS Inboard Hinge pin) during the 180 days process and that sensor was only used for deployment of the SMSS. No violation of critical temperature limits occurred, and all limits and constraints were respected. This includes the planned execution of cool-down profiles of critical components to avoid water migration from relatively "hot" items to "cold" items that are sensitive to such deposition.
Final temperatures of the center section segments of the PM are 1–6 K warmer than prelaunch predictions, with the largest variation occurring on segments nearest the sunshield. Wing mirror segments are very similar to predictions, slightly cooler. The secondary mirror is nearly 5 K cooler than predictions. These deviations are believed to be partially due to uncertainties in electrical harness heat transfer behavior. This is particularly the case for the SM, where it is believed conduction via the electrical harness may have been overestimated for the sake of conservatism. These temperatures are still under the required temperatures for both image quality and MIR stray-light performance. Figure 28 illustrates the predicted and measured temperature map for the PM and SM.

Figure 28. Measured and predicted PM and SM temperatures.
Download figure:
Standard image High-resolution imageAll SIs have been cooled to within their required operating ranges. Additionally, each has been fine-tuned using trim heaters to match the desired target temperature within that required range as requested by the SI teams. Table 6 shows the SI temperatures relative to their preflight targets and the trim heater values. The trim heater settings matched the level predicted and were very similar to those required during the OTIS cryovac test.
Table 6. NIR Science Instrument Temperatures
| Instrument | Predicted Temperature (K) | Measured Flight Temperature (K) | Trim Heater Setting (mW) | Predicted Radiator Temperature (K) | Measured Flight Radiator Temperature (K) |
|---|---|---|---|---|---|
| NIRSpec Optics Assembly | 35.5 | 35.57 | 10 | 34.8 | 34.5 |
| NIRSpec Focal Plane Assembly | 42.8 | 42.80 | 8 | 40.9 | 40.7 |
| Fine Guidance Sensor | 38.5 | 38.48 | 4 | 37.4 | 37.2 |
| NIRCam | 38.5 | 38.52 | 14 | 37.0 | 37.1 |
Download table as: ASCIITypeset image
The final operational temperatures of the five SI radiators settled into values that are extremely close to prelaunch predictions as shown in Table 6. Given that the temperatures of the instruments also matched well with predictions, it can be concluded that the heat straps connecting the two are functioning as designed. Additionally, because the radiator temperatures and SI trim heater settings are as expected, this is a very strong indication that the parasitic loads affecting the ISIM element are also as expected, and the prelaunch radiator heat lift margin, which was predicted to be 80% or higher, has been maintained.
The cryocooler successfully cooled MIRI to steady-state operating temperatures roughly 3 months after launch. The cool-down included a thoroughly planned sequence of transitions to different operating states on the JT and pule tube (PT) cryocoolers to achieve the final operating temperature of the cryocooler at 5.9 K with the MIRI detectors at 6.4 K. The average heat load on the cooler, including direct and parasitic heat, was measured at approximately 119 mW, very close to the prelaunch prediction of 124 mW. A significant performance margin is available should there be any growth.
The temperature stability of the OTE and SIs, which is paramount for optical stability, has been measured to be well within limits. As was discussed in Section 5.6, the IEC temperature cycling presented a potential transient threat to the distortion of the OTE optical system. In-flight duty cycling of the IEC heaters has shown that the temperature stability was as designed and has had negligible impact on the OTE optical stability.
SI temperature stability has also been measured to be excellent. SI temperatures over a 30 day period, taken in the final month of commissioning, have shown variations of no more than 25 mK about their means. It should also be noted that during this time, instrument teams were often exercising their instruments in modes and durations that may not be commensurate with typical flight operations, particularly true for the NIRSpec, which was operating the high-dissipation Multi-Shutter Array (MSA). This means that stability following commissioning should be better than shown.
Accurate determination of the temperature stability of the mirror and other OTE components is not possible since housekeeping sensors and readout were not designed for low-noise fine measurement. All that can be concluded is that temperature stability is within the noise of those sensors (200 mK). Looking at the last two months of the commissioning and taking the measurements as-is statistically, the standard deviation is about 40 mK. There was no perceivable drift in the average temperature over that two-month period.
An exercise was performed over the period of May 6 (MET 132 days) and May 18 (MET 145 days) to characterize the impact of a worst-case attitude change on optical performance. The observatory was held for 7 days in a "hot" thermal attitude (∼0° pitch) where it would soak to its steady-state condition, then it was slewed to a "cold" thermal attitude (−40° pitch) where it would remain for nearly 14 days. During this period extensive optical measurements would be taken to quantify the observational change and there was no apparent change in temperatures of the OTE or ISIM. However, for the OTE, temperature sensors were not designed for low-noise fine measurement so any change less than 200 mK would likely go undetected. This was predicted for a stable system and that any change would have to be determined using the much more sensitive optical measurements. Figures 29 and 30 plot temperature measurements taken during this exercise. Note: In the case of the SI temperatures, the variations observed coincide with instrument activities and are not caused by the change in attitude.

Figure 29. SI stability during hot/cold slew.
Download figure:
Standard image High-resolution image
Figure 30. OTE stability during hot/cold Slew.
Download figure:
Standard image High-resolution image6.2. Pointing Control Performance
JWST pointing control has performed much better than required, substantially closer to nominal preflight predictions. In terms of coarse pointing, pointing accuracy and stability are the drivers for guide-star identification and acquisition. Figure 31 illustrates the typical histogram of pointing errors at guide-star identification. These are the errors between measured guider identification centroids and command ID positions. The typical error is well within the requirement of 8'' (1σ). Also, a very high success rate for guide-star identification and acquisition is a clear indication that pointing stability is well within its requirement of 4'' during a 160 s period.

Figure 31. Typical histogram of pointing errors at guide-star identification.
Download figure:
Standard image High-resolution imageFigure 32 shows a typical histogram of pointing errors, commanded position versus measured, for FGS track centroids at the transition into guiding. As observed, the errors are generally well within a track box of 32 × 32 pixels (2200 × 2200 mas), with around 90% within 140 mas of commanded GS position.

Figure 32. Typical histogram of pointing errors at transition to track mode.
Download figure:
Standard image High-resolution imageImage motion is one of the critical performance metrics for pointing control. It is a measure of pointing stability of science image while in fine guiding. A significant portion of the 6.6–7.4 mas (1σ) budget is allocated to the image motion within the fine-guide bandwidth. Figure 33 illustrates the noise equivalent angle (NEA) of fine guidance sensor 1, along the X-axis. The performance along the Y-axis is similar. This shows the measured rms of the centroids while in fine guiding, with the guider in fine-guide mode, for various guide-star intensities (count rates). The figure clearly shows that the rms of the image motion within the fine-guide bandwidth is well within the requirement of 4.0–4.2 mas, and it remains below 2 mas for a wide range of guide-star intensities. The figure also confirms that the guider's performance is better than its NEA requirements of 4 mas. It should be pointed out that the few outliers in the plot are due to bad pixels or count-rate variations. In fact, the NEA may vary by as much as 0.3 mas for the same guide star at different positions in the detector.

Figure 33. Guider noise equivalent angle (X-axis).
Download figure:
Standard image High-resolution imageImage motion performance was further evaluated via NIRCam observations, wherein 8 × 8 postage stamp subarrays were read every 2.2 ms. Although the motivation behind the NIRCam readouts was mainly for observatory jitter assessment, the main contributors to image motion turned out to be within the fine-guide bandwidth, including pointing control, fuel slosh response, and 1 Hz isolator mode at around 0.3 Hz. Figure 34 shows the histograms of image motion analysis of NIRCam data for both axes. It clearly corroborates image motion performance predictions, based on the guider data.
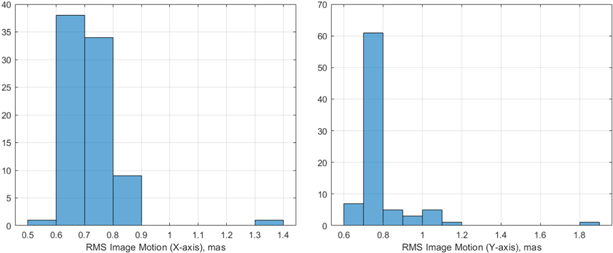
Figure 34. Image motion from NIRCam postage stamp data.
Download figure:
Standard image High-resolution imageMoving target capability was also demonstrated for targets with a wide range of apparent motion, covering 5–67 mas s−1. Figure 35 illustrates the track of the guide star during a moving target observation of the main-belt asteroid 6418 Tenzing, 4.5 km diameter, 2.4 au orbit, with an apparent rate of ∼5 mas s−1. The observation included a number of offsets and dithers, as seen in the figure. Guide-star stability and NEA remained well below 6 mas for the range of moving targets (5–67 mas s−1).
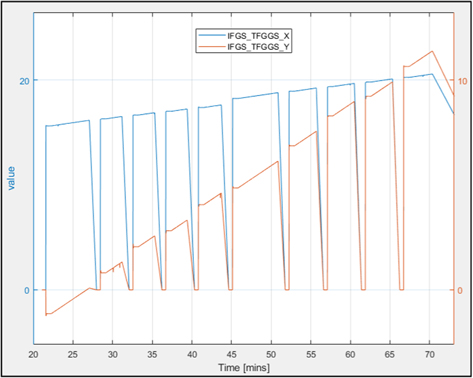
Figure 35. Guide-star tracks for moving target observation of asteroid Tenzing.
Download figure:
Standard image High-resolution imageFine guidance-pointing accuracy, which represents the accuracy of placing a target in a science instrument FOV while guiding, was also assessed during nominal commissioning activities and found to be well below the requirement of 1'' (1σ, radial). Figure 36 illustrated target positioning accuracy in NIRISS after 18 guide-star acquisitions, with guider 1 or 2. The rms radial error computes to 0148. Moreover, the rms drops to below 012 if the single outlier (likely due to catalog error) is dropped. The accuracy can potentially benefit further from additional astrometric calibrations of the science instruments.

Figure 36. Target positioning accuracy for NIRISS.
Download figure:
Standard image High-resolution imageFinally, the accuracy of offsets and dithers was evaluated during commissioning and found to be well within requirements. A typical performance is illustrated in Figure 37 for 149 NIRISS dithers/offsets, with various filters, G1 and G2, ranging from 0'' to 07. The computed rms errors are 3.7 mas (X), 2.9 mas (Y) versus a requirement of 7 mas (1σ, per axis).

Figure 37. NIRISS dithers and offsets.
Download figure:
Standard image High-resolution image6.3. Image Motion "Jitter" Stability
As part of the periodic WFE sensing activities conducted during commissioning, centroids of the star PSF were sampled every 2.2 ms to measure the Line of Sight "jitter" of the observatory. This produced a scatter plot as shown in Figure 38, where each dot represents the location of a PSF centroid sample. These scattered measurements have shown the observatory LOS jitter performance is currently at 1.1 mas, roughly six times better than allocated as part of the WFE budget. This low level of jitter allowed the operations to waiver the tuning of the MIRI cryocooler speed. Such tuning will be considered if or when the observed jitter levels, which are routinely measured, increase to levels above 2.8 mas.

Figure 38. Example LOS jitter measurement from JWST commissioning.
Download figure:
Standard image High-resolution image6.4. Thermal Distortion
The commissioning activities include tests to quantify the WFE due to thermal distortion resulting from a hot-to-cold slew of the observatory. The observatory structural model was used in an on-orbit commissioning analysis to predict the telescope WFE for this planned on-orbit thermal stability test with beginning-of-life (BOL) thermal properties. The results of this analysis is shown in Figure 39, which also the projected End of Life (EOL) OTE thermal distortion WFE. This flight test subjected the telescope to a representative worst-case slew from a 0° pitch in the hot attitude to a −40° pitch in the cold attitude. Originally, the plan was to measure the drifts over 14 days, but the test was reduced to 8 days when it was revealed that the WFE drift-time constant was significantly shorter than originally predicted, approximately 34 hr for figure drift. This discrepancy with the prelaunch prediction was not surprising since the thermal transient model had not been validated prior to launch, due to the complexity such a test presents, nor did the shorter time constants pose an impact to the mission.

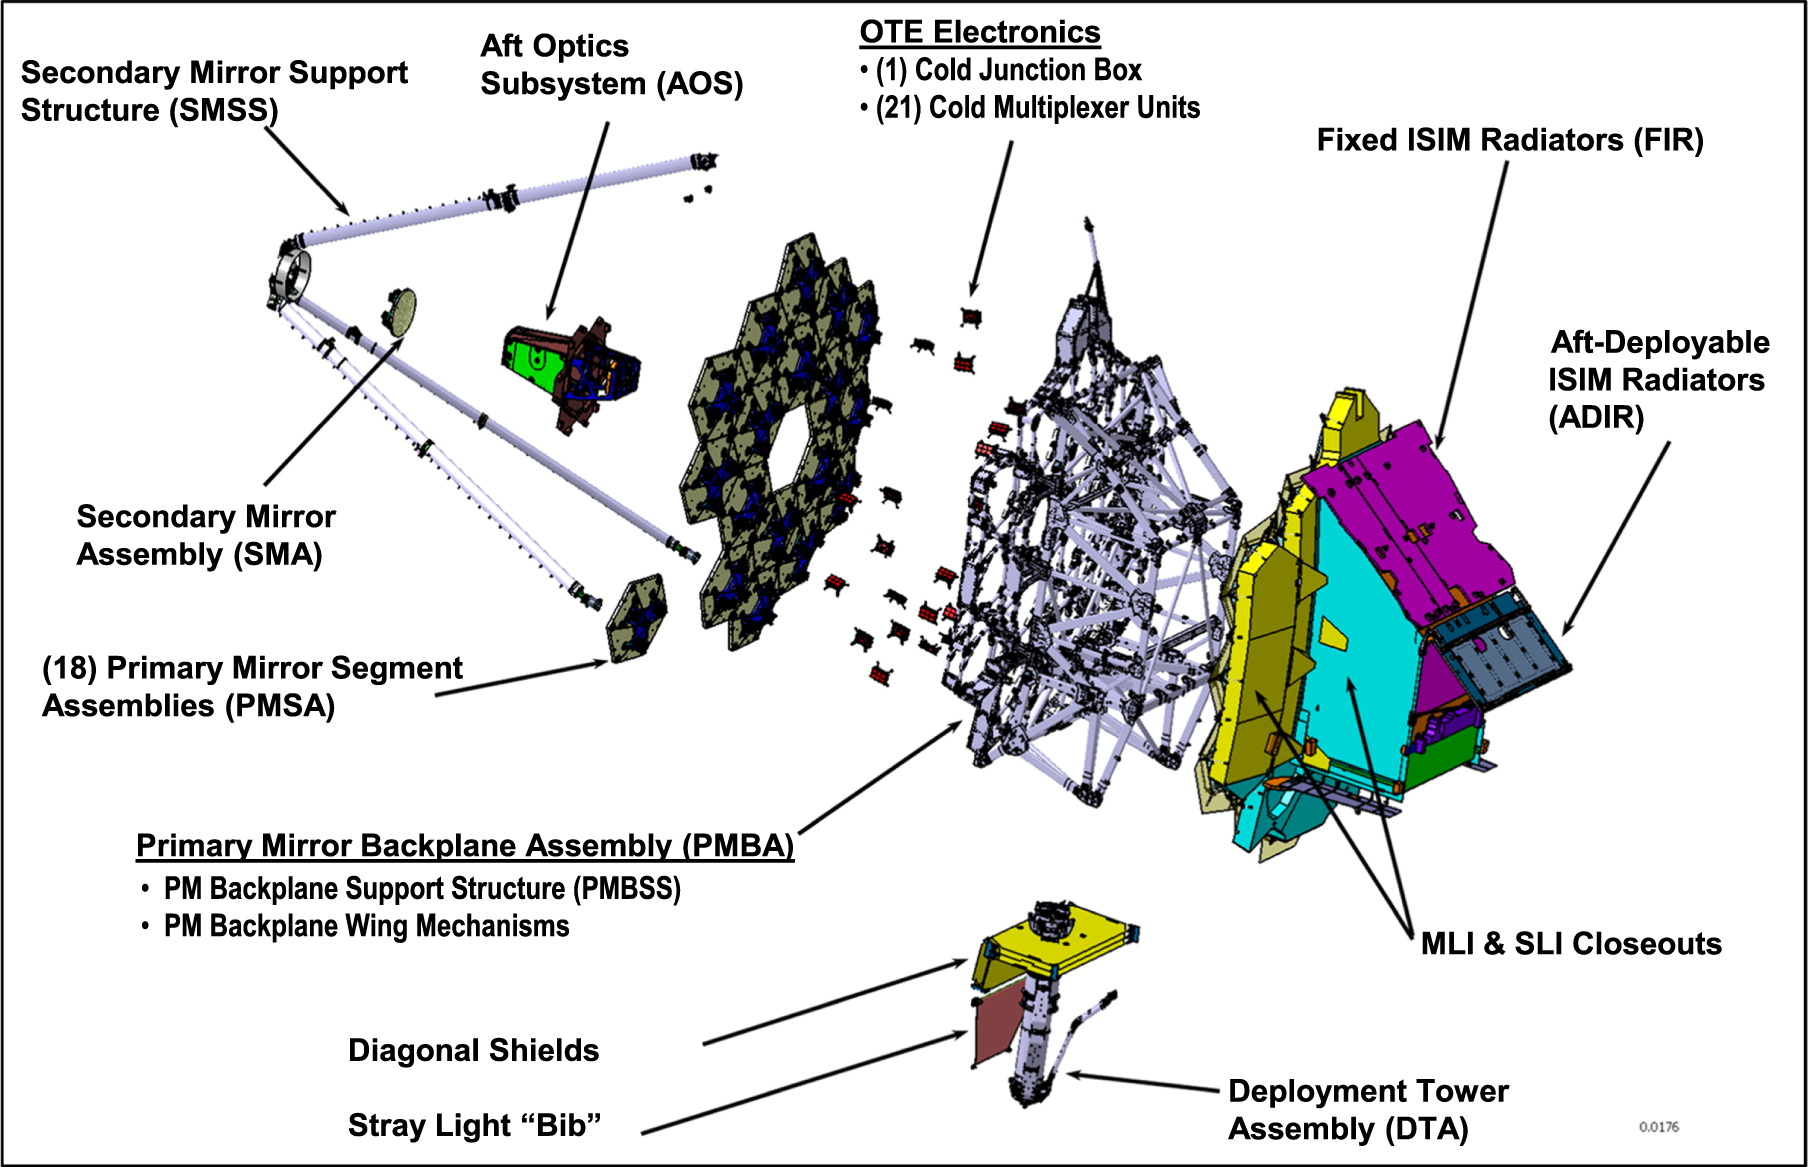
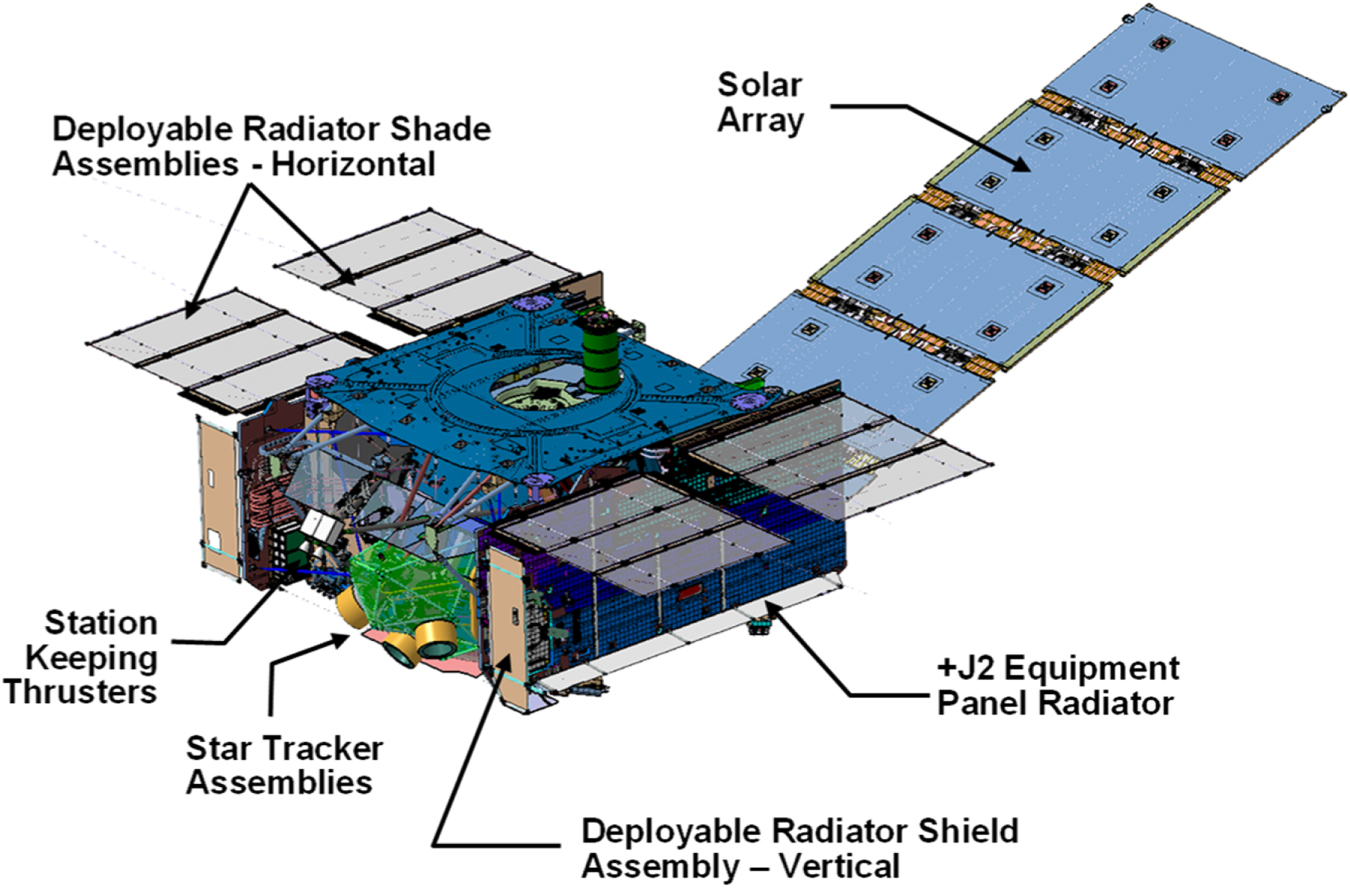
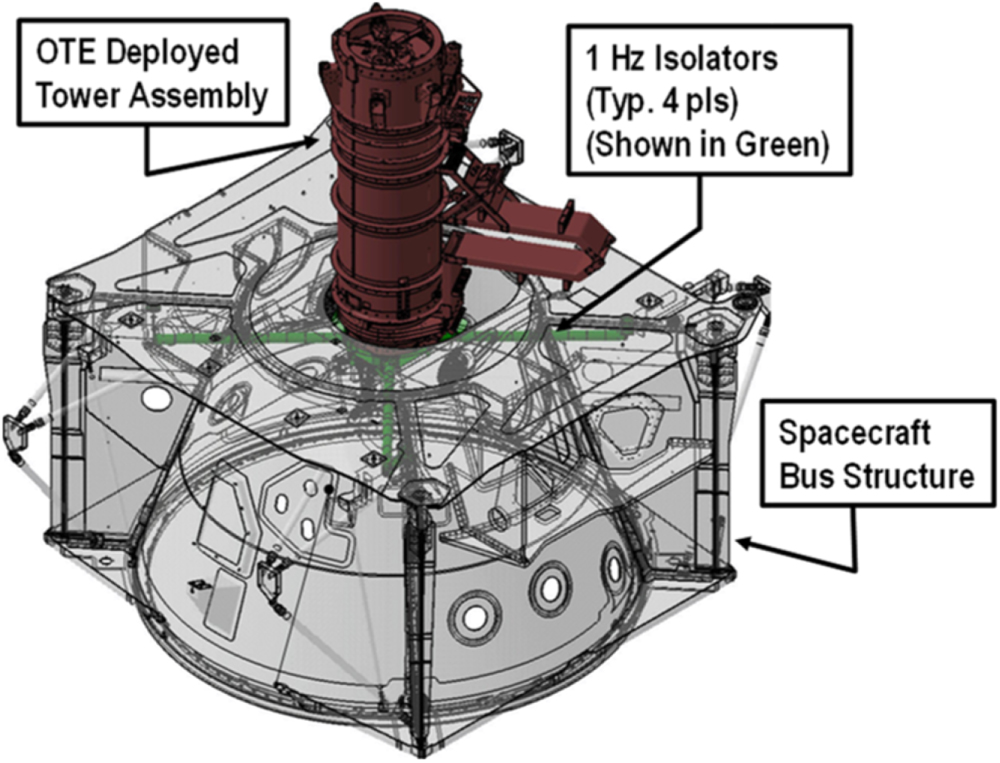
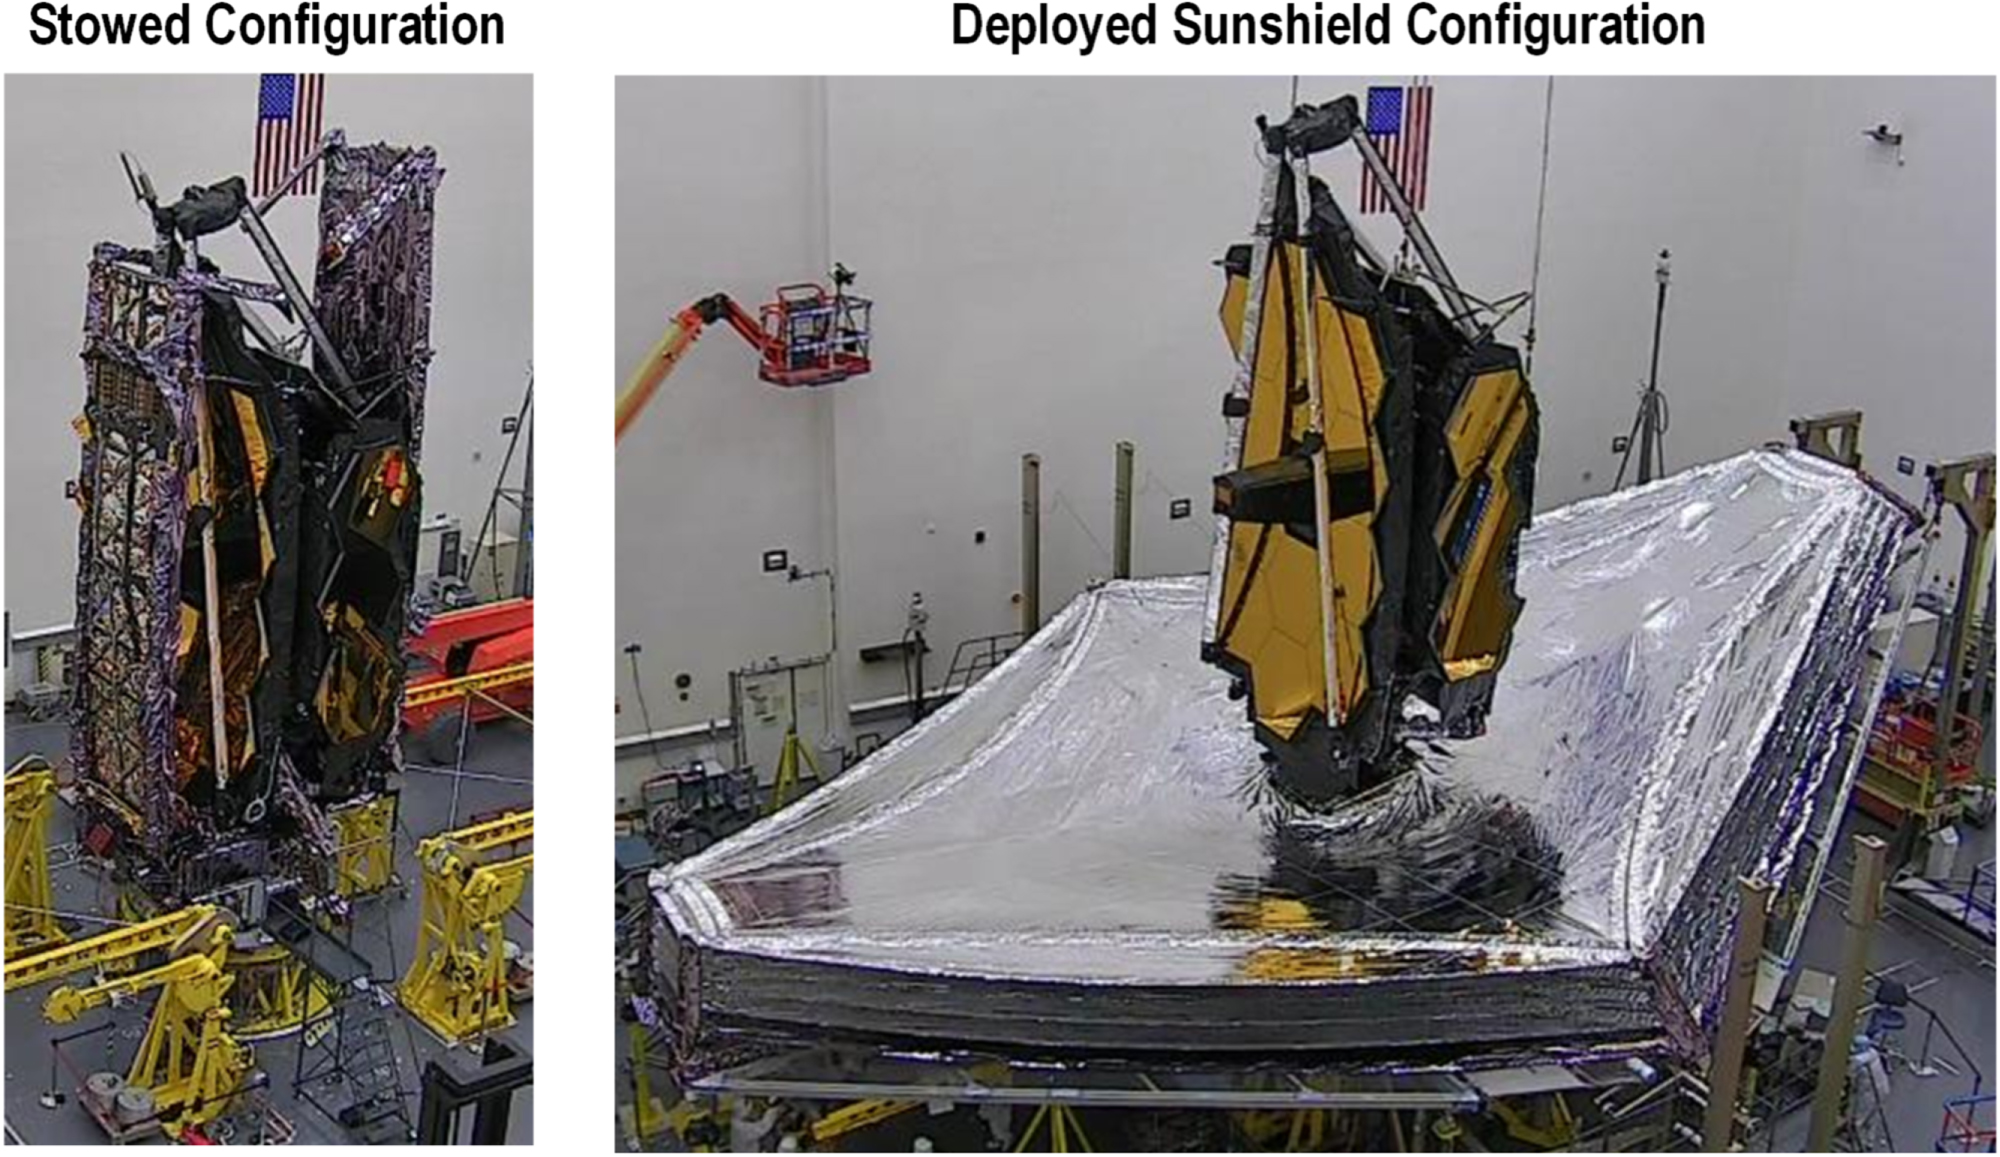
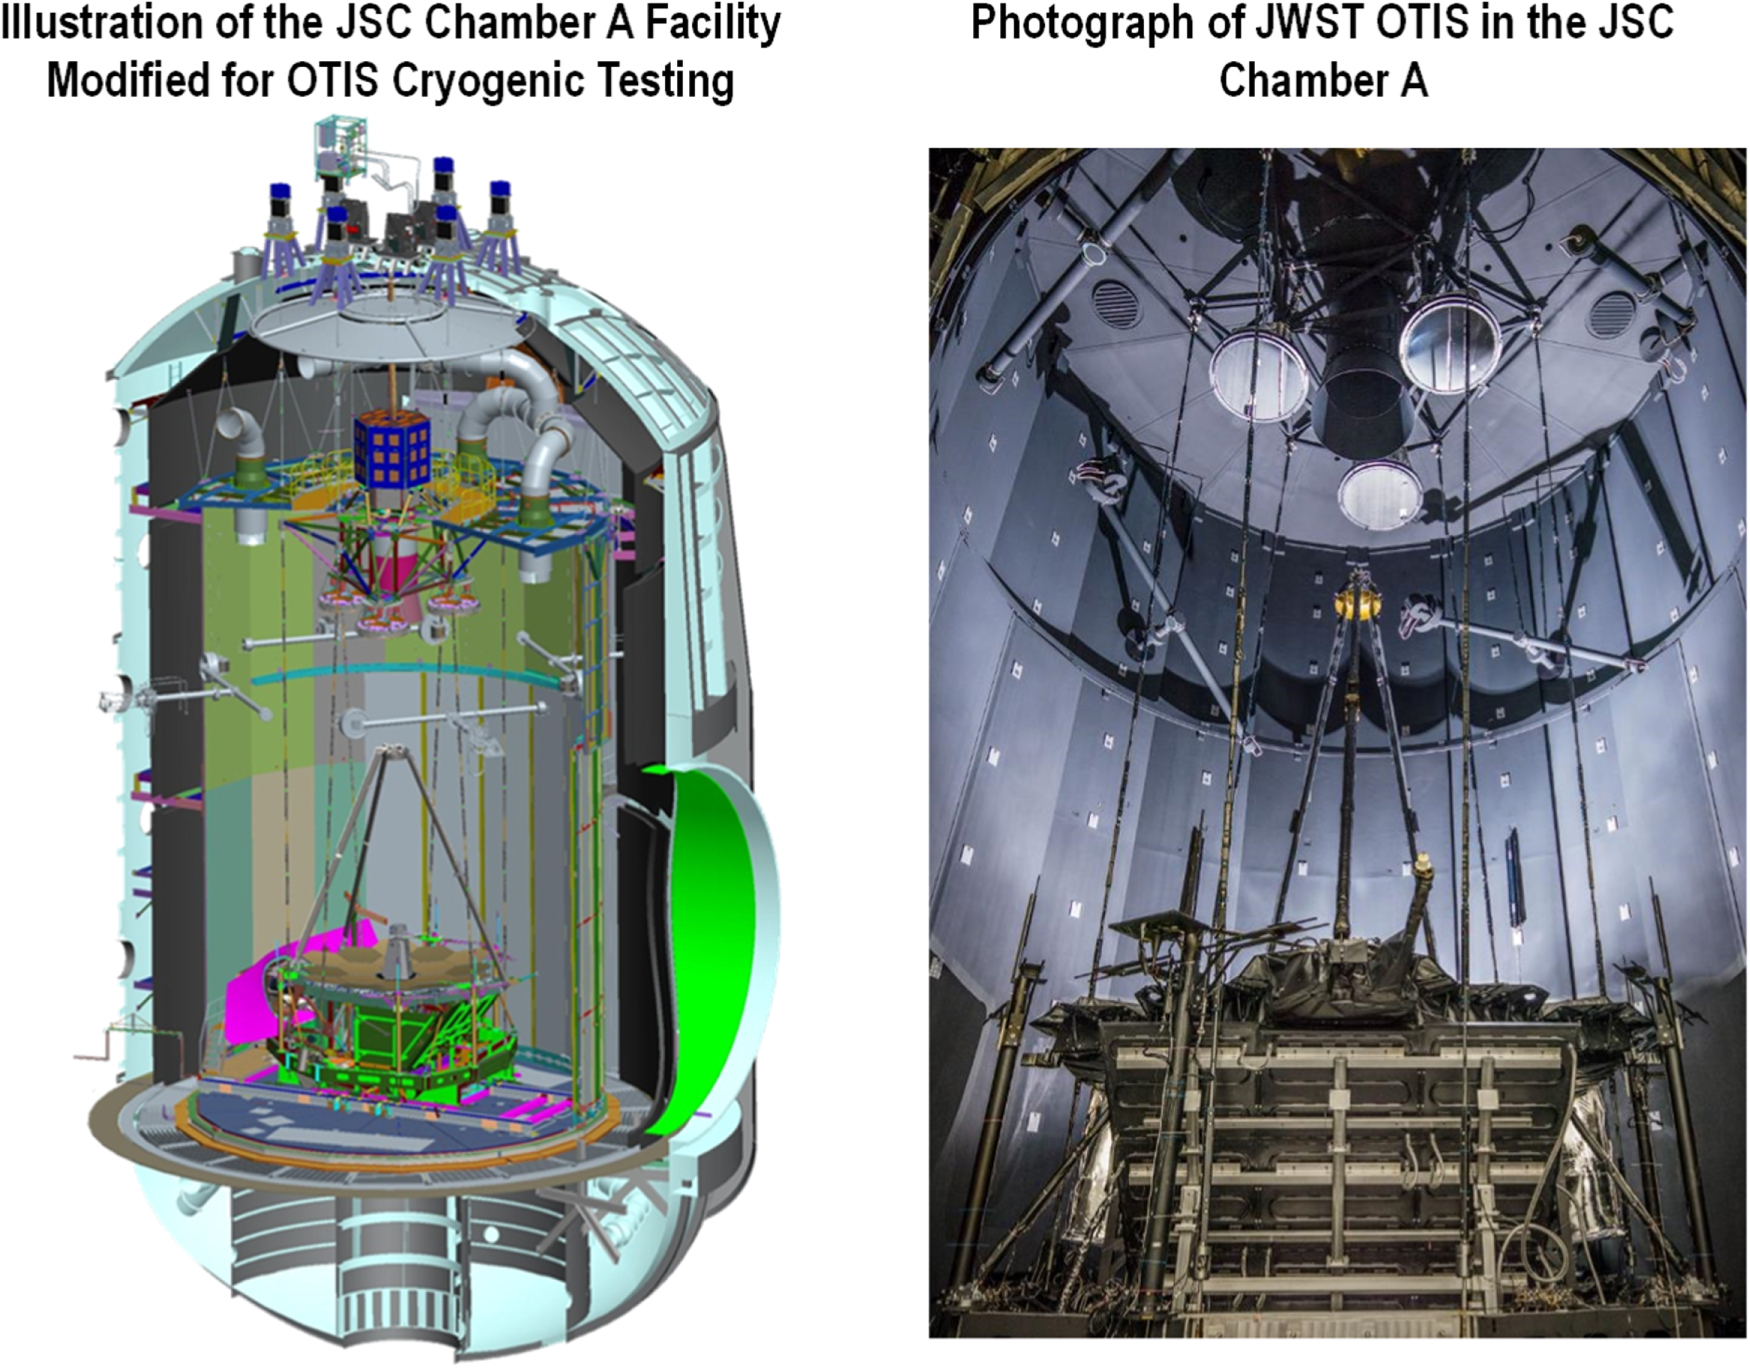
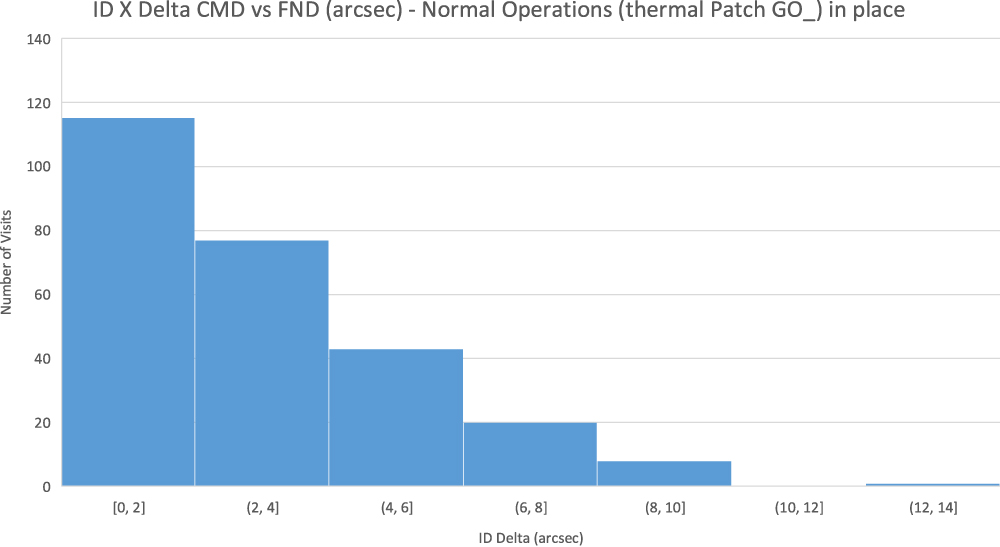
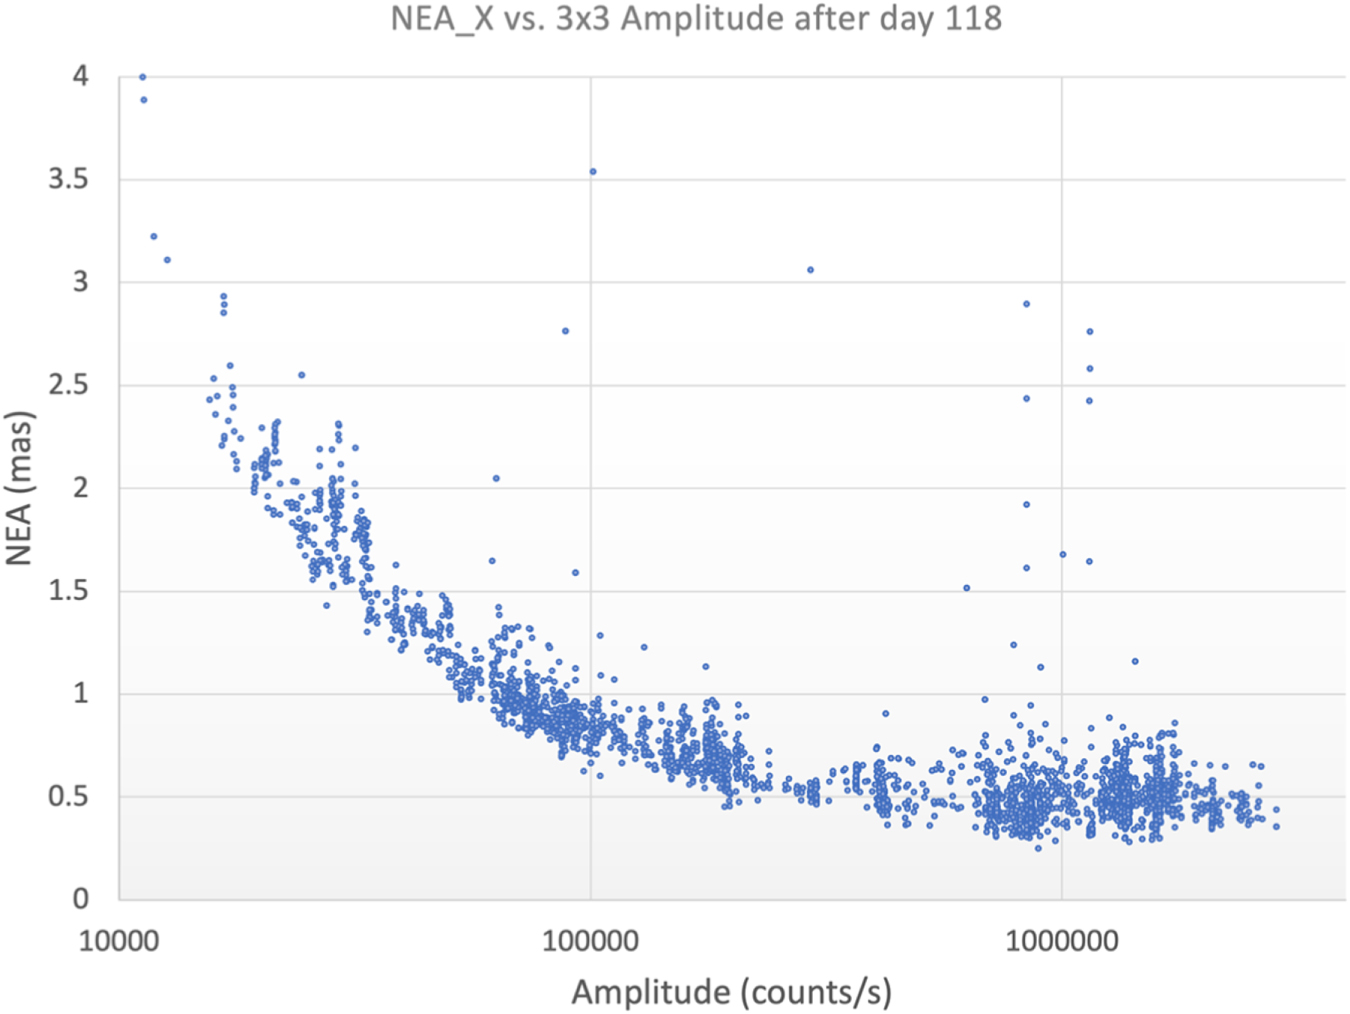
Figure 39. Predicted BOL and EOL OTE thermal distortion wavefront errors.
Download figure:
Standard image High-resolution image
Based on these BOL flight measurements, the corresponding EOL thermal distortion WFE was predicted from preflight calculations of thermal–optical–structural parameter changes over life. Table 7 compares the predictions to the measurements made from the on-orbit thermal stability test. The telescope performed very close to its BOL analytical predictions and to its total WFE EOL allocation.
Table 7. Thermal Stability On-orbit Measurements Compared to Analysis Predictions and Allocation
| Factor | On-orbit Thermal Stability Test | Analytical Prediction a | Allocation |
|---|---|---|---|
| IEC Heater Oscillation | 2.5 nm rms | 3.5 nm rms | |
| OTE Frill and Closeout | 4 nm rms | 9 nm rms | |
| OTE Thermal Distortion | 18 nm rms | 14.4 nm rms | |
| BOL Total (RSS) | 18.6 nm rms | 17.4 nm rms | |
| EOL Total | 54 nm rms | 43 nm rms | 50 nm rms |
Note.
a Model uncertainty factors are included in the analytical predictions.Download table as: ASCIITypeset image
Random primary mirror segment tilt events contributed to the telescope distortion, attributed to "stick-slip" like stress relief. These events were tracked during the thermal stability test and were removed from the data. Such events will continue to be monitored during telescope operations.
6.5. Image Quality
Flight data were obtained following its final alignment was very close to predictions and well within the WFE specifications for all the instruments. (McElwain et al. 2023). All the instruments meet the 0.8 Strehl ratio, with the lowest being NIRCam B at short wavelength with a Strehl of 0.84. After the initial alignment, the PSF FWHM was shown to be 2.54 pixels in NIRCam, which has 31 mas pixels. Analysis of the WFE considering the WFE from the measured LOS jitter and thermal distortion showed that diffraction-limited performance for NIRCam was achieved at 1.1 μm. The total observatory WFE values ranged from 75 to 130 nm depending on the instrument, observing mode, and field position.
6.6. Environmental Effects
As of the writing of this paper, JWST has been in space for 11 months and has experienced the full range of space environments anticipated for its mission life. These environments include the space plasma and radiation environments of the Earth magnetic geotail, exposure to cosmic rays, exposure to solar flares and coronal mass ejections, and the micrometeor environment.
Only the micrometeors have had a measurable impact on the observatory and so far has had no impact on science performance. The image quality after all micrometeor impacts to date continues to be diffraction limited at 1.1 μm versus its requirement of diffraction-limited performance at 2 μm.
Over the 11 months of exposure, wave-front sensing monitoring has identified 14 micrometeor impacts to date on the primary, a frequency that is in family with project estimates for the energies estimated based on the observed WFE. Based on their frequency and the pointing attitudes of the observatory during these events, it is likely that these came from the "sporadic" population of the micrometeors—those that have a more or less homogeneous distribution in the ecliptic plane. The observatory has also passed through five meteor showers and as expected there were no events recorded during these passages. The resulting WFE for 13 of the identified events was also in family with the project's allocation for WFE degradation with life. However, the micrometeor event, which occurred between 2022 May 22 and 2022 May 24, resulted in significantly higher WFE to PMSA segment C3, a segment that had already experienced a previous micrometeor event. An investigation team was assembled, and their findings were briefed to the NASA Space Mission Directorate on 2022 September 29. The team found the most likely cause of the 2022 May 22 event involved a micrometeor with sufficiently high energy to penetrate the Be PMSA and strike the whiffle-tree support structure behind it. The resulting structural distortion of this whiffle tree and its resulting load into the PMSA produced a larger than anticipated WFE. Although the team believes such events should be relatively rare, the project has adopted the following measures out of an abundance of caution.
- 1.The project will implement a Meteor Avoidance Zone (MAZ) 75° around the L2 velocity direction around the Sun and limit the amount of planned observation in these directions. This represents the direction where sporadic micrometeors will appear to come from with the highest kinetic energy. Observations in the MAZ direction will be limited to those that are time dependent or deemed high priority. Other observations will be scheduled to occur when targets are outside the MAZ.
- 2.The project will monitor the effectiveness of this strategy during the Cycle 2 observations and adjust as necessary for subsequent cycles.
- 3.As part of routine operations, the project will get forecasts from the NASA Micro-meteoroid Environment Office at the Marshall Space Flight Center of upcoming meteor showers and plan for the best attitudes to minimize observatory damage.
7. Summary
The JWST observatory was successfully launched on 2021 December 25, completed all its deployments, and all its commissioning activities. Due to the accurate orbital injection by the Ariane Launcher and the timely completion of all the MCCs, onboard fuel reserves can support a mission life of greater than 20 yr.
Despite the many challenges faced during its roughly 25 yr development, JWST is working much better than expected. The data from these commissioning activities show the observatory is meeting all its performance requirements and exceeding most of them. Its image quality shows diffraction-limited performance at a wavelength of 1.1 μm, and its LOS jitter and thermal distortion are well below their allocations. The observatory thermal performance is well within specification and has resulted in MIR stray-light levels under specification. OTE throughput meets specification, and since contamination levels are well within their allocations, NIR stray-light levels are also better than expected.
The project released its first Early Release Observations on 2022 July 12 to demonstrate the capability of this facility. These images and spectra clearly show the observatory was more than capable of fulfilling all its science mission objectives.
JWST is approximately halfway through its Cycle 1 science observations and has been performing well above expectations, and there is no reason to believe this level of performance will not continue for this first-of-a-kind NASA flagship mission.
| Acronym List | |
|---|---|
| ACS | Attitude Control Subsystem |
| ADIR | Aft Deployed ISIM Radiator |
| AOS | Aft Optics Assembly |
| ASIC | Application Specific Integrated Circuit |
| A × T | Aperture × Transmission |
| BOL | Beginning of Life |
| BSTA | Backplane Stability Test Article |
| C&DH | Command & Data Handling |
| CDR | Critical Design Review |
| CJAA | Cryocooler Jitter Attenuation Assembly |
| CoC | Center of Curvature |
| CPT | Comprehensive Performance Test |
| CSA | Canadian Space Agency |
| CTE | Coefficient of Thermal Expansion |
| DOF | Degree of Freedom |
| DRM | Design Reference Mission |
| DSN | Deep Space Network |
| DTA | Deployed Tower Assembly |
| EE | Encircled Energy |
| EOL | End of Life |
| EPS | Electrical Power Subsystem |
| ESA | European Space Agency |
| ETU | Engineering Test Unit |
| FGC | Fine Guidance Control |
| FGS | Fine Guidance Sensor |
| FOR | Field of Regard |
| FOV | Field of View |
| FSM | Fine Steering Mirror |
| FWHM | Full Width at Half Maximum |
| GS | Guide Star |
| GSE | Ground Support Equipment |
| GSFC | Goddard Space Flight Center |
| HST | Hubble Space Telescope |
| I&T | Integration & Test |
| IA | Isolator Assembly |
| IC&DH | ISIM Command & Data Handling |
| IM | Integrated Modeling |
| IRU | Inertial Reference Unit |
| ISIM | Integrated Science Instrument Module |
| ITM | Integrated Telescope Model |
| JSC | Johnson Space Center |
| JT | Joule–Thompson |
| JWST | James Webb Space Telescope |
| KBO | Kuiper Belt Object |
| L2 | 2nd Lagrange Point |
| LOS | Line of Sight |
| LRM | Launch Release Mechanism |
| MAZ | Meteoroid Avoidance Zone |
| MBA | Mid-Boom Assembly |
| MCR | Model Configuration Review |
| MGSE | Mechanical ground Support Equipment |
| MIR | Mid Infrared |
| MIRI | Mid Infrared Instrument |
| MRD | Membrane Release Device |
| MSE | Mission Systems Engineering |
| MT | Moving Target |
| MTMD | Magnetic Tuned Mass Damper |
| MTS | Membrane Tensioning Subsystem |
| MUF | Model Uncertainty Factor |
| NASA | National Aeronautics Space Administration |
| NG | Northrop Grumman |
| NIR | Near Infrared |
| NIRCam | Near Infrared Camera |
| NIRISS | Near Infrared Imaging Slitless Spectrograph |
| NIRSpec | Near Infrared Spectrograph |
| OTIS | OTE–ISIM |
| PDR | Preliminary Design Review |
| PMBA | Primary Mirror Backplane Assembly |
| PMBSS | Primary Mirror Backplane Support Structure |
| PMSA | Primary Mirror Segment Assembly |
| PT | Pulse Tube |
| RWA | Reaction Wheel Assembly |
| RWIA | Reaction Wheel Isolator Assembly |
| SAM | Small Angle Maneuver |
| SCE | Spacecraft Element |
| SI | Science Instrument |
| SM | Secondary Mirror |
| SMSS | Secondary Mirror Support Structure |
| SRR | Systems Requirements Review |
| STA | Star Tracker Assembly |
| STScI | Space Telescope Science Institute |
| TCS | Thermal Control Subsystem |
| TM | Tertiary Mirror |
| TPM | Technical Performance Metric |
| UPS | Unitized Pallet Structure |
| VDA | Vacuum Deposited Aluminum |
| WFE | Wave-front Error |
| WFSC | Wave-front Sensing and Control |
Integrated Modeling contributions were carried out at the Jet Propulsion Laboratory, California Institute of Technology, under a contract with the National Aeronautics and Space Administration (80NM0018D0004).