
Abstract
Cells in the central nervous system (CNS) respond to the stiffness of their environment. CNS tissue is mechanically highly heterogeneous, thus providing motile cells with region-specific mechanical signals. While CNS mechanics has been measured with a variety of techniques, reported values of tissue stiffness vary greatly, and the morphological structures underlying spatial changes in tissue stiffness remain poorly understood. We here exploited two complementary techniques, contact-based atomic force microscopy and contact-free Brillouin microscopy, to determine the mechanical properties of ruminant retinae, which are built up by different tissue layers. As in all vertebrate retinae, layers of high cell body densities ('nuclear layers') alternate with layers of low cell body densities ('plexiform layers'). Different tissue layers varied significantly in their mechanical properties, with the photoreceptor layer being the stiffest region of the retina, and the inner plexiform layer belonging to the softest regions. As both techniques yielded similar results, our measurements allowed us to calibrate the Brillouin microscopy measurements and convert the Brillouin shift into a quantitative assessment of elastic tissue stiffness with optical resolution. Similar as in the mouse spinal cord and the developing Xenopus brain, we found a strong correlation between nuclear densities and tissue stiffness. Hence, the cellular composition of retinae appears to strongly contribute to local tissue stiffness, and Brillouin microscopy shows a great potential for the application in vivo to measure the mechanical properties of transparent tissues.
Export citation and abstract BibTeX RIS
Introduction
The central nervous system (CNS) is our most complex organ system. It mainly consists of neurons and glial cells. In vivo, both cell types are susceptible to mechanical signals in their environment. Local gradients in tissue stiffness, for example, as well as mechanical tension on neuronal axons, contribute to guiding pathfinding axons during development [1, 2]. Furthermore, tension along neuronal axons is required for proper synaptic functioning in Drosophila [3]. Also in pathological processes, CNS cell mechanosensitivity may play an important role. For example, the mismatch in stiffness between neural implants and brain tissue facilitates foreign body reactions, during which implants are encapsulated by activated glial cells [4]. Knowledge about the mechanical properties of CNS tissue is therefore critical to understand its physiology and pathology.
Neural tissue belongs to the softest tissues in our body and is mechanically highly heterogeneous [5]. Stiffness gradients have been found in brain [2, 6–9], spinal cord [10], and retinal tissue [11]. CNS tissue is characterized by a complex, non-linear, viscoelastic response to applied strain (relative sample deformation) or stress (force per unit area) [6–15]. Thus, the elastic modulus of the tissue, which characterizes its resistance to deformation, depends on several measurement parameters, such as strain magnitude and strain rate. As these parameters vary widely between different measurement techniques, there is a wide spread of published values of the tissue's shear and Young's moduli (for a review discussing the partly large variations in reported mechanical properties of CNS see [5]).
Measurements at high frequencies (e.g. using magnetic resonance elastography) and large strains (e.g. using nanoindentation) may mimic mechanical stresses occurring during, for example, traumatic brain injuries. Small strain and strain rate measurements, on the other hand, which apply forces similar to those cells exert on their environment (e.g. using atomic force microscopy (AFM) indentation experiments), will rather reveal what mechanical environment cells encounter in the tissue.
It is mostly cellular components that seem to give rise to mechanical tissue heterogeneities. Recent studies revealed that, in adult mouse spinal cords and embryonic Xenopus brains, local differences in tissue stiffness strongly scale with cell body densities [2, 10], while in ruminant brains the amount of myelin, which is formed by oligodendrocytes, correlates with mechanical tissue heterogeneities in cerebral white matter [7]. Currently, it is not clear if the dominance of these cellular structures in determining local differences in CNS tissue stiffness are species- or tissue type-dependent. For example, is it only myelin that dictates mechanical heterogeneities in ruminant CNS tissue [7], or is the cell body density a species-independent key regulator of local mechanical CNS tissue properties?
To test if cell body densities regulate mechanical heterogeneities also in ruminant CNS tissue, we used AFM to measure the mechanical properties of ruminant retinal cross-sections. We chose the ruminant retina as a model system for three reasons. (i) Retinae contain clearly defined regions with high and low cell body densities: nuclear layers and plexiform layers, respectively. These layers alternate, thus providing an excellent model system to study the impact of cell body densities on local stiffness heterogeneities; (ii) most tissue layers (except the nerve fiber layer, NFL) do not possess long axons [16], which otherwise may contribute to local mechanical tissue heterogeneities [10], and (iii) ruminant retinae are not myelinated [16] (myelination has been shown to contribute to mechanical heterogeneities in ruminant CNS tissue [7]). Hence, axon orientation and the degree of myelination can be excluded as a cause of potential mechanical heterogeneities in the tissue.
AFM is a powerful tool for mechanobiology studies, in which the mechanics of living biological samples is measured at cellular and subcellular resolution [17]. Usually, a spherical probe is glued to a soft leaf spring, the cantilever, which is used to indent the sample via a Piezo-electric element. While the sample is indented, the cantilever is deflected; the magnitude of cantilever deflection, which is proportional to the applied force, is measured via a laser that is reflected off the cantilever surface onto a photodiode (supplementary figure 1(a) (stacks.iop.org/PhysBio/14/065006/mmedia)). Different models can be used to extract an elastic modulus from the relation between the applied stress and the resulting strain.
To investigate if the results of the measurements depend on the applied test parameters, we complemented the AFM experiments by Brillouin microscopy measurements [18, 19]. This method is based on spontaneous Brillouin light scattering arising from the interaction of light with acoustic phonons in a sample (supplementary figure 1(b)). Because the acoustic phonons within a sample depend on the local elastic modulus of the material, analyzing the spectrum of the scattered light can be used to determine elastic moduli from the Brillouin shift. Thus, this all-optical contact-free technique does not require to deform the sample in order to extract mechanical information, and it offers optical resolution. Brillouin microscopy has been previously used to characterize single cells [18, 20, 21] as well as corneal and lens tissue mechanics [22–24], and it is currently being used in clinical trials investigating ocular disorders [25, 26].
Finally, we used previously developed empirical models [10, 18, 22, 27] to compare AFM with Brillouin microscopy, and to test if cell body densities regulate local tissue stiffness in the ruminant retina. Both techniques yielded similar results, indicating that higher cell body densities indeed correlate well with increased tissue stiffness also in ruminant tissue.
Material and methods
Ovine eyes were collected from ewes after death by administration of a lethal overdose of anesthetic (200 mg kg−1 sodium pentobarbitone) under the Animals (Scientific Procedures) Act 1986. The terminal procedure under the act and the non-regulated procedure of collecting eyes post mortem were approved by the Animal Welfare and Ethical Review Board of the University of Cambridge. Bovine eyes were obtained 2–4 h postmortem from a local slaughterhouse (Research 87 Inc, Boylston, MA, USA). All bovine samples in this study were used in accordance with the ARVO Statement for the Use of Animals for Ophthalmic and Vision Research.
Hematoxylin and eosin staining
Eyes were removed from ewes 10–15 min post mortem and kept in PBS (Oxoid) on ice. Retinae were extracted 30 min later and fixed in 0.5% PFA (Sigma; in PBS) for 30 min at room temperature. Small pieces of retinal tissue were embedded in OCT (TissueTek Optimal cutting temperature compound, VWR) and cooled down on dry ice. 14 µm thick sections were cut on a cryostat (Leica CM3050) and transferred to super frost objective slides (Thermo Scientific). A minimum of 3 sections per retina from 2 sheep were used for analysis. Bovine eyes were extracted from 2 year-old female bovine and kept on ice for transportation. Retinae were extracted and fixed in 10% formalin for >48 h at room temperature. Then, 5 µm-thick slices were cut for histologic analysis. A minimum of 4 sections from 2 cows were stained. Sections were rehydrated using Ethanol (Sigma; 100% for 3 min, 95% for 2 min, and 75% for 2 min) and rinsed in water for 5 min. Harris' hematoxylin solution (pfmMedical) was applied for 4 min before slides were washed with water for 5 min. Sections were subsequently stained with alcoholic Y eosin solution (Leica) for 1 min and rinsed in water for 40 s. Dehydration was achieved by washing with Ethanol (75% for 40 s, 95% or 1 min, and 100% for 3 min), followed by applying xylene (Fisher Scientific) for 3 min for clearing. Sections were mounted in DPX mountant (Fisher Scientific) and imaged on a Zeiss Axioskop with a QImaging MicroPublisher 5.0 RTV camera attached to it.
Slice preparation
For AFM measurements, eyes were removed from adult female sheep 10–15 min post mortem and kept in phosphate buffered saline (PBS, Oxoid) on ice. Retinae were extracted within 3 h post mortem. Pieces of retinal tissue were bathed for 5–10 min in ice cold PBS containing MitoTracker Orange (ThermoFisher, 1 µM) [28], washed with fresh PBS and subsequently embedded in 2.5% low melting point agarose (Sigma; 37–40 °C in PBS). Using superglue, the retina-containing agarose block was glued on a vibratome (VT1000 S, Leica Microsystems) plate and placed in the vibratome basin containing ice-cold PBS. 300 µm thick cross sections were cut using one half of a Gillette 7 O' Clock double edged razor blade with a frequency of 75 Hz and a forward speed of ~50 µm s−1. Slices were transferred to BD Cell-Tak-treated (Cell and Tissue Adhesive; BD Biosciences) glass slides, covered with PBS, and used for AFM measurements. For Brillouin microscopy measurements, freshly enucleated bovine eyes were obtained from a local slaughterhouse and kept on ice during the transportation until the starting of the experiment. Retinae were dissected immediately before the measurements, transferred to filter paper, slices cut with a scalpel blade, and mounted upright using a custom-built chamber [28] filled with L15 medium (ThermoFisher). All experiments were completed within 8 h after sacrifice.
Nuclear density measurements
14 µm thick sheep retina cryo-sections were collected on super frost objective slides. For visualization of nuclei, sections were treated with DAPI (Sigma Aldrich) for 15 min, washed with PBS, and mounted in Fluoromount Aqueous Mounting Medium (Sigma Aldrich). Fluorescence images were taken on a Leica SP8 confocal laser scanning microscope (40 × oil objective, NA = 1.3). 3 images of different parts of the retina were subsequently processed using FIJI imaging software. 8-bit images were converted into binary images, watershed applied, and a particle analysis (Size = 1 − Infinity, Circularity = 0.00–1.00) was performed for the outer nuclear layer (ONL), inner nuclear layer (INL), and inner plexiform layer (IPL). Three measurements per layer and image were performed, and each layer's relative mean area covered by cell nuclei Anorm was calculated.
AFM measurements
Force-distance curves were acquired using a JPK Cellhesion 200 (JPK Instruments AG, Berlin, Germany) setup on an inverted optical microscope (Axio Observer.A1, Carl Zeiss Ltd. Cambridge, UK), and fluorescently labelled retinae imaged simultaneously. Tipless silicon cantilevers (Arrow-TL1, NanoWorld, Neuchatel, Switzerland) with spring constants of ~0.03 N m−1 were custom-modified by attaching polystyrene beads of d = 10 µm (microParticles GmbH, Berlin, Germany) prior to the experiments. Slices of retinal tissues were transferred to the AFM and measurements were performed with a maximum force of 4–5 nN at an approach speed of 10 µm s−1. Force-distance curves were taken every 15 µm in a raster scan across the whole apico-basal length of the retina (the average area covered was approximately 300 × 200 µm2). In parallel, fluorescence images were acquired using an sCMOS camera (Zyla 4.2, Andor). Force-distance curves were fitted with the Hertz model [29] using a custom-written algorithm [2, 8, 10], and the apparent elastic modulus  was extracted:
  , with
  = applied force,
  = Young's modulus,
  = Poisson's ratio,
  = radius of the probe, and
  = indentation depth. The algorithm was executed for various possible contact points in an iterative manner, and the best least-root-mean-square fit was chosen [8]. The curves were analyzed for the full indentation depth (i.e. for the maximum force applied). For further analysis, the retinal layers were segmented manually.
Brillouin microscopy
The confocal Brillouin microscope used in this study has been previously described [18]. The system uses a 532 nm laser with an optical power on the sample of 5 mW–10 mW and exposure time of 0.1 s–0.2 s. The laser light was focused by a 40 × objective (Olympus, NA = 0.6) leading to an optical resolution of 1 µm (lateral) and 2 µm (axial). The scattered light was collected in epi-detection and sent to a two-stage VIPA-based Brillouin spectrometer featuring an EMCCD camera (Andor, IXon Du-897) [30–32]. To determine Brillouin frequency shifts, spectral data acquired by the camera were fitted by a Lorentzian function using a custom MATLAB code. 2D images were obtained by scanning the sample with a 3D translational stage (Prior Sci.). Using a reference arm, water and glass samples of known Brillouin frequency shifts were used for the long-term calibration of spectral data. A custom LabVIEW (National Instruments) code was used to control the motorized stage, shutters, and the CCD camera. Retinal layers were segmented manually.
Data availability
Data will be provided upon request.
Results
Retinal structure of two different ruminant species
We first compared the morphological structure of retinae of two ruminant species, cow and sheep, using hematoxylin and eosin (H&E) stainings. In an H&E stain, nuclei appear dark (blue–purple), while cytoplasm and other structures, such as cellular processes, stain pink. Cross-sections of ovine (figure 1(a)) and bovine (figure 1(b)) retinae showed a very similar morphology.
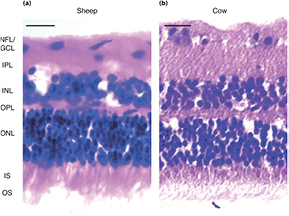
Figure 1. Comparison between retinae of different ruminant species. Hematoxylin and Eosin staining of (a) ovine and (b) bovine retinae. NFL = nerve fiber layer, GCL = retinal ganglion cell layer, IPL = inner plexiform layer, INL = inner nuclear layer, OPL = outer plexiform layer, ONL = outer nuclear layer, IS = photoreceptor inner segments, OS = photoreceptor outer segments. Scale bar: 20 µm.
Download figure:
Standard image High-resolution imagePhotoreceptor cells accounted for the thickest layer, taking up almost half of the total retinal thickness. Densely packed outer (OS) and inner photoreceptor cell segments (IS; pink staining at apical side) projected from a thick layer of stacked photoreceptor cell somata (ONL), 5–7 nuclei in width. OS, IS, and ONL together form the photoreceptor cell layer (PRL). The underlying outer plexiform layer (OPL), containing mostly neuronal processes and their synapses, was the thinnest layer of the retina. The neighboring INL, containing somata of interneurons and Müller glial cells, was approximately 3–4 nuclei wide in both species (corresponding to ~one fifth of the total retinal thickness). The adjacent IPL was of similar width as the INL. Finally, the basal retinal ganglion cell layer (GCL) was a sparse, single-layered structure with individual ganglion cells (GCs) scattered across the NFL. Taken together, the retinae of sheep and cow are very similar in terms of nuclear density distributions and thus both good model systems to study ruminant retina mechanics.
Mechanical characterization of ovine retinae using AFM
To determine the mechanical properties of ovine retinae with cellular resolution, we performed AFM indentation measurements across retinal cross-sections in a raster scan with a step size of 15 µm (figure 2, supplementary movie 1). Fitting the Hertz model to force-distance curves, we determined the apparent elastic modulus K at each position. K is a measure of the tissue's local elastic stiffness.
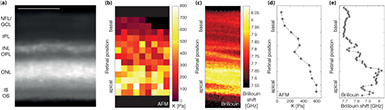
Figure 2. Comparison between AFM and Brillouin microscopy measurements of ruminant retinae. (a) Cross-section of an ovine retina, stained with MitoTracker Orange. The individual layers of the retina are clearly discernible. NFL = nerve fiber layer, GCL = retinal ganglion cell layer, IPL = inner plexiform layer, INL = inner nuclear layer, OPL = outer plexiform layer, ONL = outer nuclear layer, IS = photoreceptor inner segments, OS = photoreceptor outer segments. Scale bar = 100 µm. (b) Elasticity map of that retina assessed by AFM. Each pixel corresponds to an individual measurement; pixels containing no data were removed (see supplementary figure 3). K is shown for full indentation; the larger K, the stiffer the tissue. (c) Brillouin image of a bovine retinal cross-section. As in the AFM elasticity map, the apical PRL is the stiffest retinal layer, and other layers can be distinguished based on their mechanical properties. The resolution of Brillouin microscopy was 1 µm in both directions. (d) and (e) Line profiles of retinal elastic stiffness; data points shown correspond to the median values of each pixel row shown in supplementary figures 2(c), (e) and 3(d).
Download figure:
Standard image High-resolution imageTo correlate the AFM measurements with the underlying retinal structures, we treated retinae with MitoTracker Orange prior to AFM measurements. MitoTracker stains mitochondria in live cells and in the retina particularly Müller glial cells [28], allowing to visualize individual tissue layers (figure 2(a), supplementary movie 1). Plotting color-coded K values as a function of position in the measurement plane resulted in elasticity maps (figure 2(b)) [2, 8, 10, 17], revealing that ovine retinal cross-sections are mechanically highly heterogeneous, with alternating stiff and soft regions.
This finding was confirmed by comparing pooled data of each tissue layer (figure 3(a)). In all AFM experiments (n = 3), we found significant differences between the mechanical properties of different retinal layers (P < 0.001, Kruskal–Wallis ANOVA). The areas of highest stiffness corresponded to the PRL and the more basally located INL, i.e. the layers containing most cell bodies in the retina (figures 2 and 3(a), supplementary figures 2(a) and 3). Within the PRL, photoreceptor cell bodies as well as IS and OS were mechanically indistinguishable. With a median K of 330 Pa, the PRL was significantly stiffer than all other retinal layers (n = 3; P ⩽ 4 * 10−4, Dunn's multiple comparison test). While OPL, IPL, and the NFL/GCL were mechanically similar, with median K values of 199 Pa, 153 Pa, and 157 Pa, respectively (P ⩾ 0.26), the IPL was significantly softer than the neighboring INL with K = 216 Pa (P = 3.9 * 10−2) (figure 3(a)).

Figure 3. Mechanical properties of different tissue layers of ruminant retinae. (a) Apparent elastic moduli K of the different layers of ovine retinae determined by AFM. K was significantly different between tissue layers (P < 0.001, Kruskal-Wallis ANOVA; n = 3). NFL = nerve fiber layer, GCL = retinal ganglion cell layer (n = 98), IPL = inner plexiform layer (n = 113), INL = inner nuclear layer (n = 48), OPL = outer plexiform layer (n = 32), PRL = photoreceptor cell layer (n = 180). Plot including outliers shown in supplementary figure 2(a). (b) Brillouin shift of the different layers of bovine retinae. As in the AFM measurements, retinae were mechanically heterogeneous, and the Brillouin shift was significantly different between tissue layers (P < 0.001, Kruskal-Wallis ANOVA). nNFL/GCL = 362, nIPL = 420, nINL = 340, nOPL = 90, nPRL = 924. Plot including outliers shown in supplementary figure 2(b). Red line = median, blue box = Q1–Q3 percentile. *(P < 0.05); **(P < 0.01); ***(P < 0.001), Dunn-Sidak Multiple Comparison Test.
Download figure:
Standard image High-resolution imageMechanical characterization of bovine retinae using Brillouin microscopy
Having established that AFM can be used to distinguish different retinal layers by their mechanical fingerprints, we next compared the AFM measurements with a contactless optical method recently developed to measure tissue mechanics, Brillouin microscopy [18–20, 33] (supplementary figure 1(b)). Measurements of cross-sections of bovine retinae revealed a very similar elastic stiffness distribution in the tissue as found by AFM (figure 2). In both approaches, two comparatively stiffer regions were identified: the apical third of the retina, corresponding to the PRL, and a thin band located more basally, which co-localized with the INL. Plotting the median values of each pixel row in the heat maps shown in supplementary figure 3 (AFM) and figure 2(c) (Brillouin) resulted in line profiles of stiffness distributions within the ruminant retina (figures 2(d) and (e)). These plots confirmed an overall stiffness gradient in the tissue. The overall stiffness decreased from the apical to the basal retinal surface. Both plexiform layers showed a dip in elasticity, with lower K values and smaller Brillouin shifts, with an intermediate peak in stiffness coinciding with the INL.
Quantitative comparison between AFM and Brillouin measurements
To quantitatively compare the two techniques, let us consider the physics behind Brillouin and AFM interactions. In AFM, a cantilever with a spherical probe physically indents the sample. From the resulting force-distance curve, the apparent elastic modulus K can be calculated, which is related to the quasi-static Young's modulus E through the relationship  , where ν is the Poisson's ratio. In spontaneous Brillouin scattering, the light scattered from a phase-matched acoustic wave experiences a Doppler-like frequency shift due to the propagating soundwaves. In the experimental configuration illustrated in supplementary figure 1(b), the Brillouin frequency shift can be expressed as Ω
  , where λ is the wavelength of light, n the refractive index of the tissue, M' the real part of the longitudinal elastic modulus, and ρ the density of the material. Therefore, Brillouin spectroscopy can provide direct information about the local longitudinal elastic modulus of a material (figure 4), i.e. the uniaxial stress–strain ratio at frequency Ω, using the equation
  . Assuming an average refractive index of the retina of about 1.358 [34] and a density of the cow retina of 1.033 g cm−3 [35],
  can be approximated by a constant (
 ) within a tissue [22, 27].
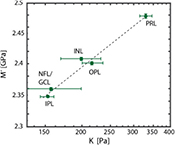
Figure 4. Correlation between elastic moduli obtained by AFM and Brillouin microscopy. We found a strong correlation in the log–log linear regression between AFM and Brillouin microscopy data (P-value < 0.01; R2 = 0.99), which could be best described by the relationship log(M') = 0.0678 log(K) + 9.2235. Each dot in the graph corresponds to the median of stiffness values for a defined layer within the retina as measured by AFM and Brillouin microscopy. The error bars indicate the standard error of the median. The dashed line indicates a linear fit on the log–log plot.
Download figure:
Standard image High-resolution imageIn crystalline materials, the relationship between the longitudinal modulus M derived from Brillouin measurements and Young's modulus E is straightforward, i.e.  . On the other hand, in biological tissues, this relationship is not established. Biological materials are generally characterized by a low compressibility, i.e. their Poisson's ratio is close to 0.5; in the retina ν has been reported to be about 0.47 [36]. Furthermore, as all other biological tissues, neural tissue is nonlinearly elastic; its elastic modulus strongly depends on the frequency at which it is probed [5]. Thus, the longitudinal modulus M measured by Brillouin techniques at GHz frequencies is much higher than the quasi-static apparent elastic modulus, K, determined by AFM at frequencies in the ~Hz range.
Previously, we have empirically compared Brillouin measurements with different mechanical tests of biological tissues and biopolymers [18, 22, 27]. We found a strong correlation between longitudinal and Young's moduli, in a log–log linear relationship: log(M') = alog(E') + b, with a and b being material-dependent coefficients. This correlation suggests a power-law relationship between M' and E', consistent with the power-law frequency-scaling found in biological tissues and biopolymers up to kHz [37–39] and MHz [40]. Comparing AFM and Brillouin measurements of this study, we found a similar relationship between both moduli, allowing to convert the Brillouin shift into a quantitative assessment of elastic tissue stiffness (figure 4). The best fit was obtained for a = 0.07 and b = 9.22 (R2 = 0.99).
Predicting local tissue stiffness
Recently, we developed an empirical mathematical model to estimate the local stiffness of murine spinal cord tissue based on histology data [10]:

where a, b and c are constants that depend on the material tested and on measurement parameters, Anorm is a measure of cell body density, and  a measure of axon orientation. In all retinal layers except the NFL,
  = 0, as long axons are missing [16] and there is thus no dominant direction along which axons are aligned, simplifying this expression to

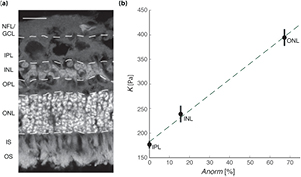
To test if this equation can be generally applied to CNS tissue, we determined local cell body densities in the largest retinal layers, ONL, INL, and IPL (figure 5(a)), and calibrated the model using the AFM results. As in the mouse spinal cord, tissue stiffness linearly scaled with the density of cell nuclei (R2 = 0.99; figure 5(b)), suggesting that mechanical heterogeneities in CNS tissue are largely governed by cellular structures, and that local CNS tissue stiffness can be estimated based on histology data.
Figure 5. Correlation between cell density and stiffness in different retinal layers. (a) Image of an ovine retinal cross-section. Cell nuclei are shown in grey (stained using DAPI). NFL = nerve fiber layer, GCL = retinal ganglion cell layer, IPL = inner plexiform layer, INL = inner nuclear layer, OPL = outer plexiform layer, ONL = outer nuclear layer, IS = photoreceptor inner segments, OS = photoreceptor outer segments. Scale bar: 20 µm (b) relationship between nuclear density Anorm and K for different retinal layers. Shown are mean values ± SEM of the IPL, INL, and ONL. The best fit was achieved using  ; we found a strong linear correlation between K and Anorm (R2 = 0.99).
Download figure:
Standard image High-resolution image
Discussion
We here investigated if there is a general, species-independent connection between the local cell body density and CNS tissue stiffness using two complementary techniques, AFM and Brillouin microscopy. We used two different ruminant species for our experiments, sheep and cows. The morphological structure of ovine and bovine retinae is very similar [21] (figure 1), suggesting that their mechanical properties are also likely similar.
As in CNS tissues the elastic response dominates at the strain rate used in this study [5], and because CNS cells respond to the elastic stiffness of their environment [2, 4, 41–46], we here focused on the elastic response of the tissue. The overall elastic stiffness of retinal tissue measured in this study was comparable to that of other CNS tissues assessed by AFM [2, 6, 8–11, 47–49]. Similarly, the Brillouin shifts we measured in the retina are comparable with values published in previous literature [18, 20, 21].
We found that different layers in the ruminant retina are characterized by distinct mechanical properties. Both nuclear layers were significantly stiffer than the IPL. Tissue stiffness heterogeneities at least in the mouse spinal cord and Xenopus brain are largely governed by local cell body densities [2, 10]. The density of cell nuclei is, by definition, substantially higher in the nuclear layers than in the plexiform layers (figures 1 and 5), providing a plausible explanation for the origin of the observed stiffness differences between the different retinal layers, and suggesting that cell body densities may indeed be a general important contributor to local tissue stiffness in the vertebrate CNS.
Additionally, the mechanical properties of Müller glial cells may contribute to the observed local stiffness distribution in the retina. The nuclei of these cells, which are located in the INL, are significantly stiffer than the inner and outer processes of the cells, which span both plexiform layers [36, 50]. This finding led to the speculation that the plexiform layers might be softer than the nuclear layers [36], which we have now shown.
A higher stiffness of cell bodies compared to neuronal processes [36] might also explain why the spread of K values is much higher in the GCL/NFL than in other retinal layers (supplementary figure 2). Here, individual retinal GC nuclei are dispersed within bundles of nerve fibers. AFM measurements in a region not containing a GC nucleus might thus yield a much lower K value than a measurement right on top of a nucleus [11], leading to a large deviation of values in that layer.
Our AFM results were confirmed by Brillouin microscopy, which did not require physical contact with the sample. Brillouin microscopy offers optical resolution, while the resolution of AFM elasticity maps is a tradeoff between the size of the area that needs to be covered, the time a single measurement takes, and the time the tissue is alive. CNS tissue often changes its mechanical properties within 8 h after removing it from its environment (e.g. once the retina is removed from the eyeball) [5]. Given that a single AFM indentation measurement in this study took about 15 s, and to include all retinal layers and to have enough measurements points per layer the covered area was chosen to be about 300 × 200 µm2, a resolution of 15 µm was reasonable and sufficient.
Despite the differences in spatial resolution, both AFM and Brillouin microscopy yielded qualitatively very similar results, suggesting that Brillouin microscopy is a powerful tool that, once calibrated, offers many new possibilities to investigate tissue mechanics in biological tissues ex vivo as well as in vivo. Because the correlation between AFM and Brillouin is linear on a log–log scale (see figure 5), rigorous experimental measurements are needed to provide accurate calibration measurements; but if the tissue type-specific constants of calibration are accurately estimated, Brillouin microscopy can be used for quantitative mechanics measurements.
Conclusions
Our study shows that nuclear density is an important factor causing mechanical heterogeneities also in ruminant CNS tissue. As other factors may contribute to changes in local tissue stiffness as well, it is possible that relative differences between the elastic stiffness of the various retinal layers are species-dependent. Parts of the NFL in the rabbit retina, for example, are strongly myelinated, which might make this part of the tissue much stiffer than NFLs in non-myelinated retinae [7, 51]. Future work will reveal which and to what extent other cellular and extracellular components contribute to mechanical heterogeneities in CNS tissue, which have significant implications for the developing and diseased CNS [2, 5, 41].
Acknowledgments
The authors would like to thank Andreas Reichenbach for insightful discussions about ruminant retinae, staff of the Department of Physiology, Development and Neuroscience for providing access to sheep retinae, and Helen Skelton for assistance with H&E stainings. IPW is a recipient of an EMBO Long-Term Fellowship (ALTF 1263-2015; European Commission FP7 (Marie Curie Actions, LTFCOFUND2013, GA-2013-609409)). This work was further supported by the National Science Foundation (CMMI-1562863 to SHY and CMMI-1537027 to GS), the Human Frontier Science Program Young Investigator Grant RGY0074/2013 (GS and KF), the UK Medical Research Council Career Development Award G1100312/1 (KF), and the National Institutes of Health (R01EY025454 to SHY, K25EB015885 and R33CA204582 to GS, R21HD080585 to KF). The content is solely the responsibility of the authors and does not necessarily represent the official views of the National Institutes of Health.