
Abstract
The motion of a suspension of red blood cells (RBCs) flowing in a Y-shaped bifurcating microfluidic channel is investigated using a validated low-dimensional RBC model based on dissipative particle dynamics. Specifically, the RBC is represented as a closed torus-like ring of ten colloidal particles, which leads to efficient simulations of blood flow in microcirculation over a wide range of hematocrits. Adaptive no-slip wall boundary conditions were implemented to model hydrodynamic flow within a specific wall structure of diverging three-dimensional microfluidic channels, paying attention to controlling density fluctuations. Plasma skimming and the all-or-nothing phenomenon of RBCs in a bifurcating microfluidic channel have been investigated in our simulations for healthy and diseased blood, including the size of a cell-free layer on the daughter branches. The feed hematocrit level in the parent channel has considerable influence on blood–plasma separation. Compared to the blood–plasma separation efficiencies of healthy RBCs, malaria-infected stiff RBCs (iRBCs) have a tendency to travel into the low flow-rate daughter branch because of their different initial distribution in the parent channel. Our simulation results are consistent with previously published experimental results and theoretical predictions.
Export citation and abstract BibTeX RIS
1. Introduction
Plasma and red blood cells (RBCs) are the two major components of whole human blood. A healthy RBC has a biconcave shape when not subject to any external stress and is approximately 8.0 μm in diameter and 2.0 μm in thickness [1]. Lateral migration of RBCs takes place in blood flow at a low Reynolds number, leading to the formation of two phases, namely a flow core consisting mainly of RBCs and a cell-free layer (CFL) adjacent to the channel wall devoid of RBCs. Most blood test analyses in medical laboratories are often performed on cell-free samples, which require the separation of RBCs from the whole blood. Therefore, blood–plasma separation needs to be achieved. However, the thickness of a CFL is too small to extract cell-free plasma from whole blood sample. A simple but effective solution to blood–plasma separation problems is to introduce blood flow in a diverging microfluidic channel [2–4].
Over the last few decades, several studies have focused on detailed and accurate models for describing blood flow in bifurcating microfluidic tubes and channels [5–11]. For a suspension of RBCs flowing through an asymmetric bifurcation, the volume fractions in the two daughter branches are not equal; the volume fraction of RBCs increases in the daughter branch with a higher flow rate, whereas the volume fraction of RBCs decreases (even reaching zero) in the daughter branch with a lower flow rate. This phenomenon is sometimes called the bifurcation law or the Zweifach–Fung effect [5, 6]. Considering the forces acting on the RBCs situated centrally at the branch point of a capillary blood vessel, Fung stated that both the pressure and shear forces tend to pull the RBCs into the high flow-rate branch [6]. However, in two recent studies, Barber et al [12] and Doyeux et al [11] found that the RBC in the vicinity of the pure flow separating streamline is attracted toward the low flow-rate branch.
The theoretical critical flow-rate ratio between the two daughter branches for the complete RBC separation from the whole blood (all-or-nothing phenomenon) is approximately 2.5 when the channel width is of the same size as the RBC diameter [6]. However, experimental results on the blood–plasma separation show that for the 2.5 flow-rate ratio between the two daughter branches, only 88.7% of the cells travel into the higher flow-rate daughter branch, while a 6.0 minimum flow-rate ratio is required to obtain successful blood–plasma separation [2]. In fact, at a branch point of the bifurcation, RBCs are distributed into different branches depending on several key factors such as the size of parent channel [13, 14], the flow-rate ratio of daughter branches [5, 6, 15], the feed hematocrit distribution [3, 13, 16, 17], the plasma viscosity [18, 19] and the RBC properties including deformability and aggregability of RBCs [12, 20]. When blood flows through a bifurcation, RBCs travel into different daughter branches with different hematocrit levels. The blood–plasma separation can be qualitatively explained by considering the non-uniform RBC distribution in the parent channel, the deviation of RBC trajectories from the flow streamlines in the bifurcation region, the hydrodynamic interactions between the RBC and the channel inner wall, etc.
Despite the fact that the phenomena of blood flow in microcirculation has been studied for many years, several important aspects of hydrodynamic blood flow in diverging vessels remain unexplored [1, 10, 21], requiring a more fundamental study on the motion of RBCs in bifurcating microfluidic channels. Such studies could lead to better understanding of microvascular transport of RBCs in healthy and diseased states. Dynamic simulation can predict how blood flow behaves in microfluidic channels and by extension to microvascular networks. An investigation of the in vitro behavior of blood flow occurring in microfluidic channels is helpful in understanding the role of RBCs in oxygen delivery processes. Moreover, an insight into the details of flow behavior of individual RBCs taking place in complex microfluidic channels is necessary to develop skills in designing microfluidic devices for blood–plasma separation and is required to understand the asymmetry in RBC trajectories between the bifurcation and the confluence [10].
However, quantitative modeling of blood flow in microcirculation is difficult because of the huge number of degrees of freedom in modeling the RBC spectrin network and because of the hundreds of millions of particles to represent blood flow. Several computational approaches, including continuum- and particle-based numerical models [22–28], have been developed recently and applied to RBC simulations. They may qualitatively capture the mechanical properties of an individual RBC; however, it is still difficult to perform blood flow simulations because of prohibitively expensive computations. A systematic coarse-graining procedure, which reduces the number of degrees of freedom in the RBC model, has been presented in [29–31]. Two different RBC models, the multi-scale RBC (MS-RBC) [29, 30, 32] and the low-dimensional RBC (LD-RBC) [31, 32] models, have been developed and employed to conduct efficient simulations of RBCs in microcirculation. In particular, the LD-RBC model, which models one RBC as a closed torus-like ring of ten colloidal particles, allows the simulation of blood flow over a wide range of hematocrit levels (Hct) at computational costs that are considerably below those for the MS-RBC model.
The LD-RBC model offers a good method in investigating the in vitro behavior of blood flow in microfluidic channels. In this study, we present extensive simulations on the motions of RBCs for healthy and malaria-infected blood in Y-shaped bifurcating microfluidic channels. Our interest is in the demonstration of the bifurcation law in the microfluidic channel and in the prediction of particle flux distribution. We employ the dissipative particle dynamics (DPD) method, which is a Lagrangian method that can be derived from systematic coarse graining of molecular dynamics [33, 34]. It can scale efficiently to microvessels and can also be used to model the structure of RBCs down to the spectrin level [29–31, 35].
The rest of this work is organized as follows: section 2 describes the simulation method used and the RBC model employed. Section 3 presents and discusses the simulated results. Finally, section 4 summarizes the findings and presents relevant conclusions.
2. Model and method
We study the motions of RBCs in Y-shaped bifurcating microfluidic channels with the help of the LD-RBC model based on the DPD simulation technique. For completeness, the method and the model are briefly reviewed below, whereas details on the DPD method and the LD-RBC model are available elsewhere [31, 33]. Through the DPD approach, a RBC in this study is modeled as a ring of ten colloidal particles connected by worm-like chain (WLC) springs, see figure 1. Colloidal particles are simulated as single DPD particles, similar to the solvent particles but of a larger size. In the LD-RBC model, we adopt an exponential conservative force for colloid–colloid, colloid–solvent and colloid–wall interactions, whereas we keep the conventional DPD linear conservative force for solvent–solvent and solvent–wall interactions. Such hybrid conservative interactions produced colloidal particles disperse in solvent without overlap, which is quantified by calculating the radial distribution function of colloidal particles [33]. Exponential and linear conservative forces are defined as


where rij is the distance between two neighboring particles, and aij and bij are adjustable parameters for the strength of conservative force. In addition, rec and rlc are the cutoff radii of the exponential and the linear conservative forces, respectively. To construct the RBC model, however, we allow particles in the same cell to overlap, i.e. colloidal particles in the same cell still interact with each other through a soft linear conservative force. Following Pan et al [31], parameters related to the interaction between two DPD particles, including cell (denoted as C), solvent (denoted as S) and wall (denoted as W) particles, are summarized in table 1. The RBC diameter in DPD units is equal to D0 = 4.0. Therefore, one DPD unit of length corresponds to approximately 2.0 μm in physical units.
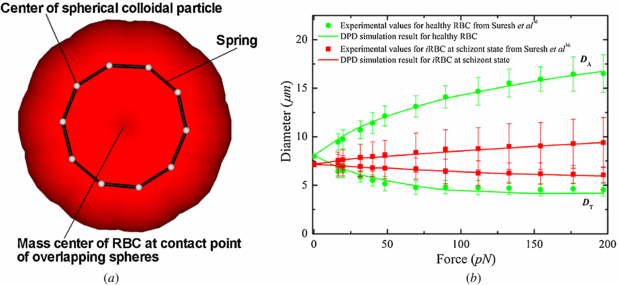
Figure 1. (a) A sketch of the low-dimensional closed torus-like RBC model. (b) RBC axial (DA) and transverse (DT) diameters under deformation for RBCs in healthy and diseased schizont states (reprinted with permission from [56]).
Download figure:
Standard imageTable 1. Parameters of the LD-RBC model in DPD simulations.
| Interactions | Feij (equation (1)) | Flij (equation (2)) | γ | rc |
|---|---|---|---|---|
| S–S | 2.5 × (1 − rij)0.25 | 4.5 | 1.5 | |
| S–W | 2.5 × (1 − rij)0.25 | 4.5 | 1.5 | |
| S–C |  |
900.0 | 1.5 | |
| C–W |  |
900.0 | 2.5 | |
| C–C (same cell) | 500.0 × (1 − rij)0.25 | 4.5 | 1.2 | |
| C–C (different cell) |  |
4.5 | 2.0 |
The WLC spring force interconnects all colloidal particles in each RBC and has the form

where λP and Lmax are the effective persistence length and the maximum length of the spring, respectively. The bending resistance of the LD-RBC model is introduced via an angular bending potential between two consecutive springs. The potential is expressed as

where kb and θ are the bending stiffness constant and the angle between two consecutive bonds, respectively. The bending force is then derived from

To probe the RBC mechanical response at different malaria stages, we subject the RBC to stretching deformation analogously to that in optical tweezer experiments. The stretching force is applied in opposite direction to two particles separated by the distance of one diameter of the ring. In a previous study, Pan et al [31] found that an increase of Nc results in better agreement but after Nc = 10, the change is very small. Here, we choose Nc = 10 to gain sufficiently good agreement and keep the computation cost low. In the LD-RBC model, λp determines Young's modulus and along with Lmax gives the right elastic properties of RBC. The bending stiffness kb is adjusted to match both axial and transverse RBC deformations, with experimental results being good agreement with the experimental data.
In the DPD approach, it is convenient to use reduced units. The unit of length is defined by the cutoff radius rc, the unit of mass by the masses of particles, while the unit of energy is defined by kBT. In this study, the values λP = 5.0 × 10⁻⁴ and Lmax = 2.6 μm are used for healthy RBCs. Regarding the elastic contribution to the interaction energy, the bending stiffness is given by kb = 50.0 kBT for healthy RBCs, which is approximately 2.1 × 10⁻¹⁹ J. This is a widely accepted value as the bending modulus experimentally measured lies between 1.0 × 10⁻¹⁹ and 7.0 × 10⁻¹⁹ J [37]. The fitted Young's modulus is 20.0 μN m−1, which is comparable with the experiments in [36] and the spectrin-level RBC model in [37]; see figure 1.
An external body force is exerted on each fluid particle to generate a hydrodynamic flow in the bifurcating microfluidic channel. In this study, an externally applied body force in the x direction of the fluid particles is of the form

where g is the magnitude of the body force, and xi is a vector unit in the flow direction.
The microfluidic channel, as illustrated in figure 2, has a bifurcation and a confluence. A wide channel with a length l0 = 400.0 μm and a width w0 = 40.0 μm is first created on the left side of the microfluidic system. The depth of the microfluidic channel is 10.0 μm for simulations of RBC flows and 20.0 μm for solid spherical particles. Both periodic and no-slip wall boundary conditions are applied in this direction for different simulations. Specifically, we apply the no-slip wall boundary condition in z direction and simulate the motion of solid spherical particles in bifurcations to test the attraction effect. For microfluidic experiments of blood–plasma separation, the ratio between the diameter of RBC and the depth of the microfluidic channel is small [2]. In the current study, the flow-rate ratio is introduced by varying the widths of the two daughter channels in the y direction. The simulations of blood flow in bifurcation microfluidic channel with the periodic boundary condition in the z direction can simulate the blood–plasma separation but the computational cost should be considerably lower than simulations with the no-slip wall boundary condition. Thus, in the majority of simulations we use the periodic boundary condition in the z direction; however, in a few simulations we also simulated the same systems with no-slip boundary condition along the span. The wide channel bifurcates into two narrow channels with varying widths (w1: w2) to introduce different flow-rate ratios, forming a Y-shaped channel. A mirror–image Y-shaped microfluidic channel with confluence is then created on the right domain of the microfluidic channel to satisfy the periodic flow assumption along the flow direction. No-slip boundary condition is applied at the solid wall to model blood flow in the microfluidic channel.
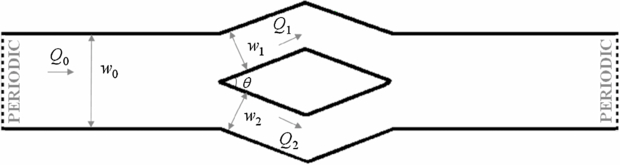
Figure 2. Schematic representation of the DPD domain. Q0 represents the flow rate of the parent channel, and Q1 and Q2 are the flow rates of the upper and the lower daughter branches, respectively.
Download figure:
Standard imageExtra care is taken in modeling the blood flow accurately in the bifurcating microfluidic channel. First, an extra bounce-back rule, i.e. the velocity of a DPD particle that collides with the wall is reflected back into the microfluidic channel, is applied to the fluid and colloidal particles to prevent them from entering the solid wall domain. Second, zero velocity at the solid wall is implemented by freezing multi-layers of DPD particles and keeping them at the same particle density as the fluid particles. Third, an adaptive boundary condition is adopted for each fluid particle to control their density fluctuations [38, 39]. Specifically, we employ multi-layered frozen DPD particles at the solid wall, and introduce a wall force acting on fluid particles to control particle density fluctuations close to the solid wall. The magnitude of the adaptive force depends on the distance of the fluid particles from the wall and is iterated according to the estimated density fluctuations. For more details on the implementation of the solid wall boundary, we refer to [38, 39].
The initial distribution of RBCs in the parent channel influences the blood–plasma separation efficiency. In order to evaluate the lateral migration of the RBCs, a distribution function is introduced to represent their spatial distribution along lateral positions (y-axis direction), which can be defined as follows:

where  is the number of RBCs between the lateral positions y and
  in the kth bin at a given condition, while
  is the total number of RBCs, summed over the channel width w0 and all the RBC bins. We note that f(y) is a distribution function representing the fraction of the number of RBCs between y and
  , such that
  = 1.0. In figure 3, we present plots of f(y) over w0 for Hct = 20.0%. We denote by ftarget(y) the desired distribution function obtained from the simulation of RBCs flowing in a microfluidic channel that has the same size with the parent channel; finitial(y) is obtained directly from the simulation of RBCs flowing in the bifurcating microfluidic channel and computed at a station near the extreme left end (here, xi = 100.0 μm is adopted). Compared to the desired f(y), the RBCs in the bifurcation have somewhat narrow distribution across the microfluidic channel, indicating RBC drift away from the channel wall so that the number of RBCs around the center of the channel is slightly increased.
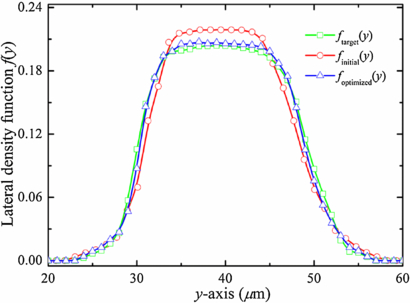
Figure 3. Optimization of the lateral distribution function of RBCs for Hct = 20.0%. ftarget(y) is the desired distribution function obtained from the simulation of RBCs flowing in a straight-only microfluidic channel that has the same size with the parent channel of bifurcation; finitial(y) is obtained directly from the simulation of RBCs flow in bifurcating microfluidic channel and computed at a station near the extreme left end (here, xi = 100.0 μm) and foptimized(y) corresponds to the distribution function after incorporating the lateral  acting on the RBCs.
Download figure:
Standard imageIn order to impose a RBC distribution in the parent channel equal to ftarget(y), we include an additional lateral force,  , on RBCs to redistribute them in the cross-flow (y-axis) direction. Specifically, the external lateral force acting on the RBCs is calculated according to
  . In the simulations, we assume that the desired f(y) values in the parent channel are equal at each station.
  is a constant of order 1, and w(y) is a weighting function, i.e. w(y) = exp ( − |y − yc|) designed to cause stronger deviations at small lateral distances from the location of the RBC centroid to the center of the parent channel (yc = 40.0 μm). At each time step, the lateral force
  is added to the RBCs at several different stations along the x-axis direction ranged from the confluence to the far right end of the microfluidic channel; specifically, we choose xi = 700.0, 800.0 and 900.0 μm in the current study. The corrected result is shown in figure 3; we see that the quality of the optimized solution (triangles) improves as it reproduces the target ftarget(y) curve.
The simulations are performed using a modified version of the atomistic code named LAMMPS [40]. The time integration of the motion equations is computed through a modified velocity–Verlet algorithm with  and time step
  , where τ is a characteristic time in DPD units. It takes 5.0 × 10⁷ time steps for a typical simulation performed in the current study. In terms of computing time, on average, it takes about 1.3 million CPU core hours for a typical simulation on the Blue Gene/P system at the Argonne Leadership Computing Facility (ALCF).
3. Results and discussion
3.1. Verification and validation for benchmark problems
To validate the results, first a single phase flow (without RBCs) in the bifurcating microfluidic channel is simulated and compared with a numerical Navier–Stokes (NS) solution, which is obtained using the (continuum-based) spectral element simulation solver NEKTAR [45]. Numerical simulations are carried out in a three-dimensional geometry representing the microfluidic channel used in DPD simulations. The mesh used in the simulations consists of quadrilateral elements. The Reynolds number is then calculated to help us evaluate the value of body force exerted on the fluid particles. From this simulation, we find that the simulated value of the Reynolds number at a body force of g ≃ 0.02 is a very close approximation to a typical experimental Reynolds number value of 0.01 [41]. Therefore, we have chosen the value, g ≃ 0.02, in the following simulations; this may change slightly in bifurcating channels with asymmetric daughter branches to keep a constant flow rate at the parent channel.
Figure 4 shows velocity profiles in the cross-flow (y-axis) direction at several different stations for both NEKTAR (continuum) and LAMMPS (atomistic) results. In figure 4, zero velocities at the wall, as well as quasi-parabolic (or flat plug-like) shapes of the velocity profiles are shown. There are no visible differences between the atomistic and continuum results.

Figure 4. Verification of DPD flow in bifurcating fluidic channel. Top: stations where velocity profiles of the DPD results and the NS solutions are compared. Bottom: velocity profiles of the DPD results and the NS solutions obtained for the center plane of bifurcating microfluidic channel at different stations. Blue and gray particles represent solvent and wall particles, respectively. For clarity, the solvent particles are not shown in the following figures.
Download figure:
Standard imageTo validate the DPD flow in microfluidic channel, we simulate the motion of a solid spherical particle through a cylindrical microfluidic tube under a hydrodynamic flow. A solid spherical particle is simulated as a single colloidal particle by adopting the exponential conservative force, as expressed in equation (1). In general, the transport of a solid spherical particle suspended in a fluid flowing through a cylindrical capillary has been reported in terms of two wall correction factors [42–44]. The first wall correction factor, K1, is defined as the ratio of the terminal falling velocity in a bounded fluid to that in an unbounded one. The second wall correction factor, K2, is a factor in the drag force on a stationary particle held in a flowing fluid. In this study, K1 is obtained for a solid spherical particle moving with constant velocity in a quiescent fluid as in sedimentation, and K2 is obtained for a fixed solid spherical particle in a Poiseuille flow. In figure 5, we show the wall correction factors, K1 and K2, and the lag factor, G = K2/K1, over a range of solid spherical particle to cylindrical capillary diameter ratios, p, obtained from the DPD simulations and compared with the NS–ALE model in [43] and analytical solutions in [42]. From figure 5, we find that our computed values of K1, K2 and G are in good agreement with those obtained by the NS–ALE model in [43] and analytical results in [42] for p ⩽ 0.8, where the maximum relative error is of the order of 5.0%. For example, the relative errors for K1 for p = 0.2 and 0.6 are 0.7% and 4.8%, respectively. The relative errors for K2 for p = 0.2 and 0.6 are 0.5% and 4.9%, respectively.
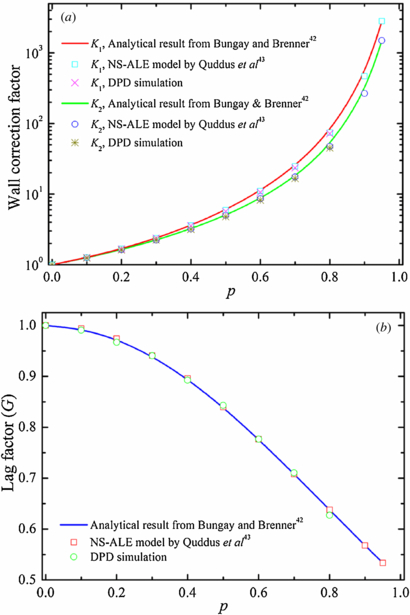
Figure 5. Validation of DPD flow in microfluidic tube by considering (a) wall correction factors and (b) lag factor for a solid spherical particle moving through a cylindrical microfluidic channel. p represents the ratio between the diameter of solid spherical particle and the diameter of the cylindrical microfluidic tube.
Download figure:
Standard image3.2. Validation of DPD flow in bifurcating microfluidic channels
The dependence of distribution of solid spherical particles in bifurcating microfluidic channels on flow-rate ratio between the two daughter branches is investigated next through DPD simulations. Here, we introduce some notation used in the following discussion. The flow rate at the parent channel is denoted by Q0, and Q1 and Q2 are the flow rates at the upper and lower daughter branches, respectively (see figure 2). N1 and N2 are the numbers of RBCs entering the upper and lower daughter branches, while N0 = N1 + N2 RBCs enter the parent channel. The ratio of N1/N0 describes the particle recovery efficiency. The flow-rate ratio, ϕd = Q1/Q2 = Q1/(Q0 − Q1), is controlled by the value of wd = w1/w2 by varying the widths of the two daughter branches. In this study, the ratio between the diameter of solid spherical particle and the width of the parent channel is chosen to p = 0.46, which is the same as the one used in experiments by Yang et al [2]. The width of the parent channel is w0 = 40.0 μm; hence, the diameter of solid spherical particles in the simulation is 18.4 μm.
The percentage recovery efficiencies of solid spherical particles with respect to flow distribution and/or flow-rate ratio between two daughter branches are shown in figure 6. For the 18.4 μm diameter solid spherical particles, 83.9% particle recovery efficiency is obtained for ϕd = 2.5. For ϕd = 6.5, a 97.8% particle recovery efficiency is obtained. This result is compared well with previous experimental observations [2]; see figure 6. Furthermore, 100.0% particle recovery efficiency is achieved using ϕd = 8.6.
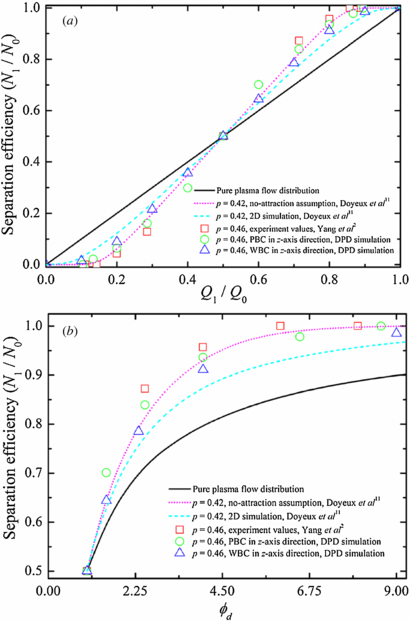
Figure 6. Validation of DPD flow in Y-shaped bifurcating channel by considering the solid spherical particles distribution N1/N0 with respect to (a) flow distribution Q1/Q0 and (b) flow-rate ratio ϕd between two daughter branches. p represents the ratio between the diameter of solid spherical particle and the width of the parent channel, and the symbols PBC and WBC represent the periodic boundary condition and wall boundary condition, respectively.
Download figure:
Standard imageIn the two recent two-dimensional theoretical studies, Barber et al [12] and Doyeux et al [11] found that a RBC in the vicinity of the pure flow separating streamline is attracted toward the low flow-rate branch due to the strong confinement in the z direction. Doyeux et al also showed that the attraction toward the low flow-rate branch is weak for spheres of radius R ≃ 0.5 or smaller. In particular, their experimental results suggested that particles of radius R ⩽ 0.3 behave like fluid particles. To evaluate the attraction effect, we simulate solid spherical particles in same geometric bifurcations but applying the no-slip wall boundary condition instead of the periodic boundary condition in the spanwise z direction; the results are also shown in figure 6. In these cases, the diameter of solid spherical particles in the simulation is 18.4 μm with the depth of the microfluidic channel d0 = 20.0 μm, resulting in a strong confinement in the z direction. Consistent with the theoretical results, more solid spherical particles enter into low flow-rate branch compared to those in bifurcations with the periodic boundary condition along the z direction, indicating that the attraction directs the solid spherical particles toward the low flow-rate branch. For example, for Q1/Q0 = 0.2, the particle recovery efficiency is around 6.4% and 8.9% for solid spherical particles in bifurcations with periodic and wall boundary conditions in the z-axis direction, respectively. The corresponding theoretical values are around 6.2% and 12.4% for p = 0.42 under the no-attraction assumption and with the attraction, respectively. For Q1/Q0 = 0.4, the value of N1/N0 shifts from 29.9% with the periodic boundary condition to 35.6% with the wall boundary condition along the z direction; it rises from 34.6% under the no-attraction assumption up to 37.2% with the attraction according to theory in [11]. In the study of solid spherical particles in bifurcations with the periodic boundary condition in the z direction, the confinement is the same in the y direction but quite weak in the z direction. Hence, there is no strong attraction effect and our simulation results are comparable with previous experimental observations [2] and also with theoretical predictions obtained under the no-attraction assumption [11]. In general, to improve particle recovery efficiency at lower flow-rate ratio, a higher p is needed, while a higher value of ϕd is required to increase particle recovery efficiency at a fixed ratio between particle diameter and channel width.
3.3. Motion of RBCs in bifurcating microfluidic channels
3.3.1. Effect of RBC deformability on blood–plasma separation
The blood–plasma separation depends on the RBC deformability. The malaria-infected RBCs (iRBCs) lose their deformability because of an increase in membrane stiffness [46]. Thus, blood flow may be significantly affected by altered RBC structural and mechanical properties occurring in malaria. According to a previous simulation study [31], the LD-RBC model is able to capture linear as well as nonlinear RBC elastic responses; see figure 1(b). Therefore, the developed LD-RBC model can be used for the simulation of blood flow in malaria. In making a comparison, we examine the motions of iRBCs in bifurcating microfluidic channels.
Blood flow in malaria is simulated as a mixture of healthy and malaria-infected RBCs. Specifically, we choose iRBCs at the final state (schizont). Parameters specified for modeling iRBCs are the same as those for healthy RBCs, except for the following three parameters: aii = 2750.0, λp = 5.0 × 10⁻⁵ and kb = 500.0 kBT. The LD-RBC model does not use the membrane shear modulus, and Young's modulus of the RBC membrane is determined by λp and kb. According to a previous simulation study by Pan et al [31], the proper fitting Young's modulus is 20.0 μN m−1 and 199.5 μN m−1 at kb = 50.0 kBT and 500.0 kBT for RBCs in healthy and diseased schizont states. These values are in agreement with the values obtained in experiments in [36] and the spectrin-level RBC model in [37]. The adopted value of kb = 500.0 kBT for iRBCs at the schizont stage is thus ten times larger than kb = 50.0 kBT for healthy RBCs, which is used for characterizing the membrane stiffness of iRBCs at the schizont stage.
The percentage of iRBCs, with respect to the total number of RBCs in a unit volume, is the parasitemia level. In the current study, we do not try to relate the simulation results to any clinical blood tests. Instead, we aim to span the full range of the parasitemia levels to evaluate their influence on particle recovery efficiency of blood flow. At low parasitemia levels, the differences in measured properties may be small and difficult to detect. Thus, the parasitemia levels employed here are higher than those used in typical experimental blood tests.
DPD simulations are performed where RBC deformability is reduced by incorporating healthy RBCs within three different parasitemia levels (0.0%, 50.0% and 100.0%). Figure 7(a) shows separation efficiencies of healthy RBCs and iRBCs with respect to the width ratio between the two daughter branches. At a fixed value of wd, separation efficiencies of iRBCs are lower than those of healthy RBCs. As described by Hou et al [4], stiff iRBCs are less compliant to the hydrodynamic force andundergo migration toward the side wall under physiological conditions. Thus, healthy RBCs within a bifurcating microfluidic channel tend to have equilibrium positions closer to the center of a bifurcating microfluidic channel than iRBCs do. This means that highly deformable healthy RBCs are not distributed uniformly across the bifurcating microfluidic channel as expected of stiff iRBCs, but they are distributed closer to the middle of a bifurcating microfluidic channel, yielding even higher volume fractions in the wider daughter branch than iRBCs.
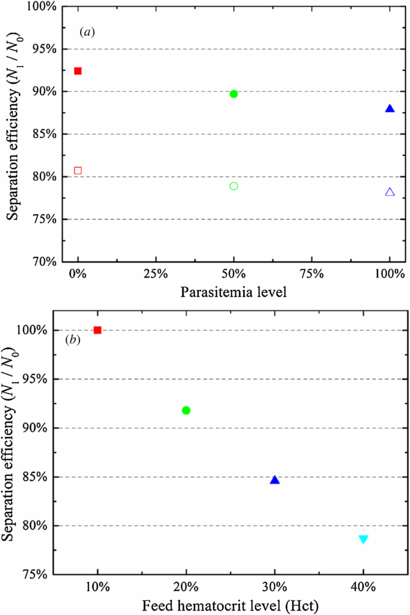
Figure 7. (a) Separation efficiency of a mixture of healthy and malaria-infected RBCs at different parasitemia level for wd = 3.0 (solid) and 5.4 (empty). (b) Separation efficiency of healthy RBCs at different feed hematocrit level for wd = 3.0.
Download figure:
Standard image3.3.2. Effect of feed hematocrit distribution on blood–plasma separation
The blood–plasma separation effect also depends strongly on the hematocrit distribution of RBCs in the parent channel [3, 13, 16, 17] and the trajectories of individual RBCs [12]. To illustrate this effect, the motion of RBCs flowing in a bifurcating microfluidic channel is simulated by changing the feed hematocrit level. Figure 7(b) shows the particle recovery efficiency with respect to the feed hematocrit level. In agreement with the Zweifach–Fung effect, the particle recovery efficiency increases with a decrease in Hct at a fixed wd. When blood becomes dilute, the flow velocity gradient in the cross-flow direction is expected to increase, enhancing the migration of RBCs toward the center of the microfluidic channel and hence increasing the CFL thickness.
To quantify blood–plasma separation, we also compute the CFL thickness of blood flow in bifurcating microfluidic channels. CFL has been an attractive topic in the study of RBCs, using straight microfluidic channels or microfluidic tubes between 10.0 and 100.0 μm [47–52]. In microcirculation, the CFL thickness is significant with respect to microvessel diameter, resulting in a large relative apparent viscosity. According to previous computational studies [53, 54], the CFL thickness h is computed as the time-averaged distance from the location of the outer edge of a RBC core to the channel wall. The edge of RBC core is determined by the position of outmost RBCs and is averaged over all the snapshots taken after the flow has reached steady state. Discrete samples of h from the obtained curves are taken every 0.5 μm along the flow direction. Also, we calculate the mean CFL thickness over 5.0 × 10⁶ time steps after the flow has reached steady state; the relative deviation of mean CFL thickness for two different integration times is relatively small. We find that the simulated CFLs are consistent with the predictions of Fahraeus effect, that is the thickness of CFL is wider for lower Hct, indicating migration of RBCs to the channel center.
The CFL thickness on the parent channel wall, h, with respect to the feed hematocrit level, Hct, is shown in table 2. The thickness of CFL increases with a decrease in feed hematocrit, which means that the migration of the RBCs toward the midplane of the channel is enhanced; thus, more RBCs travel into the high flow-rate daughter branch. From table 2, we find that 78.7% particle recovery efficiency is obtained for h = 2.14 μm for wd = 3, which increases to 84.6% and 91.8% for h = 2.78 and 4.13 μm, and 100.0% particle recovery efficiency is achieved for h = 5.47 μm. These results demonstrate that a thicker CFL leads to enhanced plasma skimming and the feed hematocrit level and its distribution in bifurcating microfluidic channel play a significant role in blood–plasma separation.
Table 2. CFL thickness in the parent channel and separation efficiency of RBCs at different feed hematocrit level for wd = 3.0.
| Feed hematocrit level (Hct, %) | 10.0 | 20.0 | 30.0 | 40.0 |
|---|---|---|---|---|
| CFL thickness (h, μm) | 5.47 | 4.13 | 2.78 | 2.14 |
| Separation efficiency (N1/N0, %) | 100.0 | 91.8 | 84.6 | 78.7 |
In order to provide a more quantitative account, we measure the thickness of CFL around the bifurcation. Figure 8 shows the CFL thickness on the inner and outer walls of the wider daughter branch. We see that the CFL thickness increases on the outer wall after the bifurcation, while it decreases dramatically to a small value (close to zero) on the inner wall. This result is consistent with previous observation that the CFL disappeared on the inner wall of the bifurcation for RBCs flow in microfluidic channel with geometrically symmetric bifurcation and confluence [10].
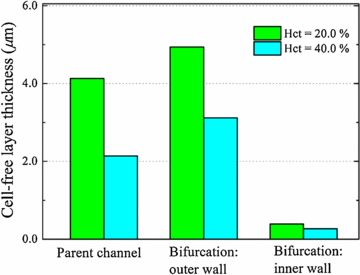
Figure 8. Measured thickness of CFL around the branch point of the bifurcation at two different feed hematocrit levels for wd = 3.0.
Download figure:
Standard imageIn a recent experimental study, the effect of RBC aggregation on CFL formation in arterioles was investigated by Ong et al [55]; they showed that the CFL formation in arterioles is enhanced by the RBC aggregation. The effect of RBC aggregation on modeling of plasma skimming in bifurcations was recently studied by Chesnutt and Marshall [20]; they found that aggregation does not significantly affect plasma skimming. An aggregation LD-RBC model has been recently developed and employed to capture blood flow behavior by Fedosov et al [32]. Here, explicit aggregation models of RBCs are not included in our DPD simulations—this may be investigated more systematically in future studies.
3.3.3. Trajectories of individual RBCs
A more direct means of tracking the motion of individual RBCs is given by observing the coordinate position of these RBCs with the time development. We simulate the trajectories of individual RBCs downward from the pure plasma flow separating streamline; see figure 9. These trajectories of individual RBCs show that they deviate from the streamline of the pure plasma flow probably due to the chaotic motion of RBCs caused by cell–cell interactions and flow perturbations near the branch point of bifurcation. The RBC has a maximum diameter of 8.0 μm for a microfluidic channel width of 40.0 μm; the ratio between the diameter of RBC and the width of the parent channel is not more than 0.2, and we apply the periodic boundary condition in the third (z-axis) direction. Thus, for such a small confinement system, there is no strong attraction effect, and the blood–plasma separation efficiency is mainly influenced by the initial distribution of RBCs in the parent channel and the interactions between particles.

Figure 9. (a) Illustration of the distance between the branch point of the bifurcation and the parent channel wall. (b) Paths displacement of individual RBCs flowing in bifurcating microfluidic channels for wd = 3.0.
Download figure:
Standard imageWhen a RBC approaches the branch point of the bifurcation, it will travel into the wide daughter branch if its centroid is beyond the pure plasma flow separating streamline; however, it will travel into the narrow daughter branch if its centroid is within the pure plasma flow separating streamline. Thus, at a given width ratio between the two daughter branches, if all the centroids of RBCs are beyond the pure plasma flow separating streamline, then almost all RBCs travel into the wide daughter branch, and none or only few RBCs travel into the narrow daughter branch, i.e. the all-or-nothing phenomenon occurs.
3.3.4. Comparison with experimental results on blood–plasma separation
How do RBCs decide which branch to take when they go through a bifurcating region? It is known that the RBC volume fractions in the two daughter branches are not equal and the volume fraction of RBCs increases in the high flow-rate branch; however, to the best of our knowledge, no other models have been used to accurately predict the degree of skimming that will occur by incorporating the cell–cell interactions. The LD-RBC model, which models a RBC as a closed torus-like ring of ten colloidal particles, allows to consider a large number of RBCs. In order to provide a more quantitative insight into the characteristics of the separation behavior of RBCs and evaluate the minimum flow-rate ratio required for complete RBC separation from the whole blood at different hematocrit levels, we investigate the particle recovery efficiency with respect to the flow-rate ratio between the two daughter branches and employ existing experimental results for comparison.
To measure the flow rate in each daughter branch, we first count the number of RBCs and fluid particles passed through two given stations perpendicular to the flow direction for a period of time. Specifically, Q1 is determined at station c (see figure 4) and its mirror station, whereas Q2 is determined at station b (see figure 4) and its mirror station. The effective flow rate is then obtained by the average of the volume of the total number of counted RBCs and fluid particles divided by the time. Figure 10(a) shows particle recovery efficiency as a function of the effective flow-rate ratio ϕd, eff between the two daughter branches. In all the curves, the value of N1/N0 is larger than the one predicted by the pure plasma flow distribution, which is precisely the bifurcation law. The results also show that, for each hematocrit level, the particle recovery efficiency steadily increases when ϕd, eff increases. Consider blood flow at Hct = 20.0% for example: 67.1% particle recovery efficiency is obtained for ϕd, eff ≃ 1.4, which increases to 85.6% and 95.7% for ϕd, eff ≃ 2.2 and 3.1, respectively; particle recovery efficiency further increases to approximately 100.0% for ϕd, eff ≃ 4.5. These results demonstrate that the blood–plasma separation effect is determined by the effective flow-rate ratio, that is the larger the effective flow-rate ratio, the higher the particle recovery efficiency. The minimum effective flow-rate ratio increases with the increase of the hematocrit level: for Hct = 10.0%, 100% particle recovery efficiency is achieved for ϕd, eff ≃ 3.8, while 4.5 and 5.3 flow-rate ratios are required to obtain 100% particle recovery efficiency for Hct = 20.0% and 30.0%, respectively. By further increasing the hematocrit level Hct = 40.0%, the minimum effective flow-rate ratio is expected to be further increased, that is a minimum effective flow-rate ratio of ϕd, eff ≃ 7.1 is needed to obtain complete RBC separation from whole blood.
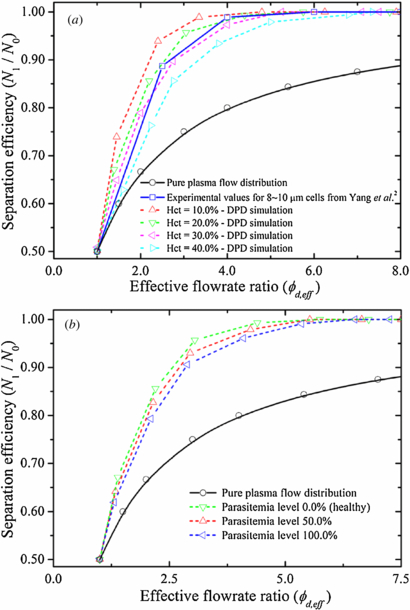
Figure 10. Separation efficiency of healthy and malaria-infected RBCs with respect to effective flow-rate ratio, ϕd, eff, between the two daughter branches. (a) Separation efficiency of healthy RBCs at different feed hematocrit level. (b) Percentage recovery efficiencies of a mixture of healthy and malaria-infected RBCs at different parasitemia level.
Download figure:
Standard imageFigure 10(b) shows particle recovery efficiency of healthy RBCs and iRBCs with respect to the effective flow-rate ratio between the two daughter branches. At a fixed value of ϕd, eff, particle recovery efficiency of iRBCs is lower than that of healthy RBCs. This is because the iRBCs lose their deformability due to the increase in membrane stiffness. The minimum effective flow-rate ratio for 100% particle recovery efficiency increases with the increase of the parasitemia level; for Hct = 20.0%, 100% particle recovery efficiency is achieved for ϕd, eff ≃ 4.5, 5.1 and 5.9 at parasitemia level equal to 0.0%, 50.0% and 100.0%, respectively. These results would be helpful to develop proper guidelines in designing microfluidic devices for the separation of RBCs from the whole blood.
4. Conclusions
We have studied the motion of red blood cell (RBC) flow in bifurcating microfluidic channels via a low-dimensional RBC (LD-RBC) model based on dissipative particle dynamics (DPD). No-slip wall boundary and adaptive boundary conditions were included in the modified DPD approach to model hydrodynamic flow for a specific wall structure of a bifurcating microfluidic channel controlling particle density fluctuations. The DPD simulation results are used to predict the RBC flux in bifurcating microfluidic channels and their dependence on the deformability of RBCs and the feed hematocrit level of blood. Our results show that the deformability of RBCs has a considerable influence on blood–plasma separation in that separation efficiencies of stiff iRBCs are lower than those of healthy RBCs. The blood–plasma separation effect is also demonstrated to strongly depend on the feed hematocrit level of blood; the particle recovery efficiency increases with a decrease in feed hematocrit level. The plasma skimming effect of RBC flow in bifurcating microfluidic channels has been demonstrated in DPD simulations, and the all-or-nothing phenomenon has been observed in a higher width ratio between the two daughter branches. These findings demonstrate that the LD-RBC model is an effective (relatively simple) model for understanding and quantifying the in vitro behavior of RBC flow in bifurcating microfluidic channels.
Acknowledgments
We thank the three anonymous referees whose critical comments helped us in improving the quality of our manuscript. This work was supported by the National Institutes of Health Grant R01HL094270 and the National Science Foundation (NSF) grant CBET-0852948. Simulations were carried out at NSF's National Institute of Computational Sciences at the University of Tennessee facility and the Argonne Leadership Computing Facility through the Innovative and Novel Computational Impact on Theory and Experiment program at Argonne National Laboratory. ASP is a consultant at Brown University under R01HL094270.