
Abstract
Particle tracking experiments with high speed digital microscopy yield the positions and trajectories of lipid droplets inside living cells. Angular correlation analysis shows that the lipid droplets have uncorrelated motion at short time scales (τ < 1 ms) followed by anti-persistent motion for lag times in the range of 1 ⩽ τ ⩽ 10 ms. The angular correlation at longer time scales, τ > 10 ms, becomes persistent, indicating directed movement. The motion at all time scales is associated with the lipid droplets being tethered to and driven along the microtubule network. The point at which the angular correlation changes from anti-persistent to persistent motion corresponds to the cross over between sub-diffusive and super diffusive motion, as observed by mean square displacement analysis. Correct analysis of the angular correlations of the detector noise is found to be crucial in modelling the observed phenomena.
Export citation and abstract BibTeX RIS
1. Introduction
The dynamics of cargoes inside live cells is of critical importance to their cellular function and thus to a vast range of biophysical questions. Advances in the temporal and spatial resolution of optical instruments alongside advances in software analysis now provide a huge amount of information on cargo trafficking inside cells over a wide range of time scales. The challenge to interpret this new information is to be able to model the motion of the organelles as they experience myriad interactions inside the congested environment of the cell. A wide range of statistical tools have historically been applied to analyse the fluctuating motion of cargoes, including segmented velocities, turning angles and displacement probability distribution functions [1–4]. The first passage probability was recently used on particle tracking data and proved to be particularly useful for calculating unbiased estimates of cargo speeds and allowed us to test competing models for sub-diffusive motion [5]. However, first passage probability and mean squared displacements (MSDs) are both insensitive to the directed motion of cell cargoes. We thus investigated a measure of a particle's directed motion, the angular correlation function [6, 7], for intracellular motion in live cells. The angular correlation function is known to be sensitive to persistent motor driven motion, but here we combine this analysis with high speed imaging to investigate its ability to resolve caged motions of the cargoes inside the dense cellular environment.
In complex fluids the MSD of a probe particle is commonly used to determine the dynamics of a material that is undergoing stochastic fluctuations (glasses, actin networks, bacterial motion etc). The motion of intracellular vesicles when analysed using MSD techniques shows run-rest motion with two distinct time regimes that can be described using a power law relation [8–11],
where r(t) is the position of the particle at time t and the value of α characterizes the motion that the probe experiences, and 〈⋅⋅⋅〉t denotes a time averaged mean. The short time regime describes sub-diffusive motion, where 0 < α < 1, and the long time regime is where the motion is super-diffusive, i.e. α > 1. The origin of the sub-diffusive regime is still debated. It could be due to caged motions inside the cytoskeletal mesh, fractal Brownian motion, viscoelastic phenomena or a combination of these processes. There are consequently a wide range of theoretical models that can predict sub-diffusive exponents [12], and more detailed experimental studies are needed to differentiate between the different possibilities. Measurement of the MSD, however, does allow caged motion to be distinguished from tethered motion. We therefore calculate both the angular correlation function and the scalar product auto-correlation function to determine the type of sub-diffusive motion displayed by intracellular lipid droplets. Angular correlations of organelles in live cells have been studied previously at fairly slow data acquisition rates [2, 10, 13]. Similar studies using angular correlations have also proven successful in determining the dynamics of single cells on surfaces and the crawling of single celled micro-organisms [14]. However, errors due to the angular noise on the detector were not considered in detail by previous studies. Careful calibration indicates that the negatively correlated angular motion of intracellular organelles at short time scales, attributable to anti-persistent motion, disappears at the shortest time scales when the effect of anti-correlated detector noise is corrected for. However anti-persistent motion continues to be observed at intermediate time scales in our data sets.
Here, we have studied the scaling of the corrected scalar product auto-correlation function with lag time and have used it to explore the predictions for the origin of sub-diffusive motion observed in cells at short time scales.
The scalar product auto-correlation function  , or SAF, is the mean of the scalar product of the trajectories moved by a single tracked particle during lag time τ for all positions in time t. The trajectories
  and
and  with lag time τ are defined as,


As such the SAF can be expressed as,

where i ≠ j and θ is the angle between the two trajectories,  and
and  [6, 7]. The subscript t on the ensemble averages will be omitted from here onwards for clarity and is implied for the ensemble averages described hereafter. The SAF can be manipulated to obtain the angular correlation function 〈ϕ(τ)〉,

The angular correlation function, unlike the SAF, yields unambiguous information on the angular direction of the trajectories. If 〈ϕ(τ)〉 ∼ 0 there is no persistent motion or preferred change in direction at the time scale, τ, or equivalently the angle between all trajectories is a randomly distributed variable between 0 and 2π, characteristic of Brownian motion. If the angular correlation function falls in the range −1 ⩽ 〈ϕ(τ)〉 < 0 then the angle between trajectories corresponds to a range of π/2 < θ < 3π/2, indicating anti-persistent motion which would be characteristic of caged or tethered motion of the particle; and if the angular correlation function falls in the range 0 < 〈ϕ(τ)〉 ⩽ 1 then the trajectories show directed/persistent motion typical of motor driven transport.
By comparing the MSDs of the motion of a particle and examining the corresponding time regimes (τ) of the angular persistence, more detailed information can be determined on the type of sub-diffusive and super-diffusive motion that is observed.
2. Materials and methods
The experimental arrangement consisted of an Olympus IX71 microscope set up for bright field imaging. It was mounted on an active correction table to remove vibration from external sources and had a response time faster than the image acquisition rates used. The light source used was a LED (CoolLED PE-100) that had a wavelength of 525 nm with a band-width of approximately 19 nm. The collimated light was focused by an Olympus water immersion condenser (NA ∼ 0.9) which helped to increase the light intensity illuminating the region of interest in the sample. A ×100 PLAN FLN oil immersion objective lens (NA = 1.3) created images of the samples which were captured by a Photron PCI 1024 CMOS camera (1–105 fps). Imaging of cultured cells was performed at 37 °C and latex beads at 21 °C. Movies were captured over an area of 256 × 256 pixels with a spatial resolution of 0.167 μm pixel−1 and a frame rate 10 000 fps for a maximum duration of 10 s.
Calibration samples consisted of latex beads either suspended in distilled water or beads stuck to a cover-slip. Cultured MRC-5 cells (human infantile lung cells) were used for the main experiment.
To obtain calibration movies, latex beads with radius a = 250 nm were suspended in distilled water. An aliquot was placed in the cavity of a glass bottomed dish (MatTek, Ashland, MA) with cavity diameter of 20 mm. The cavity was covered with a cover-slip and made watertight by sealing the edges with nail varnish. The dish was filled with distilled water and the suspended particles imaged at a height of approximately 10 μm above the cover-slip. A second sample was prepared and, prior to sealing, was placed in a vacuum oven and left under vacuum at a temperature of 50 °C for 12 h until the water was completely evaporated. The sample was sealed and the dried beads resting on the cover-slip were imaged.
MRC-5 cells were chosen for their comparative flatness and their abundance of lipid droplets. Lipid droplets were chosen for tracking due to their high contrast under bright field imaging and their regular shape. Furthermore they could be readily dyed using Nile Red fluorescent staining to verify their origin (data not shown). Cells were cultured in 5% CO2 at 37 °C in Dulbecco's Modified Eagle Medium (DMEM) with 10% foetal bovine serum, L-glutamine, antibiotic (pennicillin: streptomycin) and non-essential amino acids. Samples were plated to have a minimum confluency of ∼50% during imaging. They were transferred from DMEM medium into Hams F12 medium with 10% foetal bovine serum prior to each experiment.
All movies were analysed using PolyParticleTracker [15], a matlab (TheMathWorks, USA)-based particle detection and tracking software, to determine the motion of lipid droplets within the cells. The software determines the particle position using a two-dimensional fourth order polynomial fit to the intensity that is weighted by a Gaussian function centred on the particle and is relatively insensitive to background light levels. The tracking software is thus ideal for the inhomogeneous optical environment of the cell [15]. The software was further adapted to cope with the large size of the data sets (∼100 000 frames) and to take advantage of multi-core processing available on modern commercial computers. Positions were measured to a resolution of 5–10 nm, dependent on the size and optical contrast of the latex beads/lipid droplets. The tracks from these were preselected such that only those that had duration longer than 0.1 s would be retained for further analysis. Of these preselected tracks >90% had motion that was directed towards the cell nucleus and were thus most likely dynein driven.
3. Results and discussion
3.1. System calibration
To calibrate the system noise, samples of fixed latex particles (a = 250 ± 12 nm) were imaged and tracked. The MSD, SAF and angular correlations were then calculated. The positional variance on a sample of 140 latex particles was found to be 9.67 ± 0.12 nm and was symmetric around the x and y axes. The MSD and SAF were found to have a small 150 Hz noise signal embedded within them, attributed to ambient vibrations in the laboratory. This was removed using standard Fourier techniques. The MSDs had a short time intercept of 6.72 ± 0.43 × 10⁻⁵ μm2 (data not shown), which places a lower limit on the spatial resolution of the tracked particle trajectories in the range of ∼8–9 nm. Such short time intercepts are well documented [16]. Accordingly the calculated standard errors in figures 1 and 2 are comparatively small (∼10%) and the primary source of error comes from taking the mean of several trajectories. The SAF also showed an intercept at short times, corresponding to a value of −1.7 ± 0.8 × 10⁻⁵ μm2 (data not shown), which shows that at short time periods the noise in the measurement system is anti-correlated. This unexpected behaviour appears to be intrinsic to the performance of the detector that is used, and was observed with all the CMOS detectors we explored.
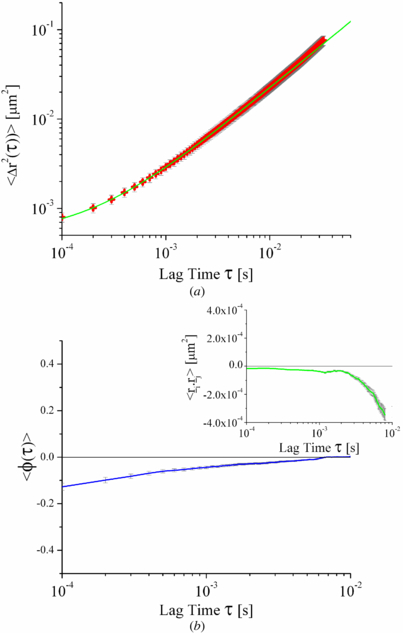
Figure 1. (a) Mean square displacements as a function of lag time of diffusing particles with radius a = 250 nm showing the short time intercept associated with detector noise of the experimental set-up. Red crosses are experimental data with associated standard errors in grey and the green line is a power law fit to the data α = 0.95 ± 0.01. (b) Corresponding angular correlation function with scalar product autocorrelation function (inset) for the same particles, both showing a short time intercept associated with the detector noise. Associated standard errors in the angular correlation function and SAF are shown in grey.
Download figure:
Standard image
Figure 2. (a) Mean square displacements as a function of lag time of diffusing latex particles in water with radius a = 250 nm and the short time intercept removed with associated standard errors shown in grey and a power law fit with α = 0.95 ± 0.01 as the green line. (b) Corresponding angular correlation function with scalar product auto-correlation function (inset) for the same particles, both showing the short time intercept no longer present. Again associated standard errors in the angular correlation function and SAF are shown in grey.
Download figure:
Standard imageTo determine if such noise signals would be present in a system displaying motion, and not exclusively in a static system, a colloidal dispersion of latex beads was analysed. The dispersion of latex spheres had a volume fraction ≪0.01 to ensure that there were as few inter-particle interactions as possible whilst maintaining a sufficiently large sample population. Seventy particles with track durations of 0.01 s or longer were measured and their MSDs, SAFs and angular correlations calculated and an ensemble average calculated (figure 1). Again a short time intercept was found in the MSD and SAF, corresponding to 7.96 ± 0.39 × 10⁻⁴ μm2 and −1.64 ± 0.16 × 10⁻⁵ μm2 respectively. The MSD of the particles shows a linear region in the range 10−3 < τ < 10−2 s, whilst at shorter times the MSD becomes nonlinear and reaches an asymptotic value with an amplitude on the order of that which was found for the fixed bead experiments (figure 1(a)). Application of the Stokes–Einstein–(Sutherland) relation 〈Δr2(τ)〉 = 4D2Dτ to the linear part of the MSD allows the two dimensional diffusion coefficient, D2D to be calculated. From this the viscosity of the water, η, can be measured using the relation,

where kb is the Boltzmann constant and T is the temperature of the system. As water is a Newtonian liquid the bulk and micro-viscosities should be equivalent. The micro-viscosity of the distilled water measured by the diffusion of the beads was found to be 0.97 ± 0.05 mPa s, which is within error of the value in the literature [17] of 1.03 mPa s for water at 21 °C. This shows that there is no systematic displacement noise present at longer time scales.
The SAF and the angular correlation function both show a deviation from Brownian motion for the same short time period as the nonlinear behaviour in the MSD. Equation (4) shows that the short-time noise term on the SAF is not solely an artefact of the determination of the length of the trajectories. There is also a contribution to the noise in the directional component between the two trajectories (the cos θ term). The angular correlation, however is independent of the noise on the magnitude of the component trajectories, so any noise will be solely due to the error in determining the angle between the two trajectories. The source of the short time noise in the SAF can be considered theoretically by adding a randomly fluctuating displacement noise term to both equations (2) and (3) (trajectories with noise denoted by '),
where  and
and  are random displacements. The scalar auto-correlation function with the displacement noise included is then,
The ensemble average of the middle two terms in equation (9) are zero since the displacement noise is assumed to be uncorrelated with the motion of the particles and equation (9) becomes,

Substitution in equation (5) gives,
Considering the  term and replacing with equations (2) and (3) in the limit of τ → 0 where
  and
and  will become convergent to each other for sufficiently long times,
Assuming that the displacement noise is statistically self similar  and applying the conditions used in (12),
and by the same arguments used in the derivation of equations (9) and (13) can be written in the form,
Accordingly when there is noise present in the system equation (1) becomes,
which in the absolute limit of τ = 0 the MSD is 〈Δr2(τ = 0)〉 = 0 resulting in,

which corresponds to the intercept found in figure 1(a). Similar corrections to the MSD have been reported in [18–20].
For a Brownian particle undergoing free diffusion  and equation (10) becomes,

corresponding to the intercept in SAF in figure 1(b). With this condition and the limiting case of τ → 0 outlined in equations (12)–(16), equation (11) becomes,
where both the numerator and denominator are finite constants which for simplicity will be referred to as c' and k' respectively,
Confining ourselves to the short time limit τ → 0 equation (5) can be re-written in terms of equations (4) and (12),
and by substitution of equations (10), (15) and (20),
In the long time limit τ ≫ 0 the SAF  since
since  and no correction is required. No correction is required for the MSD in the long time limit as
  and
and  can no longer be considered to be convergent to each other and
  . Therefore the angular correlation can be calculated as,
Treating the diffusing beads using the method outlined in equations (7)–(23), the intercept found in the angular correlation function is removed and the behaviour expected for Brownian motion is obtained; 〈ϕ(τ)〉 = 0 (figure 2(b): see supporting material figures S14–16 for further details (available from stacks.iop.org/PhysBio/10/036002/mmedia). The effects on the MSD and SAF at short times due to the finite size of the read-out time of the camera has been ignored, as the change to the MSD calculated by the subtraction of k' has been calculated for this system elsewhere [20] and was found to offer negligible improvement to the MSD. The negative correlations in the SAF at long times in figure 2(b) inset are due to the finite length of the movies. They are in fact of very small amplitude (∼200 nm2), comparable to the fluctuations in the MSD at a similar time scale and are only visible here because the y axis is not on a logarithmic scale. Given that the fluctuations come about because of the contribution of the length of the vectors used to calculate the SAF, the level of directed motion at long time scales can be difficult to determine. In contrast the angular correlations have no distance component and are therefore an unambiguous measure of the directed motion of tracked particles and are used exclusively in the next section. A detailed description for how the standard errors on all material can be found in the supplementary material (available from stacks.iop.org/PhysBio/10/036002/mmedia).
3.2. Live cell experiments
A total of ∼200 tracks of lipid droplets in MRC-5 cells were selected for analysis that had a duration of >0.1 s with the majority directed inwards. For tracks with the shortest durations, it was difficult to determine whether motion was directed or instead was random/Brownian. Exemplar tacks can be found in the supporting material (figures S1–8, available from stacks.iop.org/PhysBio/10/036002/mmedia). Examination of the long directed tracks show that at short time scales the motion can be mistaken for Brownian when inspected by eye (see supporting material figures S9–13, available from stacks.iop.org/PhysBio/10/036002/mmedia). For these reasons short tracks (durations ∼0.1 s) that appeared to be consistent with Brownian motion were included in the analysis so as not to bias the analysis in favour of long movements.
The motion of these tracks was analysed and their individual MSDs (figure 3 inset), SAFs (SAF data not shown) and angular correlations (figure 5) were calculated. The MSDs and angular correlations show two distinct regimes that have corresponding time scales. The two time regimes are most clearly seen in the ensemble averages for the two analyses, figures 3 and 5, respectively. At short times (10−4 < τ < 10−2 s) the MSDs display sub-diffusive behaviour with 0 < α < 1 and the angular correlations show no directed motion. At long times (τ > 10−2 s) the MSDs show super-diffusive behaviour with α > 1 and the angular correlations show that on this time scale the lipid droplets have directed motion. The super-diffusive and directed behaviour of individual particles in live cells has been observed previously [8, 9, 11] but the two phenomena have not been explicitly shown to be on the same time scale. The directed super-diffusive motion is attributed to the co-ordinated activity of motors working to move the lipid droplet or vesicle in a specific direction.
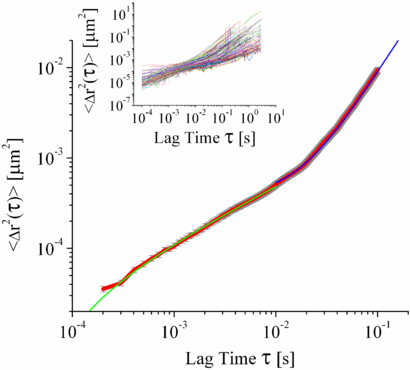
Figure 3. Ensemble average of the mean square displacements, red line, standard error bars in grey of the individual lipid droplets in MRC-5 cells as a function of lag time, showing initial sub-diffusive behaviour (green line of best fit α = 0.58 ± 0.01) followed by a period of super diffusive behaviour (blue line of best fit α = 1.74 ± 0.01). MSDs of the ∼200 individual tracks that make up the mean are shown in the inset.
Download figure:
Standard imageDetailed examination of the MSDs shows that a large number of lipid droplets display this shift from sub-diffusive to super-diffusive behaviour. Accordingly, power law fits were made to ∼200 such tracks and the probability distributions of the power law indices were calculated (figure 4). The motivation for this statistical analysis of the power law indices was that previous studies [8, 9, 11] have generally been made with much smaller population samples (∼5–20 samples) and it has not been possible to calculate the relative frequencies of the different types of motion. The distributions of the indices for the two regimes are Gaussian, with the sub-diffusion exponents peaking at αs = 0.6 and super-diffusion exponents peaking at αl = 1.6, with standard deviations of σs ∼ 0.30 and σl ∼ 0.60 respectively. This is consistent with the mean values found in [8, 9, 11]. The source of this cross-over in behaviour is believed to be associated with the lipid droplets being vectorially driven along the cell's microtubules by motors. If the motors are inactive one would expect sub-diffusive exponents as the lipid droplet would be tethered to the microtubule and would not be able to diffuse freely. This type of motion has been simulated in two dimensions and the resultant MSDs, SAFs and angular correlations can be found in the supporting material (figures S17–19) (available from stacks.iop.org/PhysBio/10/036002/mmedia). This type of motion would likely occur at short time scales corresponding to the typical time between steps of the engaged motor.
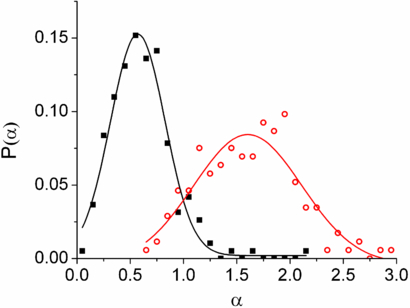
Figure 4. Probability distributions of the measured power law indices of the MSDs for lipid droplets in live cells. Black squares and red open circles correspond sub-diffusive (10−4 < τ < 10−2 s) and super diffusive (τ > 10−2 s) time scales respectively. Solid lines are Gaussian fits to the data.
Download figure:
Standard imageThe angular correlations for the sub-diffusive time regime 10−4 < τ < 10−2 s (figure 5) reveals two distinct components of non-directed motion. For time scales τ < 10−3 s the angular correlation is 〈ϕ(τ)〉 ≈ 0, which was shown in figure 2(b) to be indicative of Brownian motion. However, the MSDs show that the motion is in fact sub-diffusive and so on this time scale the lipid droplets are undergoing a form of anomalous Brownian motion. This type of uncorrelated sub-diffusive motion has been described as being Brownian motion on a fractal [6, 12, 21] and is consistent with other studies [5]. For the remaining period of sub-diffusive motion, (10−3 < τ < 10−2 s), the lipid droplets have anti-persistent motion. By propagating the errors of the values used in equation (22) the error on the ensemble average of the angular correlation function in figure 5 can be calculated. The value of the minima was found to be 〈ϕ(τ)〉 = −0.0336 ± 0.0025. A statistical analysis was carried out on this point and the error analysis shows that it is 99.2% statistically significant that there is anti-correlated motion. This anti-persistent motion is consistent with tethered motion, where the molecular motor is acting as a tether limiting the distance the lipid droplet can diffuse. On this time scale the lipid droplet may have explored the confinement distance allowed it by the tether and the motion is anti-persistent, as the droplet bounces off the boundaries of its confining potential. Using the information from the MSDs, this corresponds to a length scale of ∼10 nm, which approximates to the length of a dynein molecule. The combination of undirected motion and anti-persistent motion at short time scales provides new information on how molecular motors move lipid droplets along microtubules and the time scale at which their presence becomes observable in vivo. The angular correlations along with the MSDs fully describe the lipid droplets' motion at short time scales. This sub-diffusive tethered motion would not have been determined if these measures had been used independently of each other.
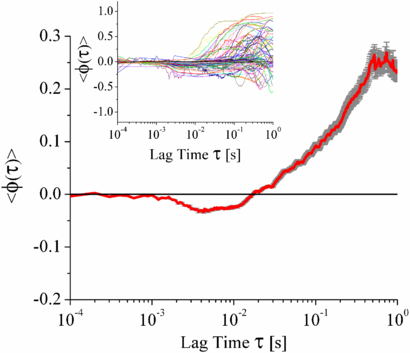
Figure 5. The ensemble average of the individual angular correlations of lipid droplets MRC-5 cells. On average there are no angular correlations for 10−4 < τ < 10−3 s, followed by anti-persistent angular correlations for 10−3 < τ < 10−2 s. The standard error of the ensemble average is shown by the grey error bars. The angular correlations are then persistent for τ > 10−2 s. Inset shows the ∼200 component angular correlations of individual lipid droplets in MRC-5 cells.
Download figure:
Standard imageAnti-persistent motion has been observed at the shortest time-scales in previous studies [13]. Lenormand et al [7, 13] did not show that any anti-correlated detector noise had been corrected for and Despósito et al [7] showed anti-correlated detector noise was corrected for, but short time scales were a decade slower than is shown in the current report.
In the case of active motors the MSDs would have super diffusive exponents, as the lipid droplets have directed rather than random motion. This is confirmed in figures 3 and 5 for the MSDs and angular correlations for the time scale of τ > 10−2 s. The angular correlations for this time scale show a positive gradient and increasing trend, indicating that on longer time scales the lipid droplets become more and more directed. Again, two dimensional simulations of this type of motion have been performed and examples of the resultant MSDs, SAFs and angular correlations can be found in the supporting material (figures S20–25, available from stacks.iop.org/PhysBio/10/036002/mmedia).
For the case of non-tethered droplets existing across all time scales, motion is again expected to be sub-diffusive due to the crowded environment of the cell, but would not be directed or anti-persistent. Probability distributions of the angular correlations for the three time scales that have distinct types of motion are shown in figure 6. For the shortest time scale (10−4 < τ < 10−3 s) the probability distribution of the angular persistence is sharply distributed around 0, indicating random motion (figure 6(a)). At the intermediate (10−3 < τ < 10−2 s) and longest time scales (τ > 10−2 s), the lipid droplets undergo a range of directed motions, but both intermediate and long time scales have a population that has an angular persistence centred around 0 (figure 6(b)). This would be consistent with the presence of a population of lipid droplets that are no longer or never have been bound to microtubules and are diffusing in the cytoplasm. Specifically for the intermediate time scale, it would also be consistent with the motors engaging for short periods and disengaging for longer times, resulting in the directed motion being lost in the undirected motion. Alternatively, the motors could be progressing along the microtubule at a very slow rate. In both these cases the directed motion would be visible at long time scales.
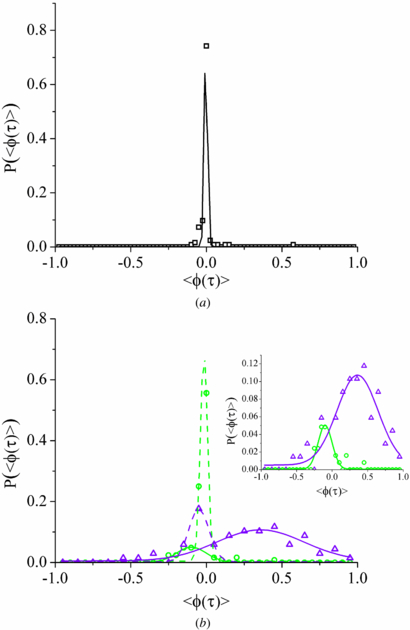
Figure 6. (a) Probability distribution of the angular correlations of lipid droplets in MRC-5 cells at short time-scales, τ < 10−3 s. Black open squares are experimental data and the solid line is a Gaussian fit to the data. The distribution is sharply peaked around 〈cos θ〉 = 0; showing neither persistent or anti-persistent motion. (b) Probability distribution of the angular correlations of lipid droplets in MRC-5 cells at intermediate (green open circles) and long time-scales (purple open triangles), ∼5×10⁻³ s and >10−1 s respectively . The dashed lines are Gaussian fits for the dominant peaks centred roughly around <ϕ(τ) > =0, solid lines are Gaussian fits for the secondary peak in the data sets. The inset is a rescaling of the data sets with the dominant peaks omitted. The intermediate time-scale corresponds to the minimum in the angular correlations shown in the inset of figure 5.
Download figure:
Standard imageThe inset of figure 6(b) shows the probability distributions of the secondary populations of the angular correlations in the intermediate and long time scales. The intermediate time scale is anti-persistent with a peak centred on ∼ −0.10, indicating that on average the angle between vectors is ∼96°. The presence of this population is underestimated if an ensemble average is taken (figure 5) and is only seen when there is a large enough sample size to be able to calculate the probability distributions. The long time scale secondary population has a much broader distribution centred on ∼0.36, corresponding to an average angle between vectors of ∼69°. The breadth of the long time scale distribution is most likely due to stochastic processes involved with the engagement of multiple motors with the microtubule, accessory proteins binding/unbinding with the motor complex, or the lipid droplet being driven through a complex viscoelastic environment as it moves along the microtubule. The probability distributions of the intermediate and the long time scales show us that there is a large level of complexity in the mechanics of directed motion in live cells, but they do resolve unique sub-populations that can be investigated and modelled further.
The observed motions cannot be due to self-assembly of a growing microtubule with a lipid droplet attached to the growing end, as if this were true the angular correlation would be positive and the motion would be super-diffusive across all time scales and not just for the long time limit. However, there may be some component of the transverse fluctuations of the microtubule [22] in 〈ϕ(τ)〉, though the MSD data shown in figure 3 does not have the characteristic scaling of ∼τ0.75 that would be expected of this behaviour. We therefore conclude that the contribution of microtubule oscillation to the displacement fluctuations are small i.e. the tether is much less rigid than the microtubule. Previous studies have shown lateral movement and longitudinal sliding of microtubules can be important for peroxisome motion in Drosophila with a disrupted actin cytoskeleton [11]. In contrast, we have shown that microtubule polymerization, oscillation or sliding has little effect on the motile behaviour of fluorescently-labelled endosomes in mammalian cells with an intact actin cytoskeleton [3].
To test whether the super-diffusive component of the MSD and the directed component of the angular correlations are a consequence of the motors indeed moving the lipid droplets along the microtubule network, MRC-5 cells were incubated for 3 h with 20 μM nocodazole. This treatment causes the destruction of the microtubule network, but leaves the actin cytoskeleton of the cell intact (data not shown). Accordingly, any super-diffusive directed motion of the lipid droplets along the microtubule network should be significantly reduced with correspondingly smaller MSDs and angular correlations.
For the nocodazole-treated cells ∼375 lipid droplets were tracked and were observed to travel with many fewer long range directed displacements. More droplets, compared to untreated cells, could be tracked for longer time periods, as fewer left the field of view. The MSDs and angular correlations for the nocodazole treated cells are shown in figures 7 and 8 respectively. There is virtually no persistent motion when compared to untreated cells at any time scale. The MSDs show that there is an initial nearly freely diffusive region (α ∼ 1) at short time scales, where there is a sub-diffusive region in the MSDs of untreated cells (10−4 < τ < 10−2 s). For the short time scale (10−4 < τ < 10−3 s) the angular correlations are the same as untreated cells, but the corresponding MSDs are almost diffusive, showing that on this time scale and without the presence of the microtubule network the lipid droplets are diffusing more freely. This shows that the initial anomalous diffusion observed in cells that have an intact microtubule network is due to the lipid droplets being bound to microtubules.

Figure 7. Ensemble average of the mean square displacements (red line, standard error bars in grey) of individual lipid droplets in MRC-5 cells that have been treated with nocodazole as a function of lag time, showing initial near diffusive behaviour (green line of best fit α = 0.85 ± 0.01) followed by sub-diffusive behaviour (blue line of best fit α = 0.65 ± 0.02) and no super-diffusive behaviour at long time-scales. MSDs of the ∼375 individual tracks that make up the mean are shown in the inset.
Download figure:
Standard image
Figure 8. Ensemble average of the angular correlations (red line, standard error bars in grey) as a function of lag time for individual lipid droplets in MRC-5 cells that have been treated with nocodazole. For short time scales (10−4 < τ < 10−3 s) the motion is neither persistent or anti-persistent, consistent with Brownian motion. For long time scales τ > 10−3 the motion is anti-persistent, consistent with confined motion. Inset shows the ∼375 component angular correlations where some display non-directed motion across all time.
Download figure:
Standard imageThere is little or no super-diffusive motion in the nocodazole-treated cells for the time scale τ > 10−2 s (figure 7). This alone shows that the super-diffusive motion observed in figure 3 is indeed due to the lipid droplets being moved along the microtubule network and this is confirmed by the angular correlations (figure 8), where at long times the motion is anti-persistent. For time scales τ > 10−3 s the ensemble averaged angular persistence is anti-persistent and the ensemble averaged MSD of the lipid droplets are sub-diffusive. This is most likely due to the actin cytoskeleton and the contents of the cytoplasm 'caging' the motion of the lipid droplets.
A wide range of different models exist in the literature for sub-diffusive motions and many of them could be applicable to intracellular motion [6, 21, 22]. Analytic predictions for the angular correlation function have not yet been described for many of the models, which is why we perform some simple Monte Carlo simulations in the supplementary information section (available from stacks.iop.org/PhysBio/10/036002/mmedia). Brownian motion inside a fractal domain was one of the earliest models for sub-diffusive motion and was originally proposed by Benoit Mandlebrot [23]. Simple scaling predictions of Brownian motion in a fractal were found to be in reasonable agreement with our data in a previous study of first passage times and MSDs for lipid droplet transport [5]. An alternative prediction to describe previous first passage probability data was fractional Brownian motion e.g. a Rouse model for the motor protein's tether [5]. Anti-correlated motion is predicted for free fractional Brownian motion [6] which could explain the anti-persistent motion at intermediate time scales (the motor protein tether dynamics), but not the uncorrelated motion at short times. Simple continuous random walk models [5, 22] were ruled out by our first passage probability study. Despósito et al [7] predict anti-persistent motion at short time scales based on the generalized Langevin equation, but this is not in agreement with our data on tethered lipid droplets where the motion in the short time scale is uncorrelated (figure 5). Future work will examine the specific stepping motion of the motor proteins driving endosomes in mammalian cells and how this relates to the thermal fluctuations of the motor protein tether dynamics.
4. Conclusions
Complementary MSD and angular correlation analysis of the motion of lipid droplets in live cells shows that at short time scales (10−4 < τ < 10−2 s) the lipid droplets undergo sub-diffusive motion that is comprised of two components of directed motion that have not been observed in previous studies. The first (10−4 < τ < 10−3 s) is randomly directed sub-diffusive motion and is consistent with the model of Brownian motion on a fractal. The second component (10−3 < τ < 10−2 s) is anti-persistent and shows that the lipid droplets are tethered to the microtubule. The analysis also shows that for time scales τ > 10−2 s lipid droplets have super diffusive motion and it is at this time scale that the motion becomes directed.
Now that a procedure has been established to calculate angular correlations experimentally, it would be interesting to study the quantity as a measure of caging in dense synthetic colloidal suspension with optical microscopy [24], use it for calibration of the optical potential for optical tweezers [25], explore it with active and passive micro-rheology experiments of complex fluids [26] and investigate single molecule tracking experiments of reptating polymer solutions [27]. Furthermore, simple simulations of both passive caged diffusive motion (supporting material section S4) and active directed caged motion (supporting material section S5) are able to predict qualitative features of both the MSDs and angular correlations we presented (available from stacks.iop.org/PhysBio/10/036002/mmedia). In the future we hope to refine these simulations with more realistic parameters and potentials to provide a completely quantitative model for the data.
Acknowledgments
The authors thank Dr Salman Rogers for supplying the matlab code for the PolyParticleTracker software. The authors are also grateful to Rachel Traynier for her preliminary work on coding the angular persistence routines and to Dr Neftali Flores-Rodriguez for useful discussions and advice. This work was funded by the Biotechnology and Biological Sciences Research Council.