

Abstract
Melting is one of the major risks associated with tungsten (W) plasma-facing components (PFCs) in tokamaks like JET or ITER. These components are designed such that leading edges and hence excessive plasma heat loads deposited at near normal incidence are avoided. Due to the high stored energies in ITER discharges, shallow surface melting can occur under insufficiently mitigated plasma disruption and so-called edge localised modes—power load transients. A dedicated program was carried out at the JET to study the physics and consequences of W transient melting. Following initial exposures in 2013 (ILW-1) of a W-lamella with leading edge, new experiments have been performed on a sloped surface (15 slope) during the 2015/2016 (ILW-3) campaign. This new experiment allows significantly improved infrared thermography measurements and thus resolved important issue of power loading in the context of the previous leading edge exposures. The new lamella was monitored by local diagnostics: spectroscopy, thermography and high-resolution photography in between discharges. No impact on the main plasma was observed despite a strong increase of the local W source consistent with evaporation. In contrast to the earlier exposure, no droplet emission was observed from the sloped surface. Topological modifications resulting from the melting are clearly visible between discharges on the photographic images. Melt damage can be clearly linked to the infrared measurements: the emissivity drops in zones where melting occurs. In comparison with the previous leading edge experiment, no runaway melt motion is observed, consistent with the hypothesis that the escape of thermionic electrons emitted from the melt zone is largely suppressed in this geometry, where the magnetic field intersects the surface at lower angles than in the case of perpendicular impact on a leading edge. Utilising both exposures allows us to further test the model of the forces driving melt motion that successfully reproduced the findings from the original leading edge exposure. Since the ILW-1 experiments, the exposed misaligned lamella has now been retrieved from the JET machine and post mortem analysis has been performed. No obvious mass loss is observed. Profilometry of the ILW-1 lamella shows the structure of the melt damage which is in line with the modell predictions thus allowing further model validation. Nuclear reaction analysis shows a tenfold reduction in surface deuterium concentration in the molten surface in comparison to the non-molten part of the lamella.
Export citation and abstract BibTeX RIS
1. Introduction
Tungsten (W) is among the main candidate-plasma facing components (PFC) for a fusion reactor [1] and will be exclusively used in the ITER divertor [2]. Melting is one of the major risks associated with the material and so PFCs in tokamaks like JET or ITER are designed in such a way that leading edges and hence excessive plasma heat loads onto the surfaces are avoided. W melts at  .
.
It was shown during multiple experiments [3, 4] that deep W melting can cause severe damage to components and can degrade plasma performance [5]. In 2013, experiments [6–8] were performed to assess how transient (ms-duration/μm depth) melting during ELMs (edge localised modes [9, 10]) might affect the operation of JET and potentially ITER. The high stored energies of which ITER will be capable means that even with all PFC edges protected, shallow surface melting can still occur under uncontrolled plasma disruptions and ELM transients15
. The impact and physics of melting needs to be studied in a relevant environment. JET is able to produce transients/ELMs large enough ( kJ per ELM) to facilitate melting of W. Such ELMs are comparable to mitigated ELMs expected in ITER [12].
In 2013 (ILW-1) a dedicated misaligned element (lamella, see figure 2) was installed in one part of the bulk W outer divertor, using a tapered exposed edge (0.25–2.5 mm) allowing exposure to the full parallel heat flux ( ) following the magnetic field to the target surface [13]. For the 2013 experiments, the conclusion was that plasma impact was minimal and that melt layer motion was in line with the predicted melt layer modelling. It also opened up questions about the interpretation of infrared (IR) temperature measurements. Discrepancies were apparent in the JET experiment between the parallel heat flux required to reproduce the misaligned lamella surface temperature and that derived from observations on non-misaligned surfaces. So-called mitigation factors, or perhaps more correctly, reduction factors (0.2 for L-mode and 0.4 for H-mode [7, 8])16
were derived from these measurements by using the melt layer model MEMOS-3D [15–18] to generate temperature profiles based on the input heat fluxes and from them producing synthetic signals to compare with the infrared data.
) following the magnetic field to the target surface [13]. For the 2013 experiments, the conclusion was that plasma impact was minimal and that melt layer motion was in line with the predicted melt layer modelling. It also opened up questions about the interpretation of infrared (IR) temperature measurements. Discrepancies were apparent in the JET experiment between the parallel heat flux required to reproduce the misaligned lamella surface temperature and that derived from observations on non-misaligned surfaces. So-called mitigation factors, or perhaps more correctly, reduction factors (0.2 for L-mode and 0.4 for H-mode [7, 8])16
were derived from these measurements by using the melt layer model MEMOS-3D [15–18] to generate temperature profiles based on the input heat fluxes and from them producing synthetic signals to compare with the infrared data.
In a joint international effort, new experiments [19] have thus been aimed at both further elaborating the influence of transient melting on edges and surfaces, but also to elucidate the issue of power loading of edges [20] and IR interpretation. A crucial point with respect to all experiments is the temperature evolution of the exposed lamella and its front surface and hence the actual relation of heat fluxes to the melt behaviour and melt layer motion. One particular experiment [21] in the confinement device ASDEX Upgrade [22] was designed as companion experiment to the JET exposures to also measure the thermo-electric emission [17, 23, 24] causing melt layer motion in fusion devices [3, 4, 25–28].
In this contribution the general overview of the experiments for the ILW-3 exposure (2015/2016) will be given together with the rational linking the old and the new exposure. Material damage evolution, material losses and plasma impact are discussed. Issues related to the actual ( ) determination are presented and compared to the ILW-1 experiment. The presentation of the new experiments is followed by an update on the postmortem analysis of the old ILW-1 2013 edge lamella. Here the main focus lies on the surface characterisation and metallography.
2. Setup
Due to power handling considerations [29] the outer divertor at JET is split up into four so-called stacks (A–D) with A being located closest to the high field side (HFS). Figure 1 displays a view onto divertor modules with its four stacks. Each stack is split in a number of individually shaped lamellas [29]. The lamellas have a poloidal extent of 5.9 cm and are 5.5 mm wide toroidally. Stack A is used for exposing the specialised lamellas for these experiments as operation at JET is usually contained to the low field side of the horizontal target namely Stack C & D. When considering both experiments two special lamellas were used. A leading edge and sloped W Lamella (figure 2). The toroidal installation position of the lamellas during both experiments was chosen to allow the existing IR diagnostics [33, 34] to be used. For the first experiment (ILW-1) the special lamella was designed to allow significant preheating due to the front surface being exposed to the parallel heat flux [7]. The exposure to the parallel heat flux is achieved by producing a chamfered leading edge of 0.25–2.5 mm and also lowering of the eight lamellas in front of the exposed edge to mitigate potential shadowing (figure 1). This top viewing of the IR diagnostic did however mean that during the ILW-1 exposure only the propagation of the heat pulse into the lamella from the side could be observed [7, 8]. For the second experiment the issue about IR interpretation was taken into account. It was determined that it was necessary to use a geometry where simple power factors are more likely to apply and also a direct observation of melt zone by IR was possible. This was aimed at an easy access to the parallel heat-flux  . In figure 3 the rational for the lamella shape is given. With the resolution of the IR being in the order of one mm the aim was to allow for multiple data points along a sloped surfaces. The sloped surface (15
 slope) in the bulk W outer divertor is contained to the high-field side part (2cm) of the Stack A lamella used.
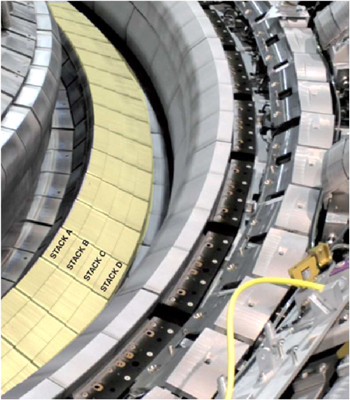
Figure 1. Modules of the JET outer divertor depicting the position of the dedicated lamella. The yellow highlight area is the main power loaded area in JET—the bulk tungsten divertor [29–32].
Download figure:
Standard image High-resolution image
Figure 2. Elements/lamellas for both experiments—as installed [ILW-1(l), ILW-3(r)])—the dedidcated lamellas are highlighted in red.
Download figure:
Standard image High-resolution image
Figure 3. Schematic view of the new lamella geometry also indicating the new IR view as well as the direction of the incoming plasma flux.
Download figure:
Standard image High-resolution imageIn order to quantitatively interpret the outcome of the experiment and also be able to follow the progress of potential melt damage several other diagnostics were employed. To be able to monitor changes to the installed lamella a high-resolution camera was installed (SBIG ST-8300 Monochrome [35]). With a resolution of ∼100 μm one can clearly follow the evolution of the lamella and the surrounding areas.
A direct observation of the emitted W from either evaporation or droplet emission is realized by a localised viewing cord as installed during both experiments [7]. A small observation volume covering the area of the special lamella and part of Stack A allows dedicated measurements. Based on the WI 400.88nm line one can calculate the released amount of W as demonstrated in [3, 36]. In the interest of brevity we would refer to previously published work for the previous experiments in 2013 for the details [7, 8].
3. ILW-3 Experiments
A sequence of 3.25MA/2.7T H-Mode JET pulses with 27MW input power and regular Type-I ELMs (P kPa) was used to obtain repeated, transient melting (melt depth 5–10 μm) of a the modified sloped W lamella. The melt depth estimation is based on previous modelling and experiments performed for the ILW-1 experiment. This is in line with modelling presented below.
As shown in the time traces of figure 4 both NBH (neutral beam heating) and ICRH (ion cyclotrom resonance heating) were employed to reach the total heating power (in Watts). In figure 4 also time-traces for the line average density (1/m2) and the Beryllium I emission photon flux from the divertor are given. The density is reasonably stable during the exposure of the Stack A lamella between 51.5 and 53.5s. The ELM characteristic, given by the spectroscopic BeI emission signal is not as even between the individual ELMs as desired but did allow a successful experiment.
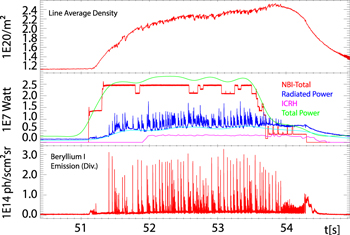
Figure 4. Engineering and plasma parameter time traces in an overview for the ILW-3 melt pulse #91965.
Download figure:
Standard image High-resolution imageIn figure 5 the details for the strike-line position are given. The exposure duration of the lamella was increased to increase the base temperature and allow transient melting by the heat-flux originating from the individual ELMs in line with the ILW-1 exposures [7]. By increasing the exposure duration the base temperature was increased following a simple sqrt(t) relation as expected. During #91965, the base temperature together with the ELM heatflux was enough to facilitate melting. Figure 6 shows one example of the HF calculated for the individual ELMs and the phase in-between ELMS. When looking at the heat-flux deposited during this particular ELM it becomes clear that the extent of the slope introduced is marginal in terms of exposure area. Only the ELM heat-load between 0 and 0.2 cm is impacting the sloped part of the special lamella. This fact can be clearly seen also in figure 7. On the left the IR emission from the sloped part is clearly visible above the non sloped part. On the right-hand side the lamella is shown, undamaged and damaged. When looking carefully also the actual melting can be determined from the IR pictures. In the bottom IR image lower emissivity from the molten mirror like surface causes the IR emission to drop and thus make the damage visible in the IR.

Figure 5. Time traces for the position of the main interaction zone (Strikeline Position (RSOL)) for the sloped lamella given in global tokamak coordinates.
Download figure:
Standard image High-resolution image
Figure 6. Parallel heat-flux (W/m2) along the field lines calculated for #91965. The maximum heat-flux corresponds to the peak ELM heat-flux whereas the blue curves show the period between two individual ELMs. The profile is given along the poloidal extent of the lamella.
Download figure:
Standard image High-resolution image
Figure 7. Lamella damage in comparison to the IR-emission footprint. The color images show in arbitrary units the temperature footprint on the lamella, while the grey images are high-res camera images after the exposure.
Download figure:
Standard image High-resolution imageTopological modifications resulting from the melting are clearly visible between discharges on the photographic images. No runaway melt motion is observed. To elaborate a bit more clearly the damage inflicted figure 8 is used. Differential pictures are produced always subtracting subsequent images. Clearly the appearance of the melt damage during #91965 can be observed. Subsequent pulse, with lower energy input did only produce minor surface modification. Thus only one melt pulse was achieved. The behaviour is quite different from the layer droplet produced in the ILW-1 exposures [7]. From previous experiments and modelling it is assumed that the dominant forces leading to this material redistribution are related to a thermo-electric current driven jxB force, as seen from previous melt experiments [17]. From recent collaborative experiments in ASDEX Upgrade it is however assumed that the escape of thermionic electrons emitted from the melt zone seems largely suppressed in a more sloped or flat geometry [19, 21]. The much lower net current then leads to a reduced jxB force on the melt, poloidal melt motion is considerably reduced. Instead, other forces, probably dominated by surface tension as the melt layer repeatedly re-solidifies, produce the observed final corrugated surface topology.
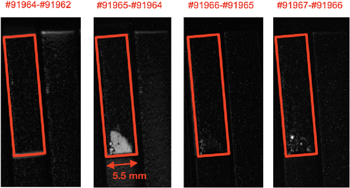
Figure 8. Images depict the step by step evolution of the damage. Each step is an image difference from two separate exposures.
Download figure:
Standard image High-resolution imageIn addition to the surface damage it is also of crucial interest to study the impact of the melt damage onto the plasma operation. During the 2013 ILW-1 exposure droplet emission was observed, likely due to the large acceleration of the melt.
For the new sloped lamella no droplets impacting the plasma were found. Only a rise in W emission consistent with evaporation was found (∼1E22 1/(m2s)) [37]. The emission measured is typical for evaporation fluxes at the given melt temperature of 3695 K. the influx rises as the temperature increase.
One of the main aims of the experiment was to tackle the so called mitigation factors required to match experiment and modelling [7, 8]. L-Mode required a mitigation factor of 0.2, while H-mode required a mitigation factor of 0.4 on the parallel heat-flux to match experimental data on temperature rise.
Figure 9 shows the actual issues face and tackled. Typically an inverse analysis is performed to determine the perpendicular heat-flux on the impinged surface. Using this heat-flux one should then be able to calculate the temperature evolution using forward analysis based on finite element methods. A very detailed analysis of geometrical factors was undertaken [38] and also detailed forward modelling was performed [38, 39]. It was shown that, at least in L-mode, the assumption of optical heat flux projection is justified and for H-Mode the measured heat-flux can be reasonably well matched to allow forward modelling of the melt geometry. Using the same model and same plasma parameters, good agreement is obtained for all three geometries, validating the assumption of optical heat load projection after accounting for observed background on the IR heat flux, the origin of which is still under investigation. This now provides a solid basis for modelling.
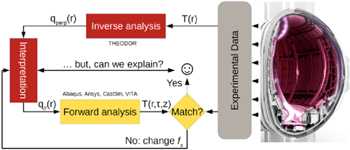
Figure 9. Scheme of forward and inverse analysis to match modelling approaches and finalise the determination of the parallel heatflux.
Download figure:
Standard image High-resolution imageFigure 10 shows a good match between the experimentally determined temperatures and the calculated ones based on the determined parallel heat-flux 10(a) together with a geometric match between the temperature footprint and the actually damaged area. Further work is ongoing, however it is clear that for both L-Mode and H-Mode accurate determination of geometries and incorporation of them into the models allows to explain the mitigation factors within the uncertainties. More details are given in [38, 39].
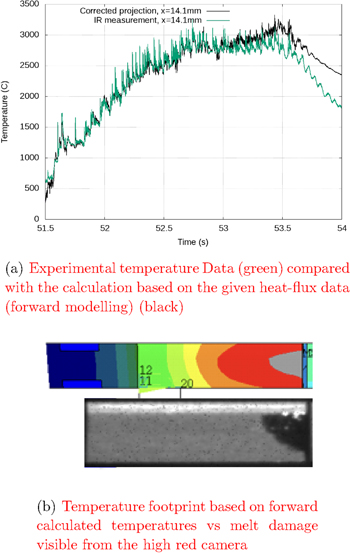
Figure 10. Temperature evolution.
Download figure:
Standard image High-resolution image4. Post-Mortem Analysis—ILW-1 Leading Edge Lamella
Based on the long turnaround time of components in JET only recently access was possible to the leading edge lamella exposed in 2013. The main interest here is on the actual structure of the melt droplet and the melt redistribution as well as potential changes to the material structure. In addition, information was gathered regarding fuel content of the re-solidified material. In figure 11 the close up imagery of the lamella is given and can be compared to the documented melt evolution given in figure 18 [7]. Already after the experiment, a layer-by-layer growth of the damage was postulated utilising high resolution imagery, this can now be confirmed by figure 11. The melt material is transported from the central part of the lamella to the high-field side following the jxB force direction. A layer wise structure can be seen which is consistent with the amount of around 60–100 ELMs having caused the melting. Strong re-crystrallisation of the material is evident already from the shiny top surface, large grains can be observed. The main droplet is actually attached to the leading side of the lamella as expected from a pure inward driven motion. Figure 12 gives a electron microscopy close up of the actual droplet. the intriguing detail here is the crack surrounding the droplet. Strong re-crystrallization and thus embrittlement is expected from re-solidified material. This means that a droplet when exposed to further heat-loads and thermal stresses might dislodge and enter the plasma. Depending on size and trajectory this can cause a plasma disruption. As seen in many of the deep melt experiments [3–5, 26, 27, 40] droplet emission can occur. This effect is usually attributed to melt layer motion ripping of droplets from the surface [17, 41, 42] as well as connected wave instabilities [43, 44] or boiling effects [40]. Typically the release of droplets clearly causes cooling of the core plasma and thus influences performance.

Figure 11. Photography: Melt layer for the ILW-1 leading edge exposure.
Download figure:
Standard image High-resolution image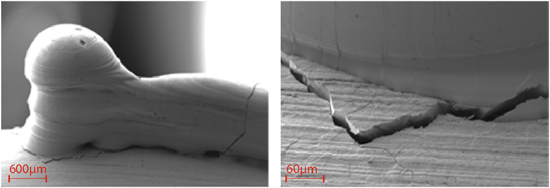
Figure 12. SEM Images at two magnification of the droplet produced.
Download figure:
Standard image High-resolution imageAn attempt at determining the melt layer loss yielded at most 100 mg of mass loss connected with an uncertainty of around 100% as the determination relies an volume based reference weight estimate. In a further step the profilometric measurements were performed to be able to match the melt layer redistribution modelling with the actual material moved, in 13 (r) the data is presented and compared with the melt layer modelling by the MEMOS Code [17]. The issue of reflection has limited the ability to measure the depth near the melt layer damage and thus more an outline of the melt damage is visible. The material moved is in line with the previous estimation of around 6 mm3 as determined in [7]. The droplet stand out 1.7 mm from the leading edge and contains nearly all of the material moved from the central part of the lamella. In figure 13, six consecutive melt pulses using the input data from 2013 were modelled in contrast to one pulse in the previous publication [7]. With the qualitative agreement documented before [7] the profilometry data now allows a quantitative comparison of the full melt experiment with the actual data. Here a deviation can be clearly observed. Work is ongoing to re-evaluate the heat-flux data used but also to improve the understanding of the model. Here especially also the experiment regarding the jxB forces and thermionic emission at ASDEX-Upgrade are crucial [21].

Figure 13. Updated melt layer modelling after six consecutive pulses relevant for the 2013 exposure. On the right, the modelling is overlapped onto the actual profile measurement.
Download figure:
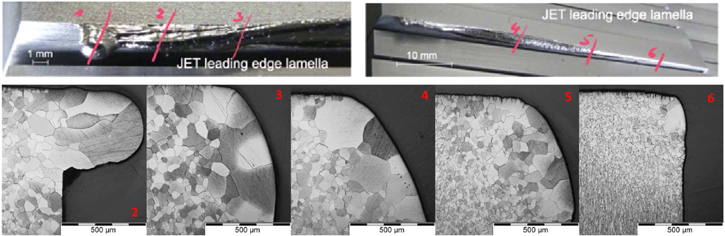
Standard image High-resolution imageOne crucial point is to understand the effect of the high heat fluxes and melting on the material structure. In figure 14, five cuts though the melt damage and the lamella are given. Clearly the large grain size in the re-solidified melt can be observed. The material shows grain growth/recrystallisation deep into the material for all areas of the lamella that have seen melt damage on the top surface. Material that was moved into the droplet during each individual ELM has re-solidified in a columnar structure. Individual layers cannot be observed. The large grains indicate that the surface now is potentially less able to withstand additional stresses as this grain growth embrittles the material. In Cut Nr. 4, a layer of bubbles can be observed, similar to deep melt damage studied in [40] it seems that also here outgassing or bubble formation is present, which potentially could trigger droplet expuslion [43–45]. In all images it can be seen that the damaged surface is shaped rather smoothly when compared to the leading edge, thus it becomes less exposed to the parallel heatflux, this means that in part plasma machining occurs mitigating the heat-flux to the surface. The area of Stack A is typically a net deposition area in JET. A deposition layer is formed on the lamella and the re-solidified melt of about 100 nm in height mainly consisting of Be, C as well as traces of nitrogen. With respect to the retained fuel measurements were performed using 3He NRA at 2.8 MeV. It was found that the resolidified surface layer contains 10 times less (2E15 at cm−2) of deuterium then the exposed un-molten area.
Figure 14. Metallographic cuts for the 2013 ILW-1 Melt lamella.
Download figure:
Standard image High-resolution image
5. Summary
In conclusion, it can be said that the experiment successfully achieved transient melting in the desired geometry. The JET ELMs were of a size relevant to mitigated ELMs in ITER and shallow melting of sloped surfaces causes almost no visible plasma impact. The ILW-3 2015/16 experiment improved significantly the ability of IR analysis. No mitigation factor is required to understand the outcome of the experiments in L-Mode and the mitigation factors have mainly been identified as systematic uncertainties in the calculation.
The main message is that the ILW-3 2015/16 experiment did show that when exposing a sloped surface instead of a leading edge far less melt motion is visible—here the reduced effect of the jxB forces can be seen as main driver.
From the SEM, possibly during the post-mortem analysis of the ILW-1 2013 lamella, it can be seen that the droplet produced might eventually come off and potentially disrupt the plasma if exposed to future heat-flux. It is observed that the surface structures seen on the droplets are partly reflected in the grain structure. A weight loss is not apparent from the postmortem measurement but can be expected as droplets were released during the 2013 experiments. Melting impacts the hydrogen retention—D is driven out of the 2013 lamella when compared to the non-molten surfaces. From the EDX map of the flat lamella, it is observed that Stack A as expected shows [46] deposition of Be, C and other light elements. During the post mortem analysis of the ILW-12013 lamella, a comparison with profilometry and MEMOS showed only small discrepancies.
Obviously ITER has the potential to produce similar damage over the whole area of the strike point. The number of droplets produced could therefore be much larger especially for leading edges. Whether or not this would be sufficient to disrupt an ITER plasma cannot be simply concluded but the JET results do provide the basis for such a calculation. The JET results are directly relevant to what would happen in the case of molten surface. Provided such an event is detected in ITER and is not repeated too many times such that large droplets build up, there would be no risk of a disruption.
Acknowledgments
This work has been carried out within the framework of the EUROfusion Consortium and has received funding from the Euratom research and training programme 2014–2018 under grant agreement No. 633053. The views and opinions expressed herein do not necessarily reflect those of the European Commission.
Footnotes
- 15
ELMs are transient relaxation of the edge gradients in the fusion plasma, causing expulsion of particles and heat [11] to the first wall of a fusion device. The particle and heat-fluxes typically follow the magnetic field and thus impact the divertor where the fields lines impinge the W components.
- 16
When a magnetically confined plasma is heated strongly and a threshold heating power level is exceeded, it may spontaneously transition from a low confinement (or L-mode) state to a high confinement (or H-mode) state [14]. In the H-mode, the energy confinement time is significantly enhanced, i.e., typically by a factor of 2 or more.