


Abstract
The Miller–Urey experiment became a paradigm for spontaneous generation of biomolecules on the prebiotic Earth. In the experiment water, methane, ammonia and hydrogen gases are submitted to electric discharges. New molecules emerge and accumulate in liquid water to form a rich organic solution. Although many important biomolecules such as amino-acids have been isolated from a Miller–Urey broth, it is unclear how many different molecules the experiment is able to produce. Here we analyze the prebiotic broth by liquid chromatography and high-resolution mass spectroscopy. We find that the experimentally determined molecular mass density distribution from the Miller–Urey experiment reproduces the distribution of all organic molecules (regardless of their elemental composition) indexed in the Beilstein database. The observed mass density distribution exhibits paretian behavior: it closely follows a log-normal distribution except for its tails where it approaches a power-law. Simple growth models reproduce the experimentally observed mass distribution to a lesser extent than the Beilstein data. We conclude that molecular growth processes are unlikely to limit the experimental outcome, rather the Miller–Urey experiment seems to explore the entire range of prominent, stable masses of molecules that are part of the Beilstein/Reaxys database and made from the same atomic elements. We suspect that in principle the experiment can, at least statistically, produce any small organic molecule that exhibits sufficient stability as part of the broth.
Export citation and abstract BibTeX RIS

Original content from this work may be used under the terms of the Creative Commons Attribution 3.0 licence. Any further distribution of this work must maintain attribution to the author(s) and the title of the work, journal citation and DOI.
Introduction
The famous Miller–Urey experiment (Miller 1953) showed that biomolecules, including amino acids, could spontaneously form in the absence of biology. Besides water (H2O), Miller supplied methane (CH4) and ammonia (NH4) as carbon and nitrogen sources as well as hydrogen (H2) and applied electric discharges to the gas mixture for a few days (figure 1). Miller detected different bio-organic molecules in the emerging broth, amino acids among them. Although other elements like sulfur, phosphorus and iron play important roles in organisms, many of the important molecular building blocks consist of H, C, N and O only. Amino acids can be produced under different, also possibly prebiotic conditions with different gas mixtures and energy sources (Oró et al 1959, Lowe et al 1963, Oró 1963, Sanchez et al 1966, Santamaria and Fleischmann 1966, Fox 1995, Kobayashi et al 1998, Cleaves et al 2008, Parker et al 2011). Biomolecules not found in Miller's initial experiments such as nucleobases (Oró 1960, Lowe et al 1963, Sanchez et al 1966, Ferus et al 2015) or lipids (Lowe et al 1963, McCollom et al 1999) were shown to emerge from small organic compounds and even polymerize under possible prebiotic conditions (Simionescu et al 1976, Trinks et al 2005). Recently Sutherland showed that all major molecular classes of biomolecules may well have emerged under very similar conditions on the early Earth (Patel et al 2015).

Figure 1. (a) Experimental set-up of the Miller–Urey experiment. Besides water, the apparatus contained methane, ammonia, nitrogen, and hydrogen. Heating the oil bath and cooling the condenser created a circular flow. During the experiment we extracted samples from the flask for analysis. (b) Chromatogram from Corona Detector equipped HPLC for samples extracted from the flask at different points in time. During the experiments the chromatograms became more complex while the area under the curves increased (inset). Both observations indicate the production of more and increasingly different substances during the experiment. (c) Spectra of samples extracted from the flask at two different points in time. The spectra show a large number of organic substances in particular in the range of m/z 100–500. Full spectrum is in SI figure 3 is available online at stacks.iop.org/NJP/20/105003/mmedia. Blank subtraction and noise level is shown in SI figures 4–7 (d) distribution of mass (i.e. peak)-density extracted from the mass spectra at two different points in time (79 and 163.5 h) during the experimental run. The mass density distribution is skewed with a final mean around ∼300 Da (163.5 h). Over time more substances appeared in the spectra and the distribution shifted towards smaller masses. (e) Distribution of mass densities from the Beilstein database (limited to C, N, O and H) and the experiment.
Download figure:
Standard image High-resolution imageIn the Miller–Urey experiment plasma from the electric discharge creates ions as well as radicals (molecules or atoms carrying an unbound, single electron). As the plasma temperature drops the molecules in the discharge combine to form new substances (figure 2). In the process radicals that combine with other radicals will tend to form new, non-radical species. However, radicals reacting with non-radicals will lead to new radicals that may react further. While small molecules with elevated vapor pressure essentially remain in the gas phase and remain subject to further discharge, larger and more polar molecules are more likely to dissolve in the liquid phase where they may react further. A previous analysis showed that the Miller–Urey experiment produces many molecules with unsaturated (triple or double) bonds in the gas and in the liquid parts of the broth (Scherer et al 2017, Wollrab et al 2016). These unsaturated bonds tend to react further. So far computer simulations have only been able to address subspaces of all possible molecular combinations (Saitta and Saija 2014). To our knowledge there is no experimental work besides (Wollrab et al 2016, Scherer et al 2017) that addresses the enormous molecular variety produced by discharge experiments blindly, that is, without initial bias towards certain molecules or classes of molecules beyond technical limitations of the employed techniques.
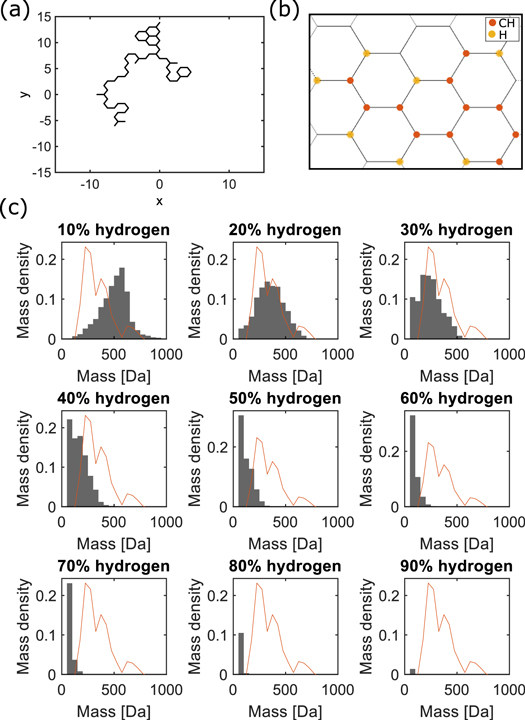
Figure 2. Simulation of molecule formation. (a) Reactive particles perform a random walk on a grid. The particles are of two types. They either establish several bonds, which leads to growth (growers) or they are limited to a single bond, inhibiting further growth (stoppers). (b) Example molecule resulting from the process in (a), representing the growers by CH and the stoppers by H. (c) Mass distribution of substances created in the simulation for a starting point at a distance d = 3 form the origin and different grower to stopper ratios. Each particle performs at most 100 steps. The simulation ran over 100 particles. The red line represents the mass density distribution from the experimental data.
Download figure:
Standard image High-resolution image
Here we perform Miller–Urey experiments and analyze the organic mixture in the water with high-resolution mass spectrometry by direct injection without prior filtering. This method provides a sensitive and fast technique to analyze complex chemical mixtures. Different ionization modes (positive or negative) and different parameters of electrospray ionization (ESI) emphasize different subsets of the mixture. We focus on the density distribution of molecular masses as a function of mass.
We find that the experiment produces a large number of substances that are about log- normally distributed around an average mass of 300–400 Da. The mass distribution corresponds to the mass distribution of all different existing organic molecules indexed in the Beilstein database.
Methods
Miller–Urey experiment
The experimental set-up (figure 1) followed the design of the original Miller–Urey experiment (1). A 1l flask contained deionized, highly purified, sterile water (ultrapure arium 611UV, 18 MOhm, TOC < 1 ppb water purification system (Sartorius Stedim Biotech, Germany)) fed with 1 MOhm reverse osmosis purified tap water). The flask was connected to a 5l flask equipped with two tungsten electrodes. The water in the 1l flask was heated while the tubes at the outlet of the 5l flask were cooled, leading to a circular flow of the mixture in the apparatus. A high-voltage device produced sparks between electrodes. Sparks were created by a saw tooth electrical tension ( ∼10 kV p.p.) at the electrodes. The tension was generated by a 33 kV TV flyback transformer (TCE 33, as a spare for Telefunken 'Chassis 620'), driven by two MosFETs as part of a self-oscillating driver circuit. Power dissipation was 20 W as indicated by the alimenting 24 V power supply (LSP-1403, Voltcraft). A stopcock allowed for evacuation and filling of the reactor.
Before each experimental run the reactor was cleaned several times using easy-to-rinse radioactive decontamination cleaning solution (Deconex, Borer Chemie, Germany) following the protocol from the manufacturer. Subsequently the reactor was rinsed at least five times with ultrapure water as used during experiments. For experiments we evacuated with a vacuum pump (DS 202, Varian) and immediately filled the apparatus with nitrogen (N2, purity 99,995) to minimize the amount of remaining air. The reactor was then evacuated again and refilled with the gases methane (purity 99.7%, Praxair), ammonia (purity 99.98%, Praxair) and hydrogen (purity 99.9%, Praxair) in the ratio 2:1:1.
The gases were supplied to a final pressure of 0.75(5) bars so that atmospheric pressure was reached as the water started boiling. We heated the flask with a heating mantle (G2R, Pilz, Germany) set to a fixed heating power, corresponding to a temperature of 90 °C–100 °C (determined in an earlier measurement) and let the experiment run for 164 h. During the run gases were resupplied once. The refill followed the same procedure as the initial fill after the experiment had cooled down sufficiently. Liquid samples were extracted through a needle from the 1l flask. At the end of the experiment (164 h), the remaining liquid was transferred to a sterile flask and stored at 8 °C during a few hours until further analysis. The broth contains hydrophobic and hydrophilic components (Scherer et al 2017). Mass spectra of different broths from consecutive Miller–Urey experiments performed under the same experimental conditions, as obtained by direct injection into a Waters Q-Tof Micro mass spectrometer equipped with ESI, did not exhibit any detectable differences. We therefore limited our analysis to a single sample.
High performance liquid chromatography (HPLC) measurements
The samples taken at different time points during the experiment were analyzed by HPLC on a C18 column (ProntoSil 120-5-C18 ACE, Bischoff Chromatography). This type of HPLC column is made of porous, functionalized silica. A charged aerosol detector (CADTM, CoronaTM, ESA, Inc.) was used for detection. The CAD detector dries the analyte and ionizes it in a stream of charged nitrogen. The process is highly sensitive and enables a quantitative detection of the different substances contained in the sample. We used deionized water with 10% methanol as eluent.
Mass spectrometry Orbitrap measurements
Samples were analyzed on a Thermo LTQ Orbitrap high-resolution mass spectrometer equipped with an electron spray ionization (ESI) ion source. We injected the sample directly into the mass spectrometer (without prior chromatography). A sample of sterile, deionized water served as a reference.
Simulation of molecule formation
In our experiments the spark creats molecular fragments among them radicals and ions that will bind to form new molecules as the temperature of the spark drops. This leads to a complex molecular growth process. Accordingly, here we performed diffusion-limited aggregation (DLA) simulations with a limited number of molecules to find out if a quenched aggregation growth-mechanism can be responsible of the observed distribution.
Here, we simply considered that any growing molecule will have sites of varying propensity to react. Small units, atoms or small molecules will either establish chemical bonds or not. We made the mean field approximation that the process is well described by a single, average binding mass. In principle in the spark large molecules could be decomposed to large fragments that are prone to recombination and further growth, however, larger molecules will on average be less concentrated: they tend to have a lower vapor pressure if solubilized in water (or oil) because of van der Waals interaction with the solvent (Israelachvili 2011) (oil as well as water are present in the broth (Scherer et al 2017)). The lower vapor pressure will apply in particular to easily charged, more polar, water soluble molecules as detected in mass spec. As a result, given that the experiment is refilled with fresh gases once, to compare with the experiment we considered that the binding elements are composed of a single species. However, in our approach, it was unimportant whether the binding elements are small molecular fragments of average size or small groups of atoms, as long as the mean field approximation holds. Chemistry textbooks state that in many cases the presence of a particular atom will influence reactions if located at most four atoms away from the reaction site of the molecule in question (Bruice 2013). In a more general setting this may be a characteristic size to consider. Other mechanisms, for instance the formation of polymers by radical propagation, was not included in our simple model. Moreover, molecules may react further with each other in the liquid phase of the broth, following different rules, and this was not taken into account. How exactly the molecular growth process should be described in terms of a statistical mechanism is unknown to us. Any model that tends to reflect all the different mechanisms that may play a role, could possibly fit the data with many free parameters. At the same time a resulting mechanism would emerge as highly speculative. Consequently, here we investigated if a simple growth-mechanism can be the dominant mechanism that leads to the observed distribution. A more thorough, detailed study will be performed in follow-up work.
Given the above, in the simulation we distinguished only two different atomic species: ones forming bonds with several other species ('growers') and a second type that can only form a single bond ('stoppers'). The ratio between the growers and stoppers was a free parameter of the model. As in chemical 2D representations we based the simulation on a honeycomb lattice. In this picture the growers were CH moieties (one CH-bond orients normally to the 2D grid). Note that a carbon with carbons bound at all four sites is a rare configuration that can be found for instance in diamond. In our DLA simulation each point of the grid corresponded to a possible particle position. Each new molecule started growing from an initial grower placed at the center of the grid. Each newly entering particle was randomly assigned as grower or stopper, the probability depending on the ratio of growers to stoppers (a free parameter). The new particle entered the grid at a starting position that is randomly chosen among six predefined lattice points. The predefined lattice points were homogeneously distributed around the initial grower particle at a given distance (a free parameter). From the starting position the particle performed a random walk over the grid for a maximum of N steps. If the particle reached a neighboring site of a grower, it became attached and a new particle entered the simulation. If after N steps the particle did not reach a free binding site, it was removed from the simulation and a new particle enters. The random walk includes already occupied sites. Limiting the size of molecules simply by choosing a ratio of growers and stoppers did not produce the experimentally observed distribution. We therefore studied the case that only a limited number of atoms can react. Such a situation will occur if the number of the molecules reacting within the volume of the spark is limited and quenches the growth process. As a consequence the number of particles entering the grid was limited to 100. After the last particle enters the simulation, the molecular weight was extracted and a new, unrelated molecule was produced from scratch in another round of simulation. We simulated the formation of a thousand molecules. All simulations were performed using custom MATLAB code.
Results
HPLC
At different time points of the experiment we extracted samples from the flask for analysis by HPLC. In the chromatograms the signature of substances appeared within retention times comprised between 0.7 and 2 min (figure 1). Thiourea, a small inert molecule of medium polarity, is well known not to interfere with the column chemically and consequently is not retained by chemical interactions. Thiourea exhibited a retention time of 1.67. Molecules that are less hydrophobic or larger with similar charge distributions will exhibit a reduced retention time because they interact less with the column. The area under the chromatograms increased with time (figure 1 and SI figure 1), indicating gradually increasing amounts of organic material. Different peaks appeared in the chromatograms over time, showing that substances of different polarities and sizes were produced. In the beginning of the experiment (8.5 h) the highest peaks had long retention times. At the end of the experiment (163.5 h) the highest peaks had short retention times. This suggests an increase in molecular polarity or size with time.
Mass spectrometry
Samples taken at different time points from the boiling liquid in the flask were assessed by high-resolution mass spectrometry (figure 1 and SI figure 3). We analyzed the resulting mass spectra by considering the number of peaks per interval of length m/z 50. Due to its high sensitivity the mass spectrometer detected many peaks already in the blank. Accordingly, for each mass interval we subtracted the number of peaks found in the blank spectrum from the number of peaks found in the sample spectrum. Given that the molecules of observed masses tend to be singly charged (Gross 2006) the peak density of the spectrum approaches the mass density distribution. We checked that we did not systematically observe any peaks at half the mass. At 8.5 h from the start of the experiment the mass spectrum was dominated by the background signal (SI figure 4). Only in the range between 400 and 600 Da, peaks were above the noise level. In the spectra of samples extracted at later time points we found over 900 (79 h) and 1101 (163.5 h) different peaks without any other subtraction than the background. Accordingly the spectrum included adducts and isotopes. Their density distribution (figure 1(e)) was skewed with a maximum density around 300–400 Da. Over the running time of the experiment the log-normal distribution shifted towards smaller masses. A log normal fit to the data yielded means of 353.50 Da at 79 h and 298.39 Da 163.5 h.
Mass distribution from the Database
We extracted the mass density distribution of over 10 million organic substances listed in the 'Beilstein' database (MDL Information Systems et al 2007) for a mass interval of 50–1200 Da, narrowing the search to any combination of the atomic elements C, N, O and H figure 1(e)). We fitted the mass density distribution with a normalized log-normal distribution (R2 = 0.9989), revealing a mean of 348.62 Da and a standard deviation of 140.0 Da (SI figure 7).
Simulation
The electric discharge creats ions and radicals. The reactive species can form new substances via quenching. We simulated the process with a simple, diffusion-limited aggregation model. Particles were either 'growers' that bind to neighboring particles or 'stoppers' that if bound to a grower will not bind any further (see methods for details). For low stopper concentrations the majority of molecules grew endlessly, and the final size was only limited by the number of particles that enter the simulation. For high stopper concentrations the distribution became exponential. We found that the distribution of resulting molecular masses resembled the distribution of masses from the experiment most for a maximal number of N = 100 particles entering the simulation for each molecule. Assuming a mass of 13 Da for the grower species and 1 Da for the stopper species and choosing a starting position that is close to the origin (d = 3), the simulation lead to masses within the experimentally observed range (figure 2).
Discussion
The Miller–Urey experiment produces molecules in a way that is subject to a great deal of randomness (Scherer et al 2017). Here we compared the observed molecular mass (i.e. peak) density distribution as obtained from mass spectroscopy to the prediction of a simple model as well as the distribution of organic molecules as listed in the Beilstein database.
Liquid chromatography in combination with mass spectroscopy, the standard method for detection of known components, inevitably leads to a preselection of certain molecules among the statistical ensemble of interest. Further, due to the separation on slow timescales from a quasi equilibrium situation in the flask, in our experiments the composition of the broth is very likely to be affected during a chromatographic process. Moreover, the broth contains many reactive molecules that will affect the chemical surface functionalization of more sophisticated chromatography columns, rendering the separation process difficult to control.
Accordingly, we directly injected, without prior separation, the entire broth into the mass spectrometer. Mass spectrometry only detects molecules that can be ionized. Ionization is favored by the presence of certain chemical groups that will accept or lose a charge in form of a proton, electron, or any other charged molecular species. During the ionization process, among the molecules that are injected simultaneously, there is a competition for charge. As a result, molecules more prone to ionization are more likely to be detected. Their presence may even occult other molecular species that could easily be ionized and detected if they were injected in isolation. For our work we use electron spray ionization (ESI). ESI is a soft ionization technique that leaves the molecules intact. With this technique, most molecules will carry a single charge (Gross 2006). Other ionization techniques such as atmospheric pressure chemical ionization may be much more efficient in ionizing molecules, however, they tend to break up the molecules to several ionized fragments. The resolution of our instrument is 33 000 at a mass of 460 (SI figure 2). Since we count only about 1100 detected peaks of interest, it is safe to neglect resolution issues. As shown by (Hawkes et al 2016) on a sample with comparable complexity and mass distribution, the orbitrap mass spectrometer exhibits a visible drop in sensitivity of around 30% in vicinity of m/z 350. A second drop seems to occur around 550. Accordingly the here observed drops in the peak density at masses in vicinity of 350 and 550 (figure 1 and SI figure 7) can most likely be attributed to reduced sensitivity of the instrument, unrelated to the composition of the sample. Evidently our data contains other artifacts due to ion suppression, ionization efficiency and complex formation. We are unable to decide up to which point this skews the observed mass density distribution. However, it is unclear if these artifacts relate to the size of the detected molecules. It may well be that they apply in the same way uniformly over the entire mass range to all the detected molecular species. This is likely enhanced by the fact that for analysis we disregard peak intensities. In such a case the shape of the distribution remains unaffected.
Liquid chromatography (figure 1(b) and (d)) suggested that more and more different molecules are produced throughout the experimental run of 164 h. The employed column separated by size and polarity. With time there was a tendency to produce either larger or more polar molecules. Simultaneously in the mass spectra we observe emerging, smaller molecules. To reconcile the two observations, we suggest that the likelihood of incorporation of oxygen into molecules increased with the experimental running time. Oxygen tends to decrease the size of molecules and increase their polarity at the same time. We suggest that the likelihood of incorporation of oxygen into molecules increases with the experimental running time since the amount of water is quasi unlimited. It is well-known that biomolecules are more stable in a reducive environment (Miller 1953). Chemical reduction of molecular oxygen often leads to production of reactive-oxygen-species, well-known to degrade biomolecules.
In previous work (Scherer et al 2017, Wollrab et al 2016) we showed that oxygen reservoirs appear to build up in the broth, likely in form of peroxides, a direct product from oxygen diradicals created in the discharge. These can even release oxygen radicals (Scherer et al 2017). In the positive ionization mode employed here, oxygen-containing molecules are more easily ionized and will preferentially appear in the mass spectra.
Since in the experiment the molecules were likely to be the result of successive reactive events, that is, a product of highly varying probability distributions, we fitted the experimental distribution with a log-normal distribution. This lead to a mean mass of 317 Da with a standard deviation of 114 Da (SI figure 7). Plotting the fit and the mass distribution from mass spectroscopy in different graphs (Higgins 2006) clearly revealed that a log-normal distribution was much better suited to fit the data than a power-law or an exponential distribution (SI figure 9).
If the formation of molecules was limited by growth processes, a simple aggregation model should reflect the observed distribution. Accordingly, we performed DLA simulations where new particles are given only a limited time frame for finding a place to bind. This corresponds to a fast drop in the plasma temperature of the discharge that leaves limited time for reactions to form new molecules. DLA usually leads to a scale-free distribution, however, depending on parameters, scale free distributions can be mistaken for log-normal distributions. Moreover, we include 'stoppers' that prevent further growth, which may introduce a scale into the model. We find, however, that the simulation is unable to reproduce our results unless we chose the starting point of the new atoms in vicinity to the periphery of the growing molecule (figure 2 and SI figures 10, 11). The corresponding simulation represents not only the shape of the experimentally determined distribution but also meets the observed masses quantitatively. A Gaussian residence time at the periphery of the growing particle was introduced earlier to render the experimentally observed log-normal distribution of growing nanoparticles (Kottler 1950, Irani 1959).
We compared our data to the Beilstein database. This database can be biased by the interest of the chemical community since it builds on published literature. However, we could not identify a more suitable database. Compared to our simulation, the mass distribution from all organic molecules indexed in the Beilstein database represents a much better match to the experimentally determined distribution from the Miller–Urey experiment: deviations from the log-normal fit were highly similar (figure 3, SI figure 8) to our experimental distribution. At the tails the deviations were well approximated by power laws, as for the experimental data (SI figure 6). This exposes a loss of characteristic scale of the mass density distribution for the largest as well as the smallest molecules, so called paretian behavior. Paretian distributions are frequently observed in natural distributions (Reed and Hughes 2002) and can often be compared to the double Pareto distribution, a sum of log-normal distributions with numbers of multiplicative events N distributed as 1/N. In our experiment this would be the case if the growth had a certain probability to stop irreversibly at any size. However, fitting the Beilstein distribution (or our data) with the double Pareto distribution only weakly improves on a standard log-normal fit (SI figure 9).
The initial increase in the density of molecular masses with increasing mass as observed in the Beilstein distribution can at least in part be attributed to a combinatorial increase in possible molecular conformations. The decrease of the mass density at higher masses appears subtler. Although this decrease must represent a limit in molecular stability, macromolecules such as DNA and proteins have a much larger mass than the average mass of the distribution observed here, and they are very stable molecules. With bond energies orders of magnitude larger than kT, bond strength alone is unlikely to explain the limitations in mass.
To gain a crude estimate for combinatorial orders of magnitude, we consider chemical moieties arranged as a string. The chemistry textbook suggests that the interactions among the atoms of a molecule exert an influence on the reactivity of neighboring reaction groups, but rarely beyond a distance of 4 atoms (Bruice 2013). Neglecting hydrogen because of its low mass, any symmetries or chemical rules, we count 34 = 81 reactive moieties from N, C and O on 4 points of a lattice. To reach an average weight of 360 Da with an average weight of 15 per atom, this means 360/15/4 = 6 moieties of four atoms, counting about 816 = 2.8·1011 combinatorial possibilities, considering the 6 moieties arranged as a string. Note that we neglected any conformational degrees of freedom, which would increase this number further by orders of magnitude. Enabling the moieties to have straight or −90° or + 90° turns on a square lattice would multiply by a factor of 36−1, roughly 250 possibilities. The order of magnitude of combinatorial possibilities does not compare well to the total of only 107 different organic molecules of any composition (i.e. including all possible other elements and any possible masses) that can be found in the Beilstein database. From our observations we conclude that only a very small fraction of the combinatorially possible atomic combinations results in very stable molecules.
It is remarkable that the experimentally observed molecular conformations explore the same range and yield the same distribution of mass densities as all the molecules included in the Beilstein database. Accordingly it is unlikely that the experimentally observed molecular distribution is biased by the mechanism of production or detection, rather the experiment seems to span the full chemically accessible mass range without any preferences. We formulate the hypothesis that the Miller–Urey experiment produces a very large distribution of transient molecular configurations (as part of the large combinatorially accessible space) that relax to comparably very few stable conformations. It is possible that such a mechanism leads to the observed mass distribution.
Conclusion
Neither a double pareto distribution nor mean field based growth models fit our experimental results as well as the Beilstein extracted mass density distribution. We therefore suggest that the Miller–Urey experiment is not limited by any growth phenomenon, rather the resulting mass density distribution explores the full range of stable organic molecular masses without any preference. This is surprising given the simplicity of the setup. Moreover, all the supplementary elementary atomic compositions that are part of the molecules indexed in the Beilstein database do not increase the mass density distribution beyond what is already achieved in the experiment with N, O, C and H the only elements (besides the constraint that the molecules must be ionizable for detection). Given that radicals and ions are easily formed in the electric discharge of the Miller–Urey experiment we conclude that the energy transferred to the molecules by the discharge is well above the chemical bond energy. Given this fact and the limited number of stable molecular conformations that exist compared to what is combinatorially possible, it seems reasonable to speculate that in principle all molecules from the Beilstein database based on the here employed elements (C, N, O, H) have a nonzero probability to emerge in a Miller–Urey experiment. This of course does not mean that all of them can be found in a single broth. Moreover, some probabilities may be very low, or some molecules may have a short lifetime in the broth. As a result an impractical experimental effort may well be required to prove their existence. At present we cannot decide if this is so, however, when Urey replied 'Beilstein' to the question what he expected from his discharge experiments (Campbell et al 2005), he may have been right.
Acknowledgments
We are greatly indebted towards Daniel Krug and Rolf Müller (Helmholtz Institute for Pharmaceutical Research and Saarland University) for help with conducting and analyzing the Orbitrap experiments on their instrument. The work has greatly benefited from late Reiner Wintringer's (Analytical Chemistry, Saarland University) help with conducting and analyzing the HPLC measurements. We thank Varun Giri for providing SI figure 13 of the supplementary material. Financial support from the Saarland University and Human Frontier Science Program (Grant number RGP0037/2015) for conducting the research is gratefully acknowledged.