


Abstract
Random walks are often evaluated in terms of their mean squared displacements, either for a large number of trajectories or for one very long trajectory. An alternative evaluation is based on the power spectral density, but here it is less clear which information can be extracted from a single trajectory. For continuous-time Brownian motion, Krapf et al now have mathematically proven that the one property that can be reliably extracted from a single trajectory is the frequency dependence of the ensemble-averaged power spectral density (Krapf et al 2018 New J. Phys. 20 023029). Their mathematical analysis also identifies the appropriate frequency window for this procedure and shows that the diffusion coefficient can be extracted by averaging over a small number of trajectories. The authors have verified their analytical results both by computer simulations and experiments.
Export citation and abstract BibTeX RIS

Original content from this work may be used under the terms of the Creative Commons Attribution 3.0 licence. Any further distribution of this work must maintain attribution to the author(s) and the title of the work, journal citation and DOI.
Random walks are one of the most central concepts in modern physics. In particular, they are the key concept to describe transport processes in complex physical systems, ranging from electrons in solids and colloids in fluids to tracer particles in the geosciences and aerosol particles in the atmosphere of the earth. Another application of high relevance is microscopic transport in biological cells [1]. The three most common techniques to measure transport in living cells are single-particle tracking, fluorescence correlation spectroscopy and fluorescence recovery after photobleaching, each of which requires in-depth mathematical analysis to correctly analyze the experimental data [2]. For example, all of these techniques were instrumental in demonstrating that the crowded environment in cells leads to sub-diffusion of its constituents [3–6]. From these different approaches, single-particle tracking has the special appeal that it might not require any ensemble averaging. As spatial and temporal resolution of single-molecule tracking are rapidly increasing due to experimental advances [7], one has to ask how the measured trajectories can be quantitatively analyzed. Similar questions about single-trajectory analysis arise in many other contexts, for example when analyzing music, earthquake recordings or stock markets.
Usually the study of stochastic trajectories starts with an analysis of the mean squared displacement (MSD), which for Brownian motion reads 〈x2〉 = 2Ddt, with D being the diffusion coefficient and d the spatial dimension. This scaling of distance with time is typical for continuous-time Brownian motion and serves to distinguish it from other random processes, whose scaling ∼tα deviates from the standard value α = 1. For example, biomolecules in cells often show sub-diffusion with a typical exponent of α = 0.7 [1, 6]. For Brownian motion, it has been established early that a sufficiently long single trajectory can be used to extract the ensemble value for the diffusion coefficient [8].
Obviously, the MSD is only one out of many quantities that can be used to characterize a stochastic process. Another standard procedure in the theory of stochastic processes is to investigate the power spectral density (PSD), that is to Fourier-transform the time signal and to study its dependence on frequency f. It is well known that for standard Brownian motion, the ensemble-averaged PSD will obey a ∼1/fβ power-law scaling with β = 2. However, it was not clear before if this scaling can reliably be extracted from a single trajectory, because the corresponding distribution functions are very broad. This question now has been answered positively by Krapf and coworkers [9]. Their mathematical analysis also has resulted in the identification of the appropriate frequency window that now allows us to reliably extract the correct exponent, for example when tracking single biomolecules in cells. In addition, their mathematical results also suggest how to extract the diffusion coefficient D from a PSD-analysis.
In detail, Krapf and coworkers succeeded for the first time in calculating the moment-generating function and the full probability density function of the single-trajectory PSD of continuous-time Brownian motion as a function of frequency and observation time. They found that for sufficiently long trajectories, the single-trajectory PSD S(f) is proportional to its known ensemble-mean μ (f), with the frequency dependence being solely contained in μ (f). The proportionality factor depends linearly on the diffusion coefficient D and a fluctuating dimensionless amplitude A:

Thus, the frequency dependence of the ensemble PSD can already be extracted from a single sufficiently long trajectory, whereas the diffusion coefficient D is occluded by the random scatter of the fluctuating amplitude A (see figure 1). However, the exact solution by Krapf and coworkers also gives the probability distribution of this scattering amplitude in terms of special functions, thus the statistics of the amplitude is now known exactly. Although this means that several trajectories are needed to extract the diffusion coefficient D from a PSD-analysis, this now becomes much easier because a few measurements are sufficient to estimate the full distribution.
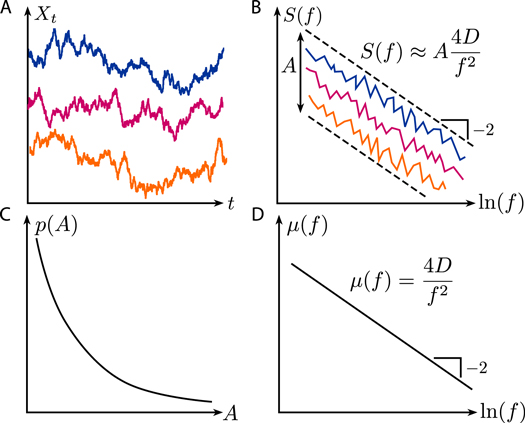
Figure 1 (A) Continuous-time Brownian motion is the standard type of a random walk. (B) Its single-trajectory power spectral density exhibits a power-law decay with exponent β = 2 and a realization-to-realization amplitude scatter. (C) The probability distribution of the amplitude has been calculated analytically and measured experimentally. (D) An ensemble average allows one to also determine the diffusion coefficient D.
Download figure:
Standard image High-resolution image
Another matter of high practical relevance is the question over which frequency window the power-law exponent can be extracted. Here the authors derive both a lower and an upper limit. The lower frequency limit ensures that in an appropriate expansion the scattering amplitude A becomes indeed independent of frequency and observation time, giving rise to the above power-law scaling. In this regime the coefficient of variation of the single-trajectory PSD loses its frequency dependency and converges to its asymptotic limit to any desired accuracy. For discretized Brownian trajectories, which corresponds to the use of a camera with finite framerate, an upper frequency limit is necessary, to ensure convergence of the discretized PSD to its continuous-time counterpart.
Finally, the authors aimed at verifying their mathematical results. They first did this by extensive computer simulations, getting excellent agreement with the analytical results, both for the power-law exponent β and the distribution of the scattering amplitude A. In particular, they showed how the procedure works for different projections (e.g. using one- or two-dimensional projections of a three-dimensional Brownian walk). Very importantly, in a second step they conducted experiments, in which polystyrene beads of diameter 1.2 μm where tracked in aqueous solution. They not only were able to confirm the expected result β = 2 from each single trajectory, but they also measured exactly the predicted fluctuations for the scattering amplitude A. This led to an estimate for the diffusion coefficient of D = 0.373 μm2 s−1 (from averaging over 150 trajectories), which agreed very well with the result D = 0.365 μm2 s−1 from a traditional MSD-analysis.
In summary, the new results by Krapf and coworkers are a complete mathematical analysis of the single-trajectory PSD, clearly laying out what we can learn from it (i.e. the scaling exponent β) and what not (i.e. the diffusion coefficient D). Equally important, their work gives us very detailed instructions on how to do this in practice and is in excellent agreement with experiments. The main limitations of these new results are that they only apply to Brownian motion. Thus, it remains to be seen how much of this elegant analysis can be carried over to other random walks of interest, in particular to the sub-diffusion usually observed for biomolecules in cells, which are believed to result from broad distributions of waiting times. Another important class of random walks of interest would be fractional Brownian motion, which can be either super- or sub-diffusive. As this work suggests, there is hope that in the long run, we might achieve a complete mathematical understanding of the PSD for all of these important classes of random walks.