


Abstract
We investigate the effects of cooperativity between contagion processes that spread and persist in a host population. We propose and analyze a dynamical model in which individuals that are affected by one transmissible agent A exhibit a higher than baseline propensity of being affected by a second agent B and vice versa. The model is a natural extension of the traditional susceptible-infected-susceptible model used for modeling single contagion processes. We show that cooperativity changes the dynamics of the system considerably when cooperativity is strong. The system exhibits discontinuous phase transitions not observed in single agent contagion, multi-stability, a separation of the traditional epidemic threshold into different thresholds for inception and extinction as well as hysteresis. These properties are robust and are corroborated by stochastic simulations on lattices and generic network topologies. Finally, we investigate wave propagation and transients in a spatially extended version of the model and show that especially for intermediate values of baseline reproduction ratios the system is characterized by various types of wave-front speeds. The system can exhibit spatially heterogeneous stationary states for some parameters and negative front speeds (receding wave fronts). The two agent model can be employed as a starting point for more complex contagion processes, involving several interacting agents, a model framework particularly suitable for modeling the spread and dynamics of microbiological ecosystems in host populations.

Original content from this work may be used under the terms of the Creative Commons Attribution 3.0 licence. Any further distribution of this work must maintain attribution to the author(s) and the title of the work, journal citation and DOI.
1. Introduction
Contagion processes abound in nature, ranging from the spread of infectious diseases in host populations [1], the spread of information in social networks [2], the adaptation of technology and norms [3, 4], to activation patterns in neural tissue [5, 6], and escape mechanisms from predators in schooling fish [7]. Dynamical computational models are an essential tool for understanding phenomena in all of these contexts. Their application to the spread of infectious diseases has flourished in recent years [8–11], primarily because of the relevance to human health and the spread of human infectious diseases. Dynamical models cover a broad scope in terms of complexity, ranging from qualitative models that focus on universal features of the observed phenomenon [12, 13], network models that account for population structure or host mobility patterns [14–20], to sophisticated, large-scale agent-based models [21, 22] that incorporate high resolution data on multi-scale transportation, demographics, epidemiological factors, and behavioral response rules. State-of-the-art computational models have become remarkably successful in reproducing observed patterns and predicting the trend of ongoing epidemics.
Most epidemic models focus on the transmission dynamics of single, symptomatic pathogenic bacteria or viruses because in most applications it can reasonably be assumed that the phenomena are dominated by host-pathogen interactions. A variety of infectious diseases exist, however, that interact either directly or indirectly e.g. by altering the susceptibility of the host with respect to infection with another pathogen. Furthermore, transmissions of bacterial microorganism between host individuals is not restricted to species that cause disease. The transmission and spread of commensal or mutualistic bacteria as part of the host's microbiome is generic, in fact also often required to sustain a healthy, host specific microbiome. Especially the transmission of bacterial species of the human microbiome has attracted much attention in very recent studies [23, 24]. Microbiotic species are part of a complex microbiological ecosystem of a host, with a densely connected set of metabolic connections [25]. It is reasonable to assume that these interactions, and the presence of particular species in a host's microbiome impacts the propensity of colonization with another. In social science, the adoption of a certain behavioral patterns may impact the propensity to adopt another pattern if exposed to it. Therefore, it is important to understand the basic mechanisms and effects that are generated by interactions of contagion processes in general.
Early network theoretic work focused on competitive coinfection [26–33] with important applications to infection dynamics of virus strains that induce cross immunity. In these systems different pathogens suppress each other, yielding either single pathogen dominance or coexistance solutions. Multiplex network approaches have been applied in this context [34, 35], for situations when contagion processes unfold along different modes of transmission within the same population [26–28, 36]. In [36] a very general framework for describing two concurrent diseases is introduced, relevant factors such as infection type, impact of the underlying networks, positive and negative interactions are analyzed and discussed.
Only recently, cooperative contagion in which infection with one transmissible agent facilitates infection with another was investigated [36–47]. These studies mainly focused on transient dynamics of the generic susceptible-infected-recovery (SIR) model in which individuals acquire immunity after infection. In [39], a simple SIR coinfection model was investigated within the framework of cooperative bond percolation. This model exhibits avalanche-like outbreak scenarios, depending on the level of cooperation and the structure of the underlying transmission network. Analytical insights [44] have been obtained that explain the role of network topology in cooperative bond percolation systems, in multiplex systems [45], power-law networks [43], as well as sequential coinfection on Poisson networks [37]. Furthermore, it has been found that highly clustered structures in population aid the proliferation of coinfections, contrary to the effect observed in single disease dynamics [41]. Two asymmetrically interacting SIR contagion processes were investigated in [47] and backwards bifurcations, i.e. first order phase-transitions, were identified.
Because most of these models focus on transient SIR dynamics they cannot capture situations in which a steady supply of susceptibles permits the existence of a stable endemic state, such as the susceptible-infected-susceptible (SIS) or SIRs or SIR model with vital processes. An exception is [41] where coinfection of two SIS type processes was investigated using pairwise level approximation. Despite of this, co-contagion systems remain poorly understood and some fundamental issues remain: what basic dynamical features can we expect in cooperative contagion processes? To what extent does cooperativity change the classic outbreak scenario, what is the nature of transitions to endemic states? Can we expect multi-stability and multiple thresholds? How does cooperativity impact spatial propagation?
Here we introduce and investigate a model for the dynamics of two transmissible, interacting agents (labeled A and B). The model is based on the well-known SIS model in which host individuals are either susceptible (S) or infected (I). Susceptibles can be infected with either agent. When infected with say A they can transmit A to other susceptibles. Infecteds remain in the infectious state for a typical period after which they recover and susceptible again. The transmission dynamics of agents A and B are governed by agent specific baseline reproduction numbers and , respectively that describe the dynamics of an agent in the absence of the other. We incorporate cooperativity by two additional parameters, the cooperativity coefficients and that capture influence of an infection with A on the subsequent infection with B and vice versa.


Based on this model, we show that cooperativity between contagion processes generates a variety of interesting properties that are absent in single agent dynamics. For sufficiently strong cooperativity, increasing the baseline reproduction number of one or both agents yields abrupt, discontinuous outbreak transitions and multi-stability (i.e. the coexistence of different stable asymptotic states). Furthermore, cooperativity exhibits dynamical hysteresis, a consequence of the split of the ordinary epidemic threshold into two separate thresholds (an inception and extinction threshold). We derive these features analytically in a deterministic well-mixed model. Their robustness is corroborated by numerical simulations of analogous stochastic dynamical processes on both lattices and generic network systems. Finally we investigate cooperative contagion in spatially extended systems. We show that the interplay of different thresholds and hysteresis yields a rich set of wavefront dynamics and invasion dynamics, e.g. accelerated propagation in certain parameter regimes, stable heterogeneous patterns as well as negative wavefront speeds (receding wavefronts).
2. Cooperative contagion
Our model is an extension of the generic SIS compartmental model: host individuals are either susceptible (S) or infected (I) and change state by two reactions, the transmission of the infection and recovery at rates α and β, respectively. In a well mixed, large, and conserved population the fraction of infected individuals u(t) can be described by . The basic reproduction ratio is defined by . For the trivial state u = 0 is globally stable. If R is increased beyond the critical threshold the system exhibits a transcritical bifurcation, u = 0 becomes unstable and is the stable endemic state in which transmission and recovery events balance. The SIS system thus exhibits a continuous transition as R crosses the critical threshold . Analogous stochastic lattice models in which lattice sites can transmit to neighboring sites and recover exhibit the same type of threshold behavior and a continuous phase transition. Here, we consider a generalization of the SIS model that captures the dynamics of two interacting transmissible agents: A and B. A host can be in one of four states S, A, B, and AB, corresponding to susceptible, infected with A but not B, infected with B but not A, and infected with both A and B, respectively, see figure 1. Transmissions in this system occur by interactions of host individuals in these four different states and can be summarized as follows:


where e.g. represents an individual that is either in state A or in state AB such that e.g. the first reaction represents the transmission of agent A to a susceptible individual. The system is defined by four different transmission rates , , , and that correspond to transmission of A to a susceptible, of B to a susceptible, of A to an individual carrying B, of B to an individual carrying A, respectively. For simplicity we assume uniform recovery rates:


Figure 1. Cooperativity of two contagion processes. Two agents, A and B, spread in a host population. We classify the state of a host individual by letters S (white), A (blue), B (red), and AB (gray) corresponding to being susceptible, infected only by A, infected only by B, and infected by both A and B, respectively. The state of the population can be defined by the subsets , , , corresponding to the sets of susceptibles, infected by A (interior of blue dashed circle), infected by B (interior of red dashed circle), and infected by both (gray area), respectively. Note that the sets and include individuals in state AB. The relative size (fraction of individuals) of , , and is denoted by u, v, w, and , respectively. Contagion dynamics is determined by 12 reactions depicted on the right. Susceptibles S acquire A by interacting with individuals from set (A or AB individuals) at rate . Likewise, susceptibles S acquire B by interacting with individuals in set (B or AB individuals) at rate . Cooperativity means that individuals in state A (B) acquire agent B (A) at higher rates interacting with individuals in set () symbolized by the thicker interaction lines in the reaction scheme. Dashed lines symbolize recovery events.


Download figure:
Standard image High-resolution imageBecause we focus on cooperative contagion we restrict the transmission rates:

cooperativity thus implies that . For example, a value means that transmission of B to an individual already carrying A is 5-fold the transmission compared to the baseline transmission to an S individual. Based on the above reactions one can obtain a set of ordinary differential equations for the fraction of individuals in each state. The reactions above, however, suggest a more suitable set of compartments , , and with the corresponding dynamical variables s, u, v, and w: the fractions of susceptibles, individuals infected with A (including those that are also infected with B), individuals infected with B (including those that are infected with A), and individuals infected with both A and B, respectively, see figure 1. In the limit of a large, well-mixed host population the dynamics is described by


where , and time is measured in units of . For cooperativity coefficients the above system describes two independent contagion processes: if the stable endemic state is given by , , , and


We now consider the effect of cooperativity. In the following and in analogy to the labels used to identify the state of an individual in the population, it is useful to assign the same labels S, A, B, and AB to the potential asymptotic states of the entire host population. We say, e.g., that the system is in state A if only agent A is present in the population, the contagion free state is S, etc. We begin with a symmetric system in which and identical baseline reproduction ratios . In this case the above system reduces to:


Figure 2 illustrates the bifurcation analysis of the system. When the system exhibits a behavior similar to independent contagion processes: at R = 1 we observe a transcritical bifurcation yielding a stable endemic population state AB for . This means that even when cooperativity amplifies transmission rates by up to a factor of two, we see no qualitative dynamical difference.


Figure 2. Bifurcation analysis of cooperative contagion processes. (a) For various values of the cooperativity coefficient ξ the stationary states of the symmetric system equation (6) are depicted. When ξ is greater than the critical cooperativity a regime exists in which the system exhibits three stationary states, the stable trivial state (gray line), another stable endemic state (upper branch, solid red lines) and an unstable intermediate state (dashed red line), see equation (7). In this regime small perturbation to the state will not cause a transition to the endemic branch. Only if perturbations are sufficiently large (crossing the unstable fixed point branch) the system will approach the endemic state. This behavior implies that when subjected to sporadic small perturbations while increasing R, the system will remain near the stable contagion free state until the upper critical point is crossed at which point the system will generate a discontinuous jump, similar to a first order phase transition. The vertical dashed lines illustrate the hysteresis loop. (b) Phase diagram of the system in parameter space, separating three asymptotic states: contagion free, endemic, and bistable, with discontinuous (dashed line) and continuous (solid line) transitions at the interfaces. The circle denotes the tri-critical point at (, ), which separates the continuous and discontinuous outbreak transitions.


Download figure:
Standard image High-resolution imageHowever, when cooperativity exceeds a critical magnitude, i.e. for , a different bifurcation behavior emerges. As R is increased and before the conventional critical point is reached, a saddle-node bifurcation emerges at . When , in addition to the trivial stable state S, two AB stationary states exist:


one of which is stable, the other unstable. Thus, when sufficiently small perturbations to the S state will have no effect as S is stable. However, when perturbations are sufficiently large, the system will approach the endemic AB state with . Furthermore, when R is increased beyond the critical value , state S loses stability and any arbitrarily small perturbation will yield a discontinuous jump to the endemic state, reminiscent of a first order phase-transition. For example when with the stable endemic state is , . So if say this yields an endemic state in which 71% of the population is in state AB, immediately after Rc is crossed. Cooperative contagion also exhibits hysteresis: starting with and state AB, decreasing R across the critical value Rc from above will not result in immediate extinction. A high endemic state is maintained until the eradication threshold Re is reached, which can be substantially smaller than the ordinary epidemic threshold Rc. Decreasing R below Re will then yield a sudden collapse of AB into S. These newly observed dynamics is also termed as backward bifurcation, and its ocurrence mathematically could come from quite different aspects [47–50]. It is also worth to note that complex contagions through reinforced infection via different neighboring nodes but of single agent can also generate a similar phase transitions [51, 52].


Equation (6) capture the symmetric special case of the more general system defined by equation (4), the latter of which has four parameters, , , , and . Figure 3 illustrates the phase diagram for a more general choice of these parameters. Fixing the cooperativity coefficients to we investigated the phases of the system as a function of baseline reproduction ratios and . Apart from the expected stable states we observe a rich variety of bistable states in the region in which baseline reproduction is near unity, as is illustrated in figure 4. For example, when and starting with the system is initially in state B. Increasing further a saddle-node bifurcation occurs and the system enters a regime in which B and AB are both stable. When , e.g. , increasing first yields an ordinary transcritical bifurcation to the A state, followed by a second bifurcation into a regime in which A and AB are stable, and finally, a third bifurcation to into the regime in which only AB is stable, see also figure 3. A key property of the system is that the complexity of transitions is only observed for baseline reproduction ratios near unity. If one baseline reproduction is too low or two high, only a single ordinary transitions and no state coexistence is observed. This is an interesting property from an evolutionary point of view. When new strains of transmissible agents emerge, typically they are not adapted to the host and possess baseline reproduction not significantly larger than unity, or even smaller. Cooperativity with other transmissible agents and coexistence of stable endemic states may present an opportunity for developing a species rich system with higher evolvability. This type of complexity is expected to increase dramatically when more than two transmissible agents are involved, yielding a potentially rich space of stable states and an increasing complexity in phase separation manifolds in parameter space.


Figure 3. Phase diagram of generic cooperative contagion for fixed cooperativity coefficient . In the parameter space spanned by the baseline reproduction ratio RA and RB we observe four phases in which only a single stable state exists: S (region I), A (region II), B (region III), and AB (region IV). When baseline reproduction is near unity the system exhibits additional regimes characterized by coexisting stable states (bounded by the black dashed lines): coexistence of S and AB (region I+IV), of A and AB (region II+IV), B and AB (region III+IV). Regimes are separated by different types of bifurcations. Solid lines represents the ordinary transcritical bifurcation, dashed lines represent discontinuous transitions. The black circles denote tri-critical points where bifurcation types merge. The two horizontal dashed lines correspond to the panels depicted in figure 4.

Download figure:
Standard image High-resolution image
Figure 4. Bifurcations in asymmetric cooperative contagion. The asymptotic prevalence and of agent A and B, respectively, as a function of baseline reproduction ratio for fixed and cooperativity coefficient , as indicated in figure 3. (a) For , a hysteresis structure emerges for agent A between and the AB state branch, while for infection B the hysteresis structure spans endemic state () and the coinfection AB branch. (b) For subcritical baseline , prevalence of A exhibits two outbreak transitions: (i) the classical transcritical bifurcation at , (ii) a saddle node bifurcation with a hysteresis formed between an endemic () and the coinfected branch within . Note that the second, discontinuous jump in u when is increased beyond is caused because the state loses stability at this point.


Download figure:
Standard image High-resolution imageThe deterministic model discussed above cannot account for fluctuations or population heterogeneities. An important question is therefore whether the observed phenomena prevail in a more complex scenario in which transmissions and recovery events are stochastic, the host population is finite and not every host interacts with every other host at equal rates. Typically, stochastic effects in a well-mixed system are modeled by birth-death type stochastic processes equivalent to the reactions depicted in figure 1 and generating solutions to the corresponding master-equation for a fixed but finite population size N. Population heterogeneities are typically addressed by modeling these processes on fixed network topologies or lattices in which host individuals only interact with the neighbors defined by the network links. In order to address the robustness of effects and properties derived for the deterministic system of equation (4) we investigated cooperative contagion dynamics in a stochastic 2d-lattice system and and Erdős-Rényi (ER) network with equal mean degree and number of nodes. The results are compiled in figure 5. In both cases, we observe hysteresis, and a separation of extinction and outbreak thresholds for large cooperativity coefficients ξ. Interestingly, the extinction transition is continuous in the lattice, a consequence of the local coupling of the system. The ER network exhibits discontinuous transitions, as predicted by the above mean field treatment. This is not surprising as the ER network is topologically more similar to the well-mixed scenario, and lattice of low dimension like 2D is physically far from that. Based on these observations, we believe that the key features of cooperative contagion can be expected also in more realistic, structured populations6 .
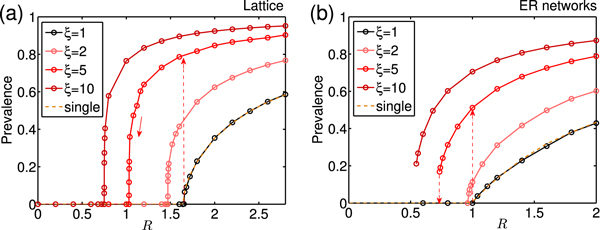
Figure 5. Phase transitions of prevalence (either A or B) in stochastic network models. Cooperative contagion on (a) 2D square lattices (with size 100 × 100) and (b) ER networks (with network size N = 10 000 and average degree ). The reproduction ratio is defined as where α is the transmission rate across a link. To investigate the extinction threshold, the simulations (with Gillespie algorithm) are initiated with complete prevalence. The transitions is obtained by decreasing R. Outbreak transitions are only possible when R is close to the threshold of single infection if the population starts with tiny infected fraction, e.g. two remote infected nodes with A, B respectively. The thresholds of single infection Rc are around 1.64 and 1 respectively in (a) and (b), while a smaller eradication threshold is expected in strong cooperative cases as shown, therefore a hysteresis structure is formed in line with the above mean field theory.


Download figure:
Standard image High-resolution image3. Wave propagation in spatially extended systems
An important aspect of contagion processes is their spatial propagation. When simple contagion processes with are seeded in a spatially homogeneous susceptible host population and contagion dynamics is combined with diffusive dispersal of the host these systems typically exhibit propagating wavefronts that travel at constant speeds. The endemic state invades the unstable S domain. The generic SIS contagion process, e.g., can be described by:


where is the density of infected individuals at location at time t. The combination of local initial exponential growth (for ) and diffusion yields a front-speed depending on the basic reproduction ratio and diffusion coefficient D: . This is a generic feature of processes that exhibit pulled fronts [53]. Given the more complex nature of cooperative coinfection, especially the dynamical bistability for intermediate baseline reproduction ratio and large cooperativity coefficient ξ, we can expect a richer set of phenomena when cooperative contagion processes expand in space. To account for a diffusing host we extend equation (4) and consider the corresponding reaction–diffusion system:


where D in last terms is the diffusion coefficient and the functions fu, fv, and fw are the same as on the rhs of equation (6). The dynamical variables are function of time t and space , e.g. . We assume that the diffusion coefficient is constant and independent of the state of a host individual primarily focusing on contagion processes that do not affect the host's dispersal behavior. We also consider a constant overall density which implies that at every position . As before we use labels S, A, B and AB to refer to region that are contagion free, only affected by A, only affected by B, and both A and B, respectively.


The system defined by equation (9) exhibits a range of front velocities, each one corresponding to different states invading regions in a different state. For example a localized A-patch invades an S-region at a different speed than a uniform B-region (turning the latter into an region). A localized AB-patch invades an S-region differently than an A-region. To understand the asymptotics and transients of the system we first consider a uniform population in state S, with the exception of two localized patches, each being in state A and B respectively and separated by some distance, see figure 6. When cooperative contagion plays no role at the beginning, each patch will expand at a constant front speed of . Once these growing patches touch, cooperativity kicks in at the A–B interface. The emerging AB-nucleus has interfaces to the A and B regions as well as to the S region. For the invasion of AB into the S-region is faster at a speed as expected. Interestingly, the invasion of the region into A-region (and B-region) occurs at an even higher speeds . Using a propagating wave ansatz for a 1-d spatial support (analogously for variables v and w) one can compute a lower bound . Because the system will eventually converge to a uniform AB-region that spreads at speed . Regions affected only by one agent will not persist. This effect of enhanced wave-front speed might be particularly relevant in situations in which a covert, unknown and commensal agent is endemic in some region and a known process with known baseline reproduction ratio expands somewhere else in the system at a speed that is computed based on its baseline reproduction ratio. If this front enters the region in which the unknown but highly cooperative covert agent prevails, a sudden but potentially unexpected boost in the proliferation of the initial spreading process could occur.


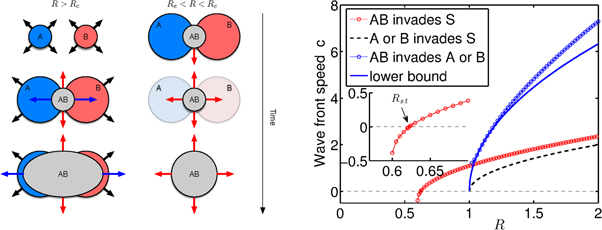
Figure 6. Spatial dynamics of cooperative contagion processes. Left: when initially separated region of only A or B affected regions grow with a front speed equivalent to single SIS dynamics, (black arrows). When the wave fronts touch, a region of coinfection emerges (gray). This region touches the regions of susceptible (white background) and on each side region that are dominated by either A or B yielding two new front speeds associated with AB invading A or B (blue arrow) and AB invading S (red arrow). Invasion of AB into the susceptible region occurs at a speed the blue/red regions occurs at a speed . In this transient phase, the patterns is shaped by three front speeds of different magnitude. This implies that the intermittent AB invasion will take over the entire pattern and eventually only the AB region will propagate into the susceptible region. When initially separated A and B regions cannot be sustained and will relax to the contagion free state. However, if initially a small overlap exists (a nucleation of AB) the pattern will eventually converge to AB invading S as well despite the fact that . Right: comparison of the three wave front speeds ( red circled line, black dashed, blue circled line) as a function of R in 1d space, together with a lower analytic bound for (blue solid line). The inset shows that in the invasion of AB into the susceptible region, the speed is positive for , and negative for , with and . Parameters: , D = 1.


Download figure:
Standard image High-resolution imageIn the bistable region , isolated islands of A nor B cannot persist. If we initialize the system with A and B patches that share a small overlapping region in the AB state cooperativity can yield the survival of the AB state while the homogeneous A and B states fade. The remaining AB patch then proliferates at speed . Interestingly, we observe negative propagation speed in this regime, , which implies a receding AB-region. This behavior is caused by the dispersal of A or B affected individuals into the S-region in which the S-state is also stable. Once individuals enter this state, they have a higher likelihood of becoming susceptible than being colonized by both agents. The wavefront acts as a drain for infected agents and a competition exists between the supply of new agents of type A or B and the diffusive dilution of their concentration. For a critical choice of parameters, e.g. the baseline reproduction ratio we observe a stationary heterogeneous solution, an immobile front, that separates S from AB regions. Figure 7 illustrating the three typical propagation modes in 2d space are depicted (see also the movies in the supplemental materials7 , available online at: stacks.iop.org/NJP/19/103041/mmedia).


Figure 7. Three typical contagion propagation modes in 2D space. Top panels (a) forward propagation (R = 0.65). Middle panels (b) standing front (). Bottom panels (c) backward propagation (R = 0.61). The infected fraction is color coded. The sequence (from left to right) of panels depicts the time course of the infected regions at time t = 0, 100, 200, 300, respectively. Here Rst is slightly different from the value in 1D space, up to the dimension correction. Initial conditions start from some randomly infected round regions with random radius as shown in the first column. Other parameters: D = 1, , where .


Download figure:
Standard image High-resolution image
The emergence of new front wave propagation modes is dynamically rooted in the multi-stability of coinfection dynamics. The next step would be an analytical derivation e.g. of the dependence of Rst on system parameters and physical quantities. This remains an open question, and some previous studies offer a good starting point [54–57]. For example, [55] studied a cooperative reaction–diffusion system analytically, in which one species diffuses while the other is immobile.
4. Discussion
We present a reaction kinetic model for the dynamics of cooperative contagion of the SIS class. The most prominent property of the model is the existence of discontinuous transitions to an endemic state when the traditional outbreak threshold is crossed and a separation of outbreak and extinction thresholds, the magnitude of which depends on the degree of cooperativity. Although we derive the key properties analytically and numerically in a deterministic model suitable for large, well-mixed populations, we observe the key features of discontinuous transitions also in a stochastic network variant of the model. The system of two cooperating agents that proliferate in a host population exhibits diverse properties when spatial diffusion is incorporated yielding different types of transients and spreading speeds.
The proposed model and presented results can be employed and adapted to understand realistic systems, e.g. pneumonia in which with bacterium like Streptococcus pneumoniae interacts with viral respiratory infections (e.g. influenza viruses), where one pathogen increases the susceptibility towards the other up to 100-fold [58, 59]. Another prominent example are human immunodeficiency virus (HIV) syndemics [60], where the suppressed immune system of the hosts greatly increases the susceptibility towards secondary infections: hepatitis, malaria, syphilis, herpes virus and tuberculosis. In the latter case, the cooperative interactions are mutual, as hosts with tuberculosis are found also more likely to acquire HIV [61, 62]. These new complexities uncovered in our study suggest that we may need to devise new containment strategies, e.g. by vaccination programs [63], to combat the epidemic spreading in some more realistic circumstances.
Although we discussed the model predominantly in the context of the spread of transmissible diseases, the model is sufficiently generic to be applied to other transmissible contagion processes that influence each other cooperatively, e.g. the adoption of one technology may increase the infection of a user with another type of technology which may then occur explosively or at different speeds than expected. While in the context of epidemic spreading, the implication of our results is bad news for the infection and is detrimental, but in the majority of other contexts such as social contagions, where a high prevalence is usually desired, our results are good news indeed.
Considering a model for only two interacting agents is a foundation that can easily be generalized to a larger number, potentially a network, of interacting agents. If the baseline reproduction of a family of transmissible agents is in the critical regime, we expect in such a system a diverse set of stable configurations and we believe that the model presented here is a helpful starting point for investigating these more general systems.
Acknowledgments
LC and FG would like to thank W Cai and P Grassberger for valuable comments and discussions. DB acknowledges fruitful discussion with Osamah Hamouda and Imbish Mortimer and Annegret Tierkrper. LC would also like to thank the hospitality of Beijing Computational Science Research Center (CSRC) for a pleasant stay during the final revision stage.
Author contributions
LC, FGh, DB conceived research, LC and DB developed dynamical model, LC, DB theoretical, analytical treatment of mean field and spatial model, LC performed numerical analysis. DB and LC wrote manuscript.
Footnotes
- 6
An online interactive d3 webpage is available for playing at http://rocs.hu-berlin.de/D3/cosis/.
- 7
See supplemental material in the attached files for movies illustrating the three wave propagation modes.