


Abstract
We experimentally investigate the fast ( ) isochoric heating of multi-layer metallic foils and subsequent high-pressure hydrodynamics induced by energetic electrons driven by high-intensity, high-contrast laser pulses. The early-time temperature profile inside the target is measured from the streaked optical pyrometry of the target rear side. This is further characterized from benchmarked simulations of the laser-target interaction and the fast electron transport. Despite a modest laser energy (
 ), the early-time high pressures and associated gradients launch inwards a strong compression wave developing over
  ps into a
  blast wave, according to hydrodynamic simulations, consistent with our measurements. These experimental and numerical findings pave the way to a short-pulse-laser-based platform dedicated to high-energy-density physics studies.
Export citation and abstract BibTeX RIS

Original content from this work may be used under the terms of the Creative Commons Attribution 3.0 licence. Any further distribution of this work must maintain attribution to the author(s) and the title of the work, journal citation and DOI.
1. Introduction
The controlled production of extreme pressures and temperatures in dense samples is of prime interest for the study of structural and dynamic properties of matter, with applications in planetary science [1, 2], astrophysics [3] and inertial confinement fusion [4, 5]. Currently available high-energy (∼kJ), long-pulse (∼ns) lasers can be used to shock compress materials up to pressures of  [6, 7]. Alternatively, in this article, we explore the capability of ultra-intense (
 ), utra-short-pulse (
 ), sub-Joule energy lasers to isochorically create hot dense matter, at
  temperatures and
  pressures, as well as the possibility of driving strong shocks of relevance for laser-fusion [5, 8] or high-energy astrophysical phenomena [3, 7].
It is well known that ultra-intense laser pulses interacting with solids generate relativistic electron beams (REBs) that are capable of transporting tens of percent of the laser energy deep into the targets [9, 10]. The subsequent slowing down of the REB, through both direct collisions and self-generated fields, results in the heating of the bulk plasma [11–22]. Depending on the laser parameters, this takes place over time scales ranging from a few tens of fs to a few ps, i.e., prior to the hydrodynamic response of the heated material. The broad energy spectrum and finite radius and divergence of the REB give rise to a temperature profile steeply decreasing from the front surface, hence launching inwards heat and compression waves possibly developing into a shock [15].
In this paper, we provide experimental evidence for blast wave generation through the interaction of a high-contrast, sub-Joule laser and a metallic-foil target. Benchmarked radiative-hydrodynamic simulations reveal that the compression wave evolves into a shock of  Mbar pressure (in a Cu layer embedded into Al at shallow depth) over a micrometer scale in
  ps, prior to significant heat conduction. As the shock front moves deeper into the target, its pressure drops rather rapidly because it is not sustained by continuous energy injection, and hence obeys the Sedov–Taylor (ST) similarity solution [23, 24]. It should be noted that radiative blast waves initiated by relativistic laser-plasma interaction were first experimentally investigated in [25], yet using a much longer (20 ps) and energetic (
 ) laser pulse than in our conditions. Moreover, in contrast to the simple hydrodynamic analysis presented in that work, we here provide a comprehensive numerical modeling of our data that treats all the relevant kinetic and rad-hydro phenomena.
2. Methods and experimental results
The experiment was carried out using the UHI100 laser (CEA/IRAMIS, Saclay, France), delivering  wavelength pulses of
  energy and
  full-width-at-half-maximum (FWHM) duration. The laser was focused at
  incidence onto flat solid foils by a
  off-axis parabola. About 40% of the laser energy was contained into a
  FWHM focal spot, yielding
  maximum intensity. The targets were
  foils, composed of an Al rear layer of varying thickness (1, 6, 10 or
  ), coated on the laser side by a
  thick Cu layer (used as a REB tracer by detection of
  x-ray fluorescence; results to be detailed elsewhere), and a
  thick Al interaction layer (figure 1(a)). The total thickness of the target ranged from L = 5 to
  . A double plasma mirror system allowed both the amplified spontaneous emission pedestal and pre-pulses to be reduced below the target ionization threshold. An intensity contrast of
  was measured over a 1 ns duration before the laser peak [26], ensuring that the laser pulses interacted with unperturbed solid-density targets.
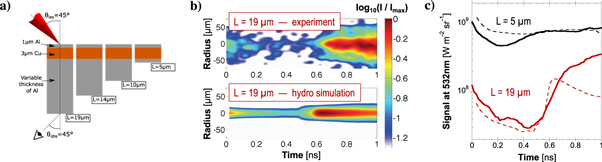
Figure 1. (a) Schematic of the experimental setup. (b) SOP signal measured for a target thickness  (top) and equivalent image obtained from a 2D axisymmetric hydrodynamic simulation of the target following REB-induced heating—both images are normalized to their respective maxima and presented in logarithmic color scale. (c) Time evolution of the experimental rear-side emissivity in the spectral range
  (solid lines) for L = 5 (black) and
  (red), compared with hydrodynamic simulation results (dashed lines).
Download figure:
Standard image High-resolution imageThe REB energy deposition was investigated by imaging the optical emission from the target rear side onto an absolutely calibrated, S20-photocathode streak camera (streaked optical pyrometry, SOP). The space–time resolution was of  and
and  . An interferometric filter centered at
  was used to suppress the REB-induced coherent transition radiation, peaking at multiples of the laser frequency [15, 27, 28]. The top image of figure 1(b) shows the signal obtained for
  . The time origin (t = 0) coincides with the laser peak. Figure 1(c) presents the space-averaged emissivity as a function of time for
  (solid black curve) and
  (solid red curve). The early-time signals correspond to the prompt thermal emission induced by the REB-driven heating of the target rear side. This emission decays away (over a
  time-scale) as the target surface expands and cools down [29, 30]. The late-time emissivity rebound (at
  and
and  for
for  and
and  , respectively) is related to the hydrodynamic evolution of the initially solid target. Since the high laser contrast rules out any hydrodynamic perturbation prior to the laser peak, the long-time-scale target emission is only determined by the REB-induced heating profile, as analyzed in [15]. Remarkably, the emissivity rises more significantly and steeply for
  (
( ) than for
  (
( ), corresponding in the former case to a blast wave breakout through the rear surface (see below).
3. Early-time emissivity and the isochoric heating by fast electrons
The early-time electron temperature, Te, reached at the target rear surface, was measured from the emissivity at  , averaged over a
  radius around the signal maximum, and assuming a Planckian-type emission. The measurements are accurate to within
  , owing to the absolute calibration of the streaked detection system. The circles in figure 2(a) display the temperature values obtained for different target thicknesses: the plotted values and their respective error bars account for the mean and the standard deviation measured from several shots with identical targets. The rear-side temperature is seen to drop from
  for
for  down to
  for
for  , due to the spatially decreasing REB energy-density flux.

Figure 2. (a) Measurements of the early-time background electron temperature, Te, as a function of the target thickness L (circles) and corresponding spatial profiles, along the REB propagation axis, from 3D hybrid transport simulations (solid curves). The red dashed curve is the corresponding pressure profile for  (right-hand side ordinates). (b) Te versus target depth for
  : experimental data (circle) and results from 2D PIC-collisional (dashed curve) and 3D hybrid transport simulations (solid curve). (c) Zoom over the laser interaction region of the initial maps (t = 0) of temperature (top), pressure (bottom contour lines) and pressure-gradient (bottom arrows) in the 2D axisymmetric rad-hydro simulations. The horizontal axis corresponds to the REB direction of propagation
  .
.
Download figure:
Standard image High-resolution imageWe performed kinetic simulations of the REB generation and transport describing the early-time isochoric target heating, followed by hydrodynamic simulations of the subsequent target evolution to better understand the experimental data. First, we used the 2D particle-in-cell (PIC) code calder [32] to model self-consistently the laser-plasma interaction, electron propagation and target heating. The code describes field ionization [33], as well as elastic and inelastic collisions [34]. Our Monte Carlo binary-collisional scheme includes a Lee-More-type correction [35] in the dense/cold plasma regime. Due to computational limitations, we only treated the case  . Given the high laser intensity contrast, the target was initialized as a steep-gradient, solid-density plasma slab. We considered an initial
  temperature and an ionization state given by the Thomas–Fermi model (
 ,
,  ). The laser profile was taken to be Gaussian in space and time, and its parameters reproduced the experimental values. The mesh size was
  . A fourth-order weight factor and an alternating-order interpolation scheme [36] were employed to mitigate the numerical heating intrinsic to high-density PIC calculations. The simulation was initialized with 200 particles per cell and per species (electrons, Al3+, Cu5+ ions). Note that the total number of particles significantly increased with time as a result of field and impact ionization.
The REB source angle and energy distributions were extracted at a distance of  beyond the irradiated surface. Figure 3(a) shows the angle distributions for different kinetic energy ranges (as labeled), extracted at the laser peak power. For each energy range, the respective curve can be modeled by a Gaussian function
 ![$f(\theta )=\exp \left[-{\left(\tfrac{\theta -{\theta }_{0}}{{\rm{\Delta }}\theta }\right)}^{2}\right]$](https://content.cld.iop.org/journals/1367-2630/19/10/103005/revision2/njpaa806bieqn61.gif) , where
, where  is the mean propagation angle with respect to the target surface normal and
  is the angular dispersion around that mean value. Both parameters have a very weak dependence with time. While
  diminishes with the electron energy (faster electrons are better collimated), the
  dependence fairly agrees with the formula proposed in [37, 38],
  (where γ is the electron Lorentz factor), assuming conservation of the transverse canonical momentum in the boosted laser frame. The most energetic electrons are emitted close to the laser propagation axis,
  , while the slowest are preferentially injected along the surface normal. Figure 3(b) shows the kinetic energy distribution of the REB (solid black curve). As previously reported from both theoretical [39, 40] and experimental [20, 21] studies, the low-energy part of the spectrum is best described by a decreasing power-law function. In our case, the extracted energy distribution is well fitted by
  for
for  keV and by
  for
for  keV (dashed red curve). The REB distribution (of energies
  ) carries
  of the laser drive energy, with a mean kinetic energy of
  . The relatively low value of the laser-to-REB coupling efficiency follows from the short duration and high contrast of the laser pulse.

Figure 3. REB source angle and energy distributions extracted from the PIC simulations at the  surface, to serve as input for the hybrid transport simulations. (a) Angle-distribution functions for different ranges of the non-thermal electrons kinetic energy. (b) Energy-distribution function (solid black), compared to the analytical fit function detailed in the text (dashed red).
Download figure:
Standard image High-resolution imageFigure 2(b) shows the electron temperature Te profiles obtained for  from the PIC (dashed curve) and PIC-hybrid transport (solid curve, see below) simulations. In the PIC simulation, Te is computed from the mean energy of cold electrons (with energies
  ) at
) at  after the on-target laser peak. At a given longitudinal position, x, the temperature is averaged around the transverse position of its maximum over a
  width. At this time, the REB has not yet reached complete relaxation but it has spread enough from the irradiated region that the bulk temperature profile is no longer varying significantly along the loci of the temperature maxima. The transverse position of the maximum temperature increases linearly with x, corresponding to an effective REB propagation angle of
  with respect to the target surface normal. The temperature profile is strongly inhomogeneous, peaking around
  close to the target surface, and dropping to
  at the Al/Cu interface (
 ). Further away, Te decreases at a slower rate, reaching
  at the target rear side (
 ). As a result, ultra-high pressures (
 ) are generated over the target depth.
In order to simulate thicker targets, we used the 3D pâris hybrid transport code, which employs a PIC description for the REB and a generalized Ohm's law for the background electrons [42, 43]. The REB source was extracted from the PIC simulation as described above. While the two temperature profiles for  in figure 2(b) qualitatively agree, they present quantitative differences over the first
  of the target. While the PIC results exceed (up to a factor of ∼2) the hybrid results over the front (
 thick) Al layer, they are lower (by a factor of ∼0.6) than the hybrid results in the
  thick Cu layer. The discrepancy found close to the irradiated surface may point to the questionable validity of a few simplifications underlying the hybrid transport model, such as discriminating between hot and bulk electron populations and neglecting the short-scale electromagnetic (EM) modulations induced by the REB [44, 45]. These simplifications may suffice to alter the REB propagation and field generation in a non-trivial way far from the laser region, notably because the EM modulations are observed in the PIC simulation to extend throughout the target, i.e., well beyond the surface through which the hot-electron distribution is extracted to serve as input for the hybrid code. Now, the lower PIC-predicted heating in the Cu layer may also stem from the different models of electrical resistivity and equations of state implemented in the collisional PIC and hybrid codes (respectively detailed in [34, 43
]), and, particularly, to their respective sensitivity to the non-equilibrium (
thick Cu layer. The discrepancy found close to the irradiated surface may point to the questionable validity of a few simplifications underlying the hybrid transport model, such as discriminating between hot and bulk electron populations and neglecting the short-scale electromagnetic (EM) modulations induced by the REB [44, 45]. These simplifications may suffice to alter the REB propagation and field generation in a non-trivial way far from the laser region, notably because the EM modulations are observed in the PIC simulation to extend throughout the target, i.e., well beyond the surface through which the hot-electron distribution is extracted to serve as input for the hybrid code. Now, the lower PIC-predicted heating in the Cu layer may also stem from the different models of electrical resistivity and equations of state implemented in the collisional PIC and hybrid codes (respectively detailed in [34, 43
]), and, particularly, to their respective sensitivity to the non-equilibrium ( ) thermal conditions at play here.
The overall consistency of these calculations, however, gives us confidence in hybrid simulations for thicker targets at early times. The temperature profiles obtained for  are plotted in figure 2(a) (solid curves). Each simulated curve matches the corresponding experimental data (circles) at x = L. Moreover, the curve for the thickest target (
 , thicker red curve) nicely fits all data points. This suggests that, in all considered cases, the hot electron refluxing, which is expected to decrease with L [31], weakly affects the on-axis heating of the target rear side. Our data thus gives direct access to the longitudinal heating profile in the thickest target. The very high temperatures found close to the laser-irradiated surface, on the order of
  , agree with previous works conducted at similar laser intensity and power, but with 100 times higher energy [48].
We have verified that resistive effects play a major role in the target heating along the REB propagation axis, at least up to  depth, consistently with a REB current density
  [15, 20, 21, 41]. The simulated longitudinal electric field is of
  over the whole target thickness during the first transit of the REB through the target. The field strength drops by an order of magnitude after electron reflection at the rear surface, and goes on decreasing rapidly later on. Therefore, the electric stopping power experienced by the REB is initially of
  . By comparison, the collisional stopping power for a mean electron energy of
  is of
is of  in Al and of
  in Cu. The higher density and the lower initial resistivity of the Cu layer yield the observed variations in the thermal gradients at the Al/Cu (
 ) and Cu/Al (
 ) interfaces. Due to the combined actions of resistive and collisional stoppings, one estimates that about 75% of the initially injected non-thermal electrons (of energy
  keV) deposit their energy (
 of the injected non-thermal energy) into the first two layers (up to
  depth).
4. Late-time emissivity and blast-wave formation
The evolution of the target following the fast REB-induced heating, which accounts for the late-time SOP signals of figures 1(b) and (c), was simulated using the 2D axisymmetric Lagrangian radiation-hydrodynamic code chic [46, 47]. The ionization and the opacity data are tabulated, assuming a local thermodynamic equilibrium LTE or a non-LTE depending on the local plasma parameters at each time step. The radiative transport is computed assuming that the radiation field is quasi-stationary and weakly anisotropic (multigroup diffusion). The code makes use of the QEOS [49] equation of the state, which describes the electron properties through a modified Thomas-Fermi statistical model, and the ion thermal motion through a multiphase model combining Debye, Grüneisen and Lindemann laws.
The system was taken to be symmetric along the direction of the REB-heating profile, thus yielding the oblique longitudinal coordinate  and the simulated target lengths of
  . The rad-hydro simulations were initialized using the results of the hybrid transport simulations: figure 2(c) shows the initial maps (in the coordinates of the rad-hydro simulations) of the temperature (top), pressure (bottom, contour lines) and pressure gradient (bottom, arrows) around the target front. Moreover, the initial longitudinal profile of the pressure for
  is plotted as a dashed line in figure 2(a). Strong longitudinal (
 ) and oblique (
 ) pressure gradients are seen in the Cu layer at depths
  and radii
  .
.
Figure 4 displays results from the rad-hydro simulation for  . Due to the high pressures (
 ) induced on axis over the front Al layer, the target surface rapidly expands into vacuum and a rarefaction wave is launched inwards. Plasma expansion also occurs at the rear side, but at a slower velocity because of the lower local temperature (
 ). A compression wave is driven off axis by the oblique pressure gradients, but not on axis due to the fast rarefaction wave. In contrast to standard ns laser-driven shock formation [50], the compression wave that forms here is not preceded by a thermal wave precursor. As seen in figure 4(a), a shock has already built up at
  at a depth of
  beyond the Al/Cu interface and at a transverse position
  . At the shock front in the Cu layer, the pressure reaches
  (i.e., about twice the upstream pressure value) and the density is raised to
  (compression factor
  ).
).
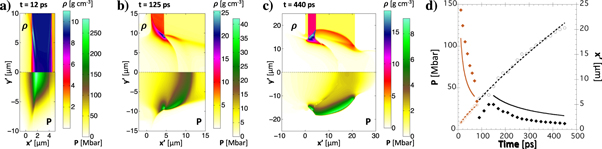
Figure 4. (a)–(c) 2D axisymmetric rad-hydro simulations of the REB-heated,  thick target along the REB direction of propagation
  (density (top) and pressure (bottom)): (a)
  ps: the shock is formed off-axis and propagates into the Cu layer; (b)
  ps: the shock has been transmitted to the rear Al-layer; (c)
  ps: the shock is about to break through the target rear,
  off the REB axis. (d) Inward blast wave front pressure (left-hand side ordinates: rad-hydro simulation results (diamonds) and Sedov–Taylor modeling (solid curves)) and longitudinal position (right-hand side ordinates: simulation (circles) and power-law fits (dashed curves)) as a function of time. Orange and black symbols/curves stand for the Cu-layer and the rear Al-layer, respectively.
Download figure:
Standard image High-resolution image
The above observations can be understood by comparing the expected shock-formation time, that is, the time needed to convert the initial pressure gradient into a supersonic flux of matter,  (with cs the local acoustic speed,
  the local fluid acceleration and ρ the local mass density), with the transit time of the rarefaction wave,
  (where the depth
  is taken to be the observed shock formation length
  ). The high on-axis upstream temperatures (
 eV) lead to
  50 ps
50 ps  25 ps, so that no shock is launched longitudinally. Along an oblique direction, by contrast, the upstream temperatures are much lower (
 eV) and the pressure gradient is strong enough to generate a shock in
  10 ps (
 ps).
ps).
Figures 4(b) and (c) show the oblique shock propagating in the thicker, rear-side Al layer at later times: the shock-front peak pressure decreases from  30 Mbar at
  (figure 4(b)) to
  Mbar at
  (figure 4(c)). The corresponding compression factor of the Al layer drops from 3.7 to 2.6. Figure 4(d) displays the time evolution of the shock-front pressure (full diamonds, left-hand side ordinates: orange over the Cu layer, black over the rear Al layer) and longitudinal position (open circles, right-hand side ordinates). The initial shock speed in the simulation,
  , decreases from
  at
at  ps to
ps to  at
at  ps, which is in fair agreement with the theoretical prediction
  for the initial Cu pressure and density. In the Cu layer, the shock pressure is found to decrease with time as
  , remaining in excess of
  till
till  . Its sudden drop (to
  ) follows from the shock transmission into the rear Al layer. It reaches a maximum of
  30 Mbar in Al at
  ps, and then decreases as
  . The decreasing trends of the shock-front pressure in each of the two materials are fairly well predicted by the ST model (solid curves) [24],

 where
where  is the density at the shock-front and
  is the specific heats ratio.
The blast wave breaks out through the rear surface at  (figure 4(c)), at a transverse distance of
  , from which ensues a rapid increase in the optical emissivity of the rear surface (solid red curve in figure 1(c)). For a direct comparison with the experimental data, the simulated emissivity was convolved by a
  FWHM Gaussian function in the target rear plane modeling the response function of the SOP detector. The resulting synthetic emissivity (bottom image in figure 1(b) and dashed red curve in figure 1(c)) matches well the experimental signal, both in terms of chronometry and strength. The discrepancy between the measured rear-side emissivity and the hydrodynamic simulation at
  is probably related to the fact that the synthetic emission is integrated over
  , while the collection of the experimental radiation is limited to the small aperture of the optical imaging system, which looks at the rear target surface from a
  angle (as depicted in figure 1(a)). The experimental emissivity remains high after
  because of oblique shock propagation and off-axis shock breakout (in the direction of the collecting lens). Under our experimental conditions, the shock breakout could be clearly detected only for
  due to the relatively low rear-side temperatures at early times, limiting the rear rarefaction wave and plasma expansion into vacuum. We checked, by turning off the radiative effects in the hydro simulations, that the strength and chronometry of the shock propagation did not vary significantly. By contrast, the late-time rebound in the emissivity for
  (solid black curve in figure 1(c)) is relatively weaker, and not so well reproduced by the simulation (dashed black curve).
5. Conclusions
In summary, by means of absolutely calibrated streaked optical pyrometry, we have accurately characterized the isochoric heating of metal foils by fast electrons driven by a  , high-intensity (
 ), high-contrast short-pulse laser. Despite a modest laser driver, our measurements, supported by kinetic transport simulations, indicate that electron temperatures above
  are reached up to
  depths. Rad-hydro simulations show that the steep electron temperature and pressure gradients formed at shallow depths trigger a
  blast wave. Its breakout through the target rear side accounts for the rise in the emissivity observed in the
  thick target. The measured breakout chronometry and strength are consistent with rad-hydro simulations, and therefore provide quantitative—albeit indirect—signatures of the efficiency of REB energy deposition as a function of target depth. Our results stand out from previous works by much reduced laser energy and pulse duration, well-controlled interaction conditions, and a quantitative description of the full range of physical processes leading to blast-wave formation. Finally, our experimental data and numerical simulations highlight the great potential of high-contrast, few-femtosecond laser pulses as compact tools for the study of ultrahigh-pressure hydrodynamics, of fundamental interest to inertial confinement fusion [5], high-energy astrophysical phenomena [3, 51], as well as for the creation of transient (
 ps) warm dense matter states.
Acknowledgments
The authors acknowledge the funding from Conseil Régional d'Aquitaine through project PETRA 2008 13 04 005, and both the French National Agency for Research (ANR) and the competitiveness cluster Alpha—Route des Lasers through project TERRE ANR-2011-BS04-014. This study has been carried out in the frame of the Investments for the future Programme IdEx BordeauxLAPHIA (ANR-10-IDEX-03-02) and of the EUROfusion Consortium, having received funding from the Euratom research and training programme 2014-2018 under grant agreement number 633053. The views and opinions expressed herein do not necessarily reflect those of the European Commission. We thankfully acknowledge IRAMIS for giving access to the UHI100 facility in the context of the LaserLab European project. The PIC simulations were performed using HPC resources at TGCC/CCRT. Alphanov is also gratefully acknowledged for the laser cutting of the multi-layer foil targets.