


Abstract
Understanding the dynamics of expanding biological tissues is essential to a wide range of phenomena in morphogenesis, wound healing and tumor proliferation. Increasing evidence suggests that many of the relevant phenomena originate from complex collective dynamics, inherently nonlinear, of constituent cells that are physically active. Here, we investigate thin disk layers of proliferating, cohesive, monoclonal tumor cells and report the discovery of macroscopic, periodic, soliton-like mechanical waves with which cells are collectively ratcheting, as in the traveling-wave chemotaxis of dictyostelium discodium amoeba cells. The relevant length-scale of the waves is remarkably large (∼1 mm), compared to the thickness of a mono-layer tissue ( ). During the tissue expansion, the waves are found to repeat several times with a quite well defined period of approximately 4 h. Our analyses suggest that the waves are initiated by the leading edge that actively pulls the tissue in the outward direction, while the cells within the bulk tissue do not seem to generate a strong self-propulsion. Subsequently, we demonstrate that a simple mathematical model chain of nonlinear springs that are constantly pulled in the outward direction at the leading edge recapitulates the observed phenomena well. As the areal cell density becomes too high, the tissue expansion stalls and the periodic traveling waves yield to multiple swirling vortices. Cancer cells are known to possess a broad spectrum of migration mechanisms. Yet, our finding has established a new unusual mode of tumor tissue expansion, and it may be equally applicable for many different expanding thin layers of cell tissues.
Export citation and abstract BibTeX RIS

Original content from this work may be used under the terms of the Creative Commons Attribution 3.0 licence. Any further distribution of this work must maintain attribution to the author(s) and the title of the work, journal citation and DOI.
1. Introduction
The motility of a single crawling cell adherent to a substrate is intensely studied and some fundamental aspects of its mechanisms are now well understood [1]. However, in many biological processes such as morphogenesis or tumor expansion each individual cell is surrounded by its neighbors in a continuum sheet, and various cell-to-cell interactions can generate some large-scale collective dynamics [2–6]. Over short distances, in the range of tens of cell diameters, the diffusion of signaling chemicals can be important. But for interaction distances far beyond tens of cell diameters, other mechanisms that counteract the attenuation of the signal often emerge. For example, there is the traveling-wave chemotaxis of dictyostelium discodium amoebae during aggregation [7, 8] and trail formation by crawling microglia [9]. Cell-to-cell interactions can also be mediated by mechanical forces in a closely packed layer of cells and they often result in some long-range spatio-temporal correlations. Some well-known examples are collective cell migration during the gastrulation phase of embryonic development [10], border cells in Drosophila [4], lateral line primordium cells in zebra fish [11], and in vitro systems of advancing epithelial cell sheets [3, 12–14].
The exact dynamic features of proliferating biological tissue would depend on cell-intrinsic factors as well as the types of cell-to-cell interactions. Some important cell-intrinsic factors are the mechanical properties of individual cells which is often nonlinear, the strength of their self-propulsion force, the intracellular frictional force and the rate of cell proliferation which may experience a contact inhibition. Then, the cell-to-cell interaction includes intercellular force transmission mechanisms, various biochemical communications and the friction between neighboring cells, or that between the cell body and substrate. Naturally, for different types of cells and tissues the relative significance of these factors would vary. Consequently, different types of collective phenomena are expected to emerge.
Here, we investigate a thin proliferating disk layer of cohesive, monoclonal SNU-1041 tumor cells as a model system of expanding cell sheet. An initially small disk of SNU-1041 cell layer undergoes three qualitatively different modes of expansion following continuous cell proliferation: sequentially in time (1) laminar expansion, (2) expansion by pulsatile waves, and (3) turbulent swirls. The most surprising phenomenon is the macroscopic, periodic, soliton-like density waves, with which cells are ratcheting in a synchronous manner. Visually, they appear quite similar to dicty amoebae chemotaxing in response to a periodic wave of 3', 5'-cyclic adenosine monophosphate (cAMP) [7]. Although the underlying mechanism is unclear, we find a good evidence that the observed periodic waves are driven by the cells at the leading edge. Subsequently, we demonstrate that a simple mathematical model describing a chain of nonlinear springs that is constantly pulled outwardly at the leading edge recapitulates the observed phenomena well.
2. Collective pulsatile expansion of a tumor sheet
The experiments were conducted with a confluent monolayer of proliferating tumor cells, carefully plated on a petri dish in the form of a disk (diameter 2 mm) as shown in the top first frame of figure 1(a). Within several hours after the initial plating, the cells formed a very confluent cohesive monolayer sheet without any voids. Initially, the cells replicate approximately once every 1.2 d. Then, physical changes of the disk were monitored continuously over a few days using a phase contrast microscope (IX71, Olympus) equipped with a video camera (MFcool, ProGres, Germany). Some snapshot images are shown in figures 1(a), and (b) is a kymograph illustrating the horizontal velocity component vx of local particle image velocimetry (PIV) along the center horizontal axis (yellow line in figure 1(a)). Almost immediately after the disk boundary was set free, the tissue expansion was initiated from the boundary. During the first day or so, the radius of the disk increased almost as a linear function of time, but the outward movement was limited only to the edge area while the core region (radius  0.5 mm) did not show any significant directed motion, as the kymograph of figure 1(b) well illustrates. In other words, the expansion activity was led by the tissue edge. Interestingly, during this early stage of expansion a distorted tissue front became quickly mended and some foled tissue got quickly ironed out (see figure S1).
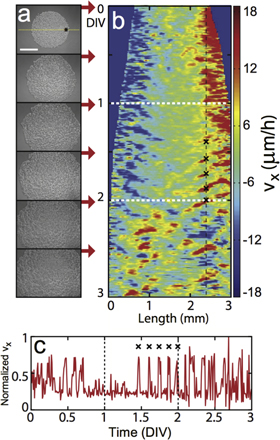
Figure 1. Collective waves and swirls in expanding monoclonal tumor tissue. (a), Phase-contrast snapshot images taken over three days. (scale bar: 1 mm). (b), A kymograph of vx taken over the yellow horizontal line in (a). (c), An exemplary time series of vx taken at the position marked by 'x' in (b) (normalized by the maximum value of 15.86 μm h–1). Three qualitatively different stages (laminar expansion, periodic traveling waves, turbulent swirls) are delineated by two white horizontal (vertical) lines in (b) (in (c)), respectively. During the stage of traveling waves, the mechanical waves emerge near the periphery and move towards the center of the tissue while the tissue area is expanding. The initial cell plating density is 5.0 × 10³ cells mm–2. Velocity fields were computed using open-source PIVlab particle image velocimetry software on the acquired phase-contrast images. The interrogation window was 64 × 64 pixels, and the sampling time interval was 10 minutes. The kymograph of (b) was constructed by averaging over 3 pixels (approximately 7.6 μm) along the vertical direction.
Download figure:
Standard image High-resolution imageFigure 1(c) shows the local time series of vx acquired at the star-marked position in figure 1(a), or equivalently, along the dashed black line marked in figure 1(b). The time series clearly reveals that even during the first day which showed a seemingly continuous expansion, the tissue movement was not at all continuous but intermittent and erratic. Then, as the expanding edge region moved further out, the activity at the marked position slowed down and became steady for quite some period of time (0.7–1.4 d in vitro (DIV)). Subsequently, the expanding tissue generated several rounds of pulsatile waves having a quite well defined period of 3.6 ± 0.2 h, as marked by 'x' symbols in figures 1(b) and (c). The pulsatile waves penetrated deep into the core area towards the center with a well-defined (radial) phase velocity vph = 172.0 ± 16.2 μm h–1 (see figure 1(b) during DIV 1.4–2.2 and movie S1).
The pulsatile waves could be very large in size and globally organized as in the case of figure 2 that shows a single, almost circular wave moving in towards the disk center with a phase velocity vph = 167.6 ± 9.9 μm h–1 and a wavelength λ = 732.3 ± 17.8 μm (see figure 2(a) and movie S2). Again, the waves were initiated periodically from the free edge about a day after the cells were placed. Along with the macroscopic waves, the movement of the individual cells (or the tissue they form) was remarkable: as the circular waves were converging towards the center periodically (see figures 2(b) and 3(d)), the cells were ratcheting radially outward in a stepwise fashion (see figures 2(e) and (f), and movie S3). These mechanical waves accompanied a tissue thickness modulation of  2 μm, which we measured quantitatively using a Mach–Zehnder interferometer [15, 16] (see figure 3). The overall circular symmetry of the wave was not unusual, but more commonly similarly prepared disks of SNU-1041 cells supported fragmented, yet still very large waves, as shown in figure 4. Although the circular symmetry was broken, the wave segments all were more or less moving towards the center (marked by 'x') and this tendency is rather evident in the kymograph taken along the center horizontal line (see figure 4(a)).
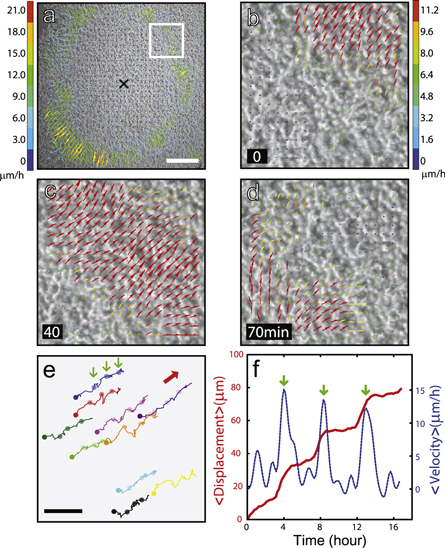
Figure 2. Collective ratcheting movements of tumor cells forming a large circular traveling wave. (a), A snapshot image of instantaneous velocity field v showing a circular wave moving towards the center (marked by 'x'), overlaid on the top of a phase-contrast image. (b)-(d), A sequence of snapshots of v (close-up images of the white boxed area in (a)). (e), Some exemplary traces of cells, sampled from the white boxed area in (a), moving in the opposite direction of the wave. The small colored dots in (e) mark the positions where the instantaneous velocities of the cells reach a local maximum. (f), The average displacement and mean instantaneous velocity versus time. The averages are over the ten sample traces shown in (e). The scale bars in (a) and (e) represents 500 and 100 μm, respectively.
Download figure:
Standard image High-resolution image
Figure 3. Quantitative measurement of tissue thickness variation in space and time. (a), A schematic illustration of a Mach–Zehnder interferometric imaging system. (b)–(e), A sequence of high-magnification two-dimensional thickness profiles (a small square area inside an expanding SNU-1041 cell tissue). (f), The temporal evolution of the local tissue thickness at the marked position (white square) in (b). The area shown in (b)–(e) is approximately 0.5 mm away from the center of the disk. The overall thickness gradually increases over few days and undergoes a rhythmic change (peak positions are marked by blue stars) during the state of pulsatile waves. Snapshot images shown in (b)–(e) are taken from the time zone marked by the green line segment. Note that the tissue thickness varies significantly from one place to another. The phase imaging system is composed of a laser diode (LD, λ = 637 nm), objective lens (OL), beam-spliter (BS), mirror (M), and sCOMS camera. More details on the system and the procedure for obtaining the thickness image from raw phase images can be found in [29].
Download figure:
Standard image High-resolution image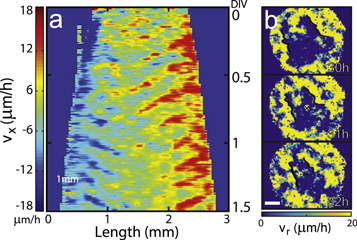
Figure 4. Traveling wave segments in expanding monoclonal tumor tissue. (a), A kymograph of vx taken along a line passing the center of the sample disk (initial diameter 2 mm) of tumor tissue. (b), A sequence of snapshot images of the local wave speed vx showing the time evolution of tumor wave segments. The scale bar represents 500 μm. Initially, a small portion of the left-hand side of the disk was physically folded but soon ironed out as shown in figure S1(b).
Download figure:
Standard image High-resolution image3. Turbulent swirls
As the time went by, beyond the traveling wave stage, the areal expansion almost ground to a halt around DIV 2 (see figure S2a), and then thickened (see figure S2b) tissue with a much higher areal cell density (see figure S2c) started to 'boil' (see movie S4) with multiple swirls as shown in figures 5(a) and (b). The turbulent tissue flow was quantified by the velocity statistics (figure 5(c)) and characterized by the linear scaling between the time-averaged in-plane kinetic energy  and time-averaged in-plane enstrophy
  (figure 5(d)), where the time averages were approximately constant during the 5 h time interval used in the data analysis.
  and
and  , where
  is the vorticity and
  is a spatial average. Although it is noisy, over two orders of magnitude in energy we observe linear scaling between
  .
.  220 μm measures approximately one half of the typical swirl radius. These properties match those of the turbulent swirls in closely packed swimming bacteria very well [17].
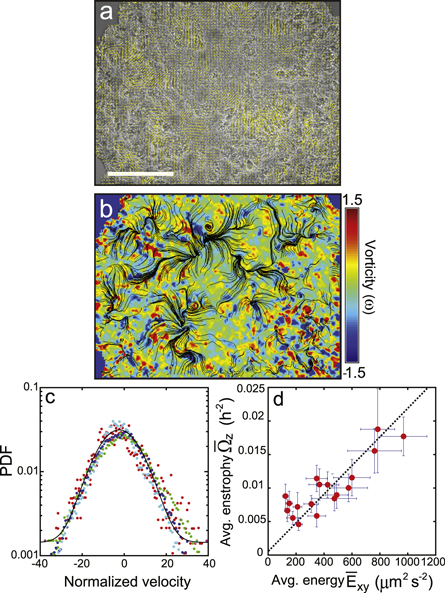
Figure 5. Turbulent swirls in a dense layer of SNU-1041 tumor cells. (a), v flow field overlaid on a dense layer of tumor cells supporting several swirls (at 2 DIV). (b), Normalized vorticity field and streamlines determined from the PIV image data of (a). (c), The probability density function of the instantaneous speed is approximately a Gaussian (four different states taken at a time interval of 12 h, sequentially in time, from red, green, blue, cyan). The velocities are normalized by the mean speed of their corresponding time interval. (d), the average in-plane enstrophy  versus average in-plane kinetic energy
  . Each point in (d) represents a 5 h time window. The error bars represent the standard errors over 5 h time duration. The sliding time window is sampled at every 2.5 h. The analyses are based on a single representative sample.
Download figure:
Standard image High-resolution image4. Differential expression level of N- and E-cadherin expression
The observed sequential development of the SNU-1041 tissue expansion is rather complex and far from being completely understood. But, at least as far as the periodic pulsatile waves are concerned, we have a plausible explanation with some important evidence to support it. First of all, the cells near the tissue boundary were significantly thinner than those in the bulk tissue (see the first two frames of figure S2d). Moreover, the expanding tissue had a nonuniform expression of cadherins, a class of type-I transmembrane proteins (see figure 6): N-cadherins were expressed much more near the free boundary than inside the bulk tissue, while it was the opposite, or the difference was not clear, for E-cadherins. E-cadherins are cell-to-cell adherent junction proteins that are essential for forming mechanically connected tissue [18]. N-cadherins are associated more with cell spreading and focal adhesion kinase [19]. Thus, it seemed plausible that the expanding SNU-1041 tissue had a good attachment to the substrate only near the free edge but not in the bulk area, while the cells in the bulk formed strong cell-to-cell mechanical junctions keeping the whole tissue intact. Indeed, we had several occasions that the cast monolayer tissues 'peeled off' from the substrate and got folded (see figure S1b, for example). Moreover, the SNU-1041 cells were sensitive to the culture substrate: identically deposited SNU-1041 cells on a polyacrylamide gel which was coated with collagen did not produce a uniform monolayer sheet but formed clusters of aggregate cells.
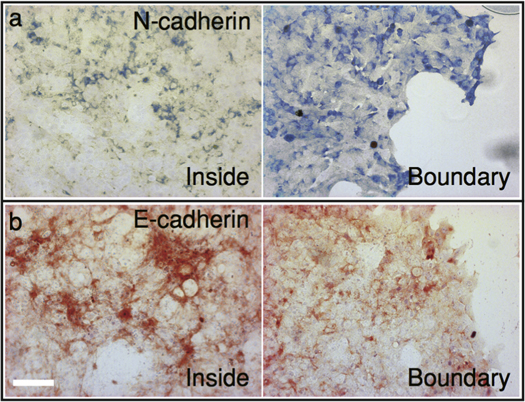
Figure 6. Cell adhesion assay by (E/N-cadherins) immunohistochemistry. The culture samples were fixed and stained with N- and E-cadherin antibodies at 2 DIV after the initial seeding. N-cadherins are expressed much more at the free boundary than deep inside the tissue, while it is the opposite for E-cadherins.
Download figure:
Standard image High-resolution image5. Mathematical model of the pulsatile waves and ratcheting behavior
The experimental results led us to the minimal one-dimensional model chain of cells that was proposed a few years ago by Xavier et al for elucidating the phenomenon of 'x-waves' in expanding tissue of epithelial cells [5]. The model views the monolayer as a chain of springs. A key property of the model is that the elastic constant of the cell k undergoes a non-monotonic evolution, over a time period of  , once the strain reaches a threshold value. This assumption is based on earlier experimental studies reporting that the cytoskeleton of an epithelial cell first reinforces but then softens when the strain gets beyond a critical value. In the original model, each cell junction can generate a self-propelling force Fi and the positions xi of cell-to-cell junctions are also affected by the elastic forces fi and
  of the two cells joined at that junction, and by the viscous friction fv between those two neighboring cells and the substrate. Thus, the force balance at each node xi reads
 , where
  denotes the strain undergone by the spring connecting nodes,
  and xi,
  denotes the velocity of node xi, and η represents a viscosity constant.
We have considered the same x-wave model but under a quite different condition for describing the observed pulsatile SNU-1041 tumor waves. First of all, unlike the cases of the x-wave simulations, we have allowed only the cells at the two open ends of the chain to generate a self-propelling force (that is,  for i = 1 and 40, otherwise 0) and this is in accordance with our finding that N-cadherins are expressed mainly in the cells near the edge and that the tumor tissue seemed not to have a strong attachment to the substrate and be easily peeled off. Then, presumably the strong propelling force at the leading edge can be transmitted through elastic forces to neighboring cells and by frictional forces to the underlying substrate. The simple yet noble model can recapitulate the periodic pulsatile wave propagation towards the middle and the ratcheting behavior of the cells as respectively shown in figures 7(a) and (b): they are strikingly similar to the one-dimensional space-time plot of figure 1(b) and the displacement and velocity curves of figure 2(f).

Figure 7. Periodically expanding one-dimensional chain of nonlinear springs pulled from two ends. (a), A kymograph showing the spatio-temporal evolution of the instantaneous velocity. b the position of a node (x95) and its velocity versus time, as an example. The following parameters are used: F = 1000 nN, k0 = 40 nN, kmax = 120 nN, η = 5 nN min μm–1,  = 10 μm, σ = 0.5, and the natural length of individual spring (i.e., cell) = 10 μm and
  = 2 h.
Download figure:
Standard image High-resolution image
Naturally, the wave properties depend sensitively on a number of different system parameter values. For example, as the minimum value of the spring constant k0 gets increased (mimicking the case of the tissue becoming stiffer with a higher cell density), the pulsatile nature of the expansion weakens or disappears completely (see figure S3). Or, if we allow all the cells to generate the same traction force (e.g. F = 1000 nN) with other parameter values retained as in the figure caption of figure 7, the model chain produces an x-wave as in the paper by Xavier et al [5] (not shown). Although the toy model is seemingly very simple, the nonlinear model can capture some key features of the collective cell movements in expanding cell tissues, whether the expansion is driven by the leader cells at the front edge or by all the cells in the tissue.
6. Materials and methods
6.1. Cell culture and tissue patterning
The SNU-1041 squamous cancer cell lines derived from human pharyngeal cancer were cultured in 5 ml RPMI 1640 (Gibco BRL, Grand Island, New York) mixed with 10% fetal bovine serum (Gibco BRL) in a T-25 flask at a 37  , 5% CO2 incubator. Under no or not so much steric pressure these cells replicate approximately once per every 36 h. After several days of growth in T-25 flask (BD Falcon), the cells were dissociated with 0.25% trypsin-EDTA (Gibco BRL) for 3 min and harvested. The supernatant was collected and centrifuged for 3 min at 1800 rpm, and the cancer cells thus acquired were plated on a 35 ϕ petri-dish (BD Falcon) with an initial seeding density of 5.0 × 10³ cells mm–2 on a defined disk-shaped area having a diameter of 2 mm. The disk area was defined by a guide made of a sheet of polydimethylsiloxane (PDMS), which was later removed carefully once the cells were attached to the substrate and had formed a connected monolayer tissue. After the seeding, the cells were stabilized in an incubator for 4 h, and the culture media was gently replaced to remove dead cells. The petri-dish was filled up with new culture media and covered with a thin PDMS lid in order to prevent the evaporation of media.
6.2. Cell adhesion assay
Cultured cells in a petri-dish were fixed in 4% paraformaldehyde for 1 d at room temperature. After rinsing 2 times with distilled water at least 3 min, the fixed cells were incubated with a blocking solution (2% serum in 0.01 M PBS) at room temperature for 20 min. And cells were washed 3 times with phosphate-buffered saline (PBS) for 5 min. The cells were incubated with primary antibody at room temperature for 90 min at 1:100 dilution in PBS. After rinsing 3 times with PBS for 3 min each, the cells were incubated with secondary antibody at room temperature for 10 min at 1:200 dilution in PBS. After rinsing 3 times with PBS for 3 min each, incubation followed, with streptavidin-HRP(horseradish peroxidase(HRP)-conjugated streptavidin) 10 ng ml–1 in PBS for 10 min. After rinsing 3 times with PBS for 3 min each, the cells were transferred into 3,3'-diaminobenzidine (DAB) substrate solution. The cells were dried with DPX (xylene-based mounting media), overnight.
6.3. Time-lapse imaging and analysis
For long-term live-cell imaging, a small thin cylindrical incubator was designed and lab-built. An insulated heating wire heated the distilled water inside the chamber, and the temperature inside was monitored by a thermometer (PT100, Sanup electronics, South Korea), actively regulated at 37.5 ± 0.1 °C by a temperature controller (SDM9000, Sanup, Korea). Two ITO-coated optical windows along the imaging axis were also electrically heated to prevent water condensation that would otherwise obstruct the imaging. A gas mixture (5% CO2, 95% air) was continuously bubbled in through the water bath.
A sample petri-dish containing a defined SNU-1041 cell tissue was loaded into the incubator, which was then placed on the stage of an inverted microscope (IX71, Olympus) with an objective lens (4×, NA 0.13). Time-lapse phase-contrast images were acquired at every 60 s, typically for 4 days using a cooled charge-coupled device camera (MFcool, ProGres, Germany). The camera had a sensor resolution of 1360 × 1204 pixels with each pixel size being 6.25 μm2.
7. Summary and discussion
In summary, a thin layer of proliferating SNU-1041 tumor tissue exhibited three qualitatively different modes of collective dynamics as the areal cell density and tissue thickness increased. The sequential development was repeatedly observed with every similarly prepared samples ( ). Most notably, we observed an unusual mode of tissue expansion mediated by a periodic sequence of pulsatile waves to which cells were ratcheting out collectively. The observed waves share a similarity with the ratchet-like tissue movement during dorsal closure in the developing Drosophila embryo, in which a tension-based dynamics and cell-to-cell coupling control the force pulses [23]. Also, the observed phenomenon is remarkably similar to the collective ratcheting movements of dicty cells responding to cAMP waves that are self-organized by the dicty populations. Thus, one possibility is that the cells at the leading edge act as a pacemaker triggering a traveling chemical wave in a periodic manner, then the waves move towards the center and the SNU-1041 tumor cells chemotaxis in response to the chemical waves similar to chemotaxing dicty cells. However, so far there is no experimental evidence to support this hypothesis. We also note that an earlier study by Vedula et al [27] reported a similar pulsatile tissue movement in very thin and narrow strip of epithelial cell layer. However, their observation was made possible at much smaller length scale and only with a narrow (few cells width) geometrical constraint, which is in a good contrast with the freely expanding SNU-1041 tissue under no physical constraint.
For the SNU-1041 cells, what exactly accounted for their ratcheting motility is far from being understood clearly for the moment. Two most widely discussed mechanisms for monolayer tissue expansion are that each cell in the tissue is self-propelled [14], or that force generation is restricted only to the few leading cell rows near the expanding front [11, 28]. The later seemed to be more relevant for the SNU-1041 cell layer, since the tissue expansion started from the boundary and N-cadherins were expressed predominantly near the leading front. This is in contrast with the waves of chemotaxing dicty and the x-waves of epithelial cells, for which all individual cells produce their own propulsion. On the other hand, leading (or guiding) tumor cells actively pulling the cells behind is not unusual for invading tumor tissue. Second, the spring constant of the SNU-1041 cell was assumed to evolve non-monotonically upon reaching a critical strain level. This assumed 'threshold kinetics' is very similar to the excitable cAMP kinetics of dicty cells. In fact, there have been many studies on chemical (e.g., calcium) signaling in association with mechanical signal transduction [8, 20].
We found that the initial cell doubling time lengthens significantly as the cells feel more compressive stress with the increasing tissue size and this effect is evident even for a small tissue composed of less than 100 cells (see figures S4(a)–(d)). We also found that the SNU-1041 cells within the tissue move quite randomly similar to a Brownian particle, yet, with a directional persistence (see figures S4(e) and (f)). The diffusiveness of the cells may explain the phenomenon that a distorted tissue front (as in figure S1) becomes quickly mended within a day or so: according to an estimate based on the graph of figure S4f the diffusion coefficient Dc of the cells for the time domain around  is 2.4
  (see the figure caption of figure S4 for detail); then, with this value of Dc the cell population would cover approximately 155 520
  during 18 h, which is around the size of the recovered tissue area during the same duration of time for the example shown in figure S4a. But, as for the underlying mechanism of the recovery process we cannot just attribute to the diffusion of the cells. During the same duration of time, the cells replicate and the overall tissue thickness increases.
A significantly jammed tissue eventually became multi-layered. At that point in time, the role of the leading edge disappeared. This could be a mere consequence that the thickened tissue was too much of a burden for the leading edge to pull along or that the role of leader cells itself had changed. The thickened system then started to produce wandering large swirls. Swirling collective cell movements have been reported in several different biological systems, including high density populations of swimming bacteria [17, 24, 25] as well as proliferating eukaryotic cell systems [21, 26]. Interestingly, in many ways the swirl dynamics in the SNU-1041 tissues was qualitatively not too different from that which was observed in a dense bacterial cell population.
In earlier studies investigating collective cell migrations, epithelial cells or amoebae has been mainly used. Definitely, SNU-1041 tumor cells support a rich repertory of collective dynamics, establishing a good new example to be explored. The proliferating thin tissue of SNU-1041 cells behaves much like an expanding sheet of epithelial cells, but shows some clear differences. For example, in a culture dish the replication cycle of (e.g. MDCK) epithelial cells is approximately 0.75 d, which is about half of that of SNU-1041 cells. Also, a sheet of epithelial cells expands at the speed of ∼1 μm min–1, which is 3–4 times faster than that of SNU-1041 tumor cells, and this difference seems to originate from the fact that all epithelial cells are self-propelled [5, 14] while the majority of SNU-1041 cells are not. Consequently, an expanding epithelial cell tissue is able to maintain its single-cell thickness, while the initial single-layer SNU-1041 tissue eventually becomes multi-layered. Besides, the tumor tissue appears much more inhomogeneous than cultured epithelial cell tissue: Its spatial thickness variation is quite significant (see figure 3) compared to the level of thickness modulation ( 2 μm) accompanying each pulsatile wave.
There are several exciting open questions yet to be addressed. How common are the observed pulsatile waves in expanding tissues in general? How are the biochemical signals that orchestrate the collective migration generated? Is the propagation of the waves mediated purely by a physical coupling? How does the coupling signal modify the physical property of the cells? Do SNU-1041 cells actually support the reinforcement and fluidization assumption employed for the model simulation? Can we measure the traction force generated by the SNU-1041 cells directly (perphaps, using a soft micro-pillar array substrate method as in [27]) to further consolidate our 'leader cells pulling the tissue behind' assumption? Answering such questions would be of interest not only for basic science but also for clinical cancer treatment research.
Acknowledgments
This research was supported by the Ministry of Science, ICT & Future Planning (MSIP), of Korea (NRF grant No. 2012R1A2A1A01008021) and by Korea University Future Research Grant. We thank R Goldstein and H Zhang for useful comments.