


Abstract
We report on the experimental observation of the attraction of a beam of ultrarelativistic electrons towards a column of neutral plasma. In experiments performed at the FACET test facility at SLAC we observe that an electron beam moving parallel to a neutral plasma column, at an initial distance of many plasma column radii, is attracted into the column. Once the beam enters the plasma it drives a plasma wake similar to that of an electron beam entering the plasma column head-on. A simple analytical model is developed in order to capture the essential physics of the attractive force. The attraction is further studied by 3D particle-in-cell numerical simulations. The results are an important step towards better understanding of particle beam–plasma interactions in general and plasma wakefield accelerator technology in particular.
Export citation and abstract BibTeX RIS
1. Introduction
Long-range attraction of an ultrarelativistic electron beam, propagating many column radii away from but parallel to a neutral plasma column, was experimentally observed during plasma wakefield acceleration (PWFA) experiments conducted at the FACET test facility at SLAC [1]. In short, the electron beam was found to be attracted towards the plasma, eventually entering the plasma column in which it was then guided. These experiments were part of an ongoing program on the development of beam-driven plasma wakefield accelerators [2, 3]. In PWFA charged particle beams, with particle densities typically ranging from 1014 to  , drive strong wakes in plasmas of the same density ranges [4, 5]. Trailing particles injected into the formed plasma wake may be accelerated by longitudinal fields of many GV m−1, much stronger than what is possible with conventional particle accelerators [6, 7]. A complete understanding of the beam–plasma interactions in PWFA experiments is vital in order to develop this technology sufficiently so that it can be an alternative to conventional accelerators. We here document an unexpected observation at FACET of a long-range attraction between an ultrarelativistic electron beam and a column of neutral plasma. In the experiments the plasma is formed by ionizing a narrow column of hydrogen gas using a high power laser [8], generating a narrow column of neutral plasma. A 20 GeV, 3 nC electron beam initially traveling parallel to the column, at a distance
  , larger than the plasma radius,
  and larger than the bunch length,
  , is almost completely pulled into the plasma and furthermore guided and decelerated inside the plasma. We quantify the attraction by analytical calculations, numerical simulations and experimental results. Figure 1 shows the salient features of the attraction; the almost normal field of the ultrarelativistic electron beam sets up a charge separation in the neutral plasma column, co-propagating with the beam. The resulting attractive force pulls a gradually increasing fraction of the beam into the plasma.
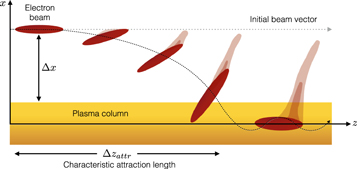
Figure 1. Principle of the long-range attraction: an electron beam initially traveling parallel to a column of neutral plasma may be almost completely attracted into the plasma and furthermore guided and decelerated inside the plasma. The beam–plasma interaction of the attracted beam may be similar to that of a beam having entering the plasma centered on the plasma column. The figure illustrates the same electron beam, at different points in time. The diffuse contours illustrate that a small part of the front of the beam will remain unperturbed by the plasma.
Download figure:
Standard image High-resolution imageEarlier work has shown experimentally [9] and in simulation [10] that a charged particle beam entering a plasma channel at an angle may be guided by and confined in the channel. The combination of attraction and guiding implies that the beam–plasma interaction of a beam initially outside the plasma may be similar to that of a beam entering the plasma centered on the column ('head-on'). Another recent work [11] has shown by simulation how an electron beam may undergo wiggle motion due to the fields originating when gas jets are heated by an intense laser beam. In [11] the charge separation in the gas jets is due to direct heating of the gas electrons by an intense laser beam (laser intensity above 1020 W cm−2). In contrast, in the experiment discussed in this paper the force that onsets the electron beam–plasma attraction originates from the electron beam itself.
The documentation of the long-range attraction provides an important step towards better understanding of the interaction between charged particle beams and plasmas. The results presented may be of importance for design of future PWFA experiments and applications. For example, injection of a charged particle beam into plasma columns formed by ionizing lasers, as required in on-going plasma experiments [12, 13], may prove less challenging by exploiting the attraction force described in the paper. Furthermore, the realization of plasma-based dumps for charged particle beams, a topic of recent interest [14, 15], may be simplified since the results indicate that only narrow columns of a ionized gas may be needed in order to make effective beam dumps.
2. Model and simulations
The long-range attraction can be understood as follows: the transverse electric field of electron beam sets up a charge imbalance on the plasma surface by repelling the plasma electrons. The field from the charged plasma then acts back on the beam, whenever the plasma field has had time to catch up to the beam. When the beam is ultrarelativistic, the field from the beam is Lorentz contracted, largely orthogonal to the beam motion and propagating instantaneously with the beam [16]. The beam field affecting the plasma column therefore decays as 1/r where r is distance from the beam to the plasma, rather than  for non-relativistic beams [16]. It is this
  dependence that makes the attraction effective. In order to examine the physics of the attraction in more detail, we start by developing a simple analytical model, ignoring the dynamics of the plasma.
2.1. Analytical model
We assume a long cylindrical column of neutral plasma, with radius rp and neutral density n0, uniform along z. The plasma is cold, and the plasma electrons are initially stationary in the laboratory frame. We assume that the ions are uniformly distributed in the plasma and that they do not move on the time scale of interest. We ignore radiative effects from the beam electrons and the plasma electrons. The electron beam is described in an instantaneous frame following the beam along the coordinate z, the 'co-moving frame'. Figure 2(a) shows the initial conditions of the beam propagating parallel to the plasma cylinder. The beam is ultrarelativistic, with electron energy  , where γ is the relativistic Lorentz factor, me is the electron mass and c the speed of light. The beam moves close to the speed of light (
 ) along z. It has a total charge Qb, a characteristic length in the laboratory frame of
  , and is initially located a distance
  from the edge of the plasma. The quantities used in the model are depicted in figures 2(a) and (b). For a beam moving at the speed of light there will be no electromagnetic field in front of the beam. Trailing the beam, stationary in the co-moving frame, a 'wake' will be formed in the plasma. In accelerator physics, the interaction of ultrarelativistic charged particle beams with their environment, calculated in the co-moving frame, is often described in terms of wake functions [17, 18]. Here, we opt to develop the physical mechanism for the attraction using basic, well known, physical principles, starting from Gauss' law. Using Gauss' law, assuming field lines orthogonal to the direction of motion, the field from the beam at the plasma surface is calculated to
Figure 2(a) shows the Gaussian surface used for the calculation. The beam field repels the plasma electrons thus exposing the ions and sets up a plasma surface charge density, σ, with field  . This field shields the beam field from entering the plasma, implying
  . We assume that the beam is far away from the plasma so that the beam fields lines are mostly parallel (
 ). The projected plasma surface area exposed by the beam is then a rectangle of sides 2rp by
  , giving a total exposed charge of

The surface charge exposed in our model is independent of the plasma density, n0, since we have assumed that the surface charge is set up fast with respect to the time it takes for the beam to pass, ignoring the plasma dynamics. How deep into the plasma the beam field may penetrate is limited by the plasma skin depth,  , where
  is the plasma electron frequency. For the model to have validity, the calculated depth of the exposed charge, d, should be less than the plasma skin depth. We express this criterion in experimental parameters by first noting from the inset in figure 2(a) that the volume of the exposed charge is
  . Using
  and inserting equation (1) we get as criterion for the model validity

In addition, for the geometrical considerations of the model to hold, d must be smaller than rp. For parameter sets violating equation (2) the dynamics of the plasma electrons, not taken into account in our model, may resemble that of the so-called nonlinear blow-out regime of PWFA [19].

Figure 2. The ingredients of the analytical model. (a) As the beam travels along the plasma, the field from the beam sets up a charge separation in the plasma column. The inset indicates the volume of the charge exposed by the beam field. (b) The field from the plasma charge acts back on the beam, once it has caught up to the tail of beam. The transverse component of the plasma field accelerates the beam towards the plasma.
Download figure:
Standard image High-resolution imageThe field from the exposed plasma charge propagates with the speed of light, potentially catching up with the back of the beam, see figure 2(b). By causality, the field from exposed plasma charge cannot act back on the same part of the beam that exposed that charge, only the trailing parts of the beam. To estimate the scale of the attraction, we calculate the catch-up distance [17], L, for charge trailing at a characteristic distance  behind the exposed charge. Trigonometric considerations following figure 2(b) give
  . We consider cases where
  , yielding

We assume further that the beam and the plasma are spaced far apart (the catch-up distance is long) and do the approximation that the total field from the plasma acts back on the beam, once it has caught up. The field from the plasma on the beam is then given by

The beam is now attracted in the direction of the plasma by the transverse component of the field,

Substituting equations (1)–(4) into (5) yields the following expression for the transverse field acting on the beam,

As characteristic time scale for the attraction, we calculate the time it takes for the electron beam to be attracted into the plasma. The electron beam dynamics is given by Newton's second law,

where we have assumed that the beam motion remains mostly in the z-direction, implying  By this assumption, we also ignore the longitudinal plasma field component, as it results in a weak beam deceleration, negligible for an ultrarelativistic beam. Coming equations (6) and (7), the motion can then be described by the differential equation

with

Setting boundary conditions  (initially parallel propagation) and
  (initial offset), we solve for the time
  it takes the beam to enter the plasma,
  . The numerical solution to equation (8) is
By substituting for the beam particle energy  , the distance of propagation before the beam hits the plasma,
  , can be written simply as

In the following section we compare the predictions of equation (9) with 3D particle-in-cell (PIC) simulations for the experimental parameters, and we shall see that the correspondence is reasonably good. One should be careful applying the apparent scalings in equation (9) to other parameter domains, without further physical arguments or supporting numerical simulations. For example, for the electron energies investigated here (≲20 GeV) and with the assumption  , we calculate radiative effects to be small. For larger electron energies, or larger beam offsets, this may not be the case anymore.
It is worth noting that positively charged beams (positron-, proton- and ion beams) will interact with a neutral plasma as well. Instead of pushing electrons into the plasma (exposing positive ions), positively charged beams will attract plasma electrons (exposing a similar amount of negative charge). There exists therefore a long-range attraction for positively charged particles as well, and the main model assumptions leading to equation (9) would apply.
2.2. Numerical simulations
We use the quasi-static 3D PIC code QuickPIC [20, 21] to do a numerical study of the long-range attraction, for parameters similar to those of the experiment presented in the next section. In contrast to the analytical model, the PIC simulations take into account the dynamics of the plasma electrons, and assume a realistic beam charge distribution, with finite beam sizes and a variable line charge density. In the simulations, plasma ions are immobile and radiative effects are not included. We simulate a 20 GeV, 3 nC electron beam initially traveling along z, parallel to a column of neutral plasma, with a radius of  μm and a plasma density of n0 =
  . The beam length is 40 μm rms. The transverse radius is 15 μm rms, in both planes. The charge distribution is Gaussian (symmetric) in all three-dimensions. The beam normalized rms emittances are 100 μm in the horizontal plane and 10 μm in the vertical plane. We study beam offsets in the horizontal plane. The initial distance to the center of the plasma is
  μm. The simulation box has a size of 621 μm × 621 μm × 222 μm in the two transverse dimensions and the longitudinal dimension, respectively. The box moves at the speed of light, following the beam. The number of the cells for the simulation box is 512 × 512 × 256.
Figure 3(a) shows the initial time step of the simulation. The co-moving coordinate  is the relative position along the simulation box, at any given instant in time. The beam travels towards the right. As explained in the previous section, the field originating from beam electrons at a given z-position acts on the surface plasma electrons parallel to the beam. The plasma electrons experience a repulsive force. As more and more slices of the beam pass the same z-location in the stationary plasma, the plasma electrons at the surface move towards the axis while the field from the beam propagates further into the plasma, laying bare an ion layer that has a thickness of about 5 μm. The attractive force from the ions on the plasma electrons counteracts the repulsive force from the beam electrons, and this may eventually pull back the plasma electrons. In this simulation, this pull-back of the plasma electrons is observed after most of the bunch has passed. As the electron beam propagates along z, it will continuously set up the charge separation in the plasma. As long as the electron beam does not evolve significantly, the plasma perturbation generated is static in the co-moving frame, and acts back on the beam, as explained in the previous section. In figure 3(b) the electron beam has propagated 10 cm along the plasma column. The plasma has now pulled the trailing part of the beam towards it. The transverse momentum of the beam increases towards the beam tail, as expected, since more of the plasma field has had time to catch up to the tail parts of the beam. In figure 3(c), after 15 cm of propagation, some beam charge has been attracted into the plasma. At first the particles towards the tail of the bunch reach the plasma, while particles further ahead will eventually reach the plasma as well, as long as there is charge separation generated in upstream plasma. In figure 3(d), after 30 cm of propagation, half the electron charge has been attracted into the plasma column. Once inside the plasma, the beam electrons are guided and decelerated by the plasma, as discussed in [9, 10].

Figure 3. QuickPIC simulation: a 20 GeV, 3 nC electron beam is initially propagating parallel to a column of neutral plasma with density  . The beam travels towards the right. The plot shows the density of beam- and plasma-electrons. (a) The first time step of the simulation: the beam field has created a perturbation in the plasma electron density. (b) 10 cm of propagation: the field from the plasma has attracted the back part of the beam towards the plasma column. (c) 15 cm of propagation: the back part of the beam has entered the plasma. (d) 30 cm of propagation: half of the electron beam charge has entered the plasma. The electrons are guided by the plasma once attracted into it, resulting in a strong beam–plasma interaction.
Download figure:
Standard image High-resolution imageWe now compare the beam–plasma interaction of a beam almost completely attracted into the plasma, to the beam–plasma interaction of a beam having entered the plasma column centered on the plasma column, head-on. We quantify the beam–plasma interaction by the decelerating field set-up in the plasma. The strength of the decelerating field sets the time scale for when a beam is completely decelerated and stopped. It also gives the order of the field in the plasma usable for accelerating electrons, and thus the usability of the wake for PWFA applications [4, 7]. Figure 4 shows the longitudinal field for an electron beam having entered the plasma head-on, compared to the field of the beam initially offset by 6rp from figure 3. Both beams have propagated 50 cm. Ninety percent of the offset beam has been attracted into the plasma at this point. The decelerating field inside the beam for the two cases is very similar, around 10 GV m−1. The beam–plasma interaction of the attracted beam resembles that of the head-on beam. If the time scale for the beam attraction is much smaller than the time scale for beam propagation (given by energy of the electron beam, or the length of the plasma column), the energy spectrum of the attracted beam after the plasma may be similar to the spectrum of a head-on beam. We later use this phenomenon to compare theory and simulation to experiment. For this purpose figure 5 shows the energy spectra for beams with initial position from zero to 7.5rp, after having propagated 50 cm along z. Beams initially up to three plasma radii (90 μm) outside the center of the plasma observe a similar amount of deceleration. Beams as far out 7.5 plasma radii are still being significantly decelerated, although a larger part of the beam is in this case unaffected by the plasma, as expected.
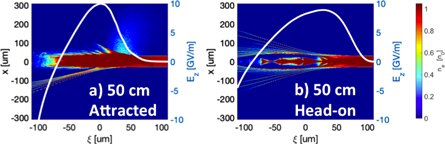
Figure 4. QuickPIC simulation: the white lines show the on-axis longitudinal electric field in a plasma for an attracted electron beam versus a head-on electron beam, after 50 cm of propagation. (a) The longitudinal field profile at x = 0 for a beam being attracted in the plasma from a transverse distance of 6 plasma radii. (b) The longitudinal field profile at x = 0 for a beam entering head-on to the plasma column. While the exact shape of the field is different for the two cases, the peak magnitude of the field is very similar, about 10 GV m−1.
Download figure:
Standard image High-resolution image
Figure 5. QuickPIC simulation: energy spectrum of the electron beam after 50 cm of total propagation, as function of initial transverse distance between the electron beam and the plasma column. Other parameters are the same as for the simulation discussed in figure 3. (a) For each initial simulated offset the electron beam charge density as function of energy is plotted. For a beam entering the plasma head-on, most of the charge has been decelerated by about 4 GeV in 50 cm. As the initial offset increases the electron beam has to propagate longer before is is attracted into the column. Once most of the charge is inside the column, the beam is strongly decelerated. The black dotted line shows the peak deceleration predicted by the model, assuming the beam enters the plasma after a propagation distance given by equation (9), and assuming a decelerating field of 10 GV m−1 inside the plasma.
Download figure:
Standard image High-resolution imageDue to the transverse forces from the plasma on the beam, the beam transverse momentum, px, increases as it approaches the plasma. This distorts the transverse phase space of the beam in the plasma because different slices of the beam along z enter the plasma column at different points in time. The emittance of the electron beam, defined as the area of transverse phase space, spanned by x and  where p0 is the beam total momentum, is therefore larger for a beam attracted into the plasma than for a beam entering the plasma head-on. For the simulated beams discussed in figure 4, a beam attracted into the plasma has an emittance about six times larger than a head-on beam. Thus, even though the magnitude of the plasma field may be similar for an attracted beam as for a head-on beam, the emittance is expected to be larger for the attracted beam. In neither the experiment nor the simulations we observe evidence that transverse beam–plasma offsets seed the hosing instability [22]. The attraction leads to a distorted, incoherent transverse phase space, which in turn may mitigate the growth of the instability. As result, once charge has been fully attracted into the plasma column, it appears to propagate and decelerate stably.
2.3. Comparison between the analytical model and numerical simulations
We compare the analytical predictions of equation (9) to the distance it takes in simulation for at least half of the electron beam to be attracted into the plasma column. For the parameters used for the simulation shown in figure 3, the analytical estimate from equation (9) is  cm. For these parameters the assumptions taken when developing the model hold:
  . In the simulation half of the charge has entered the plasma after propagating a distance of
  cm. Thus, the model agrees in this case reasonably well with the simulation results. Furthermore, we have used equation (9) to calculate the predicted peak beam deceleration using the model, assuming 50 cm of total propagation and a peak deceleration of 10 GV m−1 once the beam has entered the plasma. For the same example, a maximum energy loss of (50–28 cm) * 10 GV m−1 = 2.2 GeV is predicted for an initial transverse offset
  of 180 μm. The model predictions are shown in the black dotted line in figure 5, overlaying the results of the numerical simulations. The results in figure 5 will in the following section be compared to experimental results.
3. Experiment
3.1. Experimental set-up
Figure 6(a) depicts the experimental setup. A Ti:Sapphire laser [23] is used to ionize hydrogen gas [8]. The gas pressure for the experimental results presented is 1.3 Torr, corresponding to a plasma electron density of 8.6 × 1016 cm−3 for a fully ionized plasma. The laser pulse, with an energy estimated to 260 mJ, is compressed before propagating through a CaF2 window. Upstream of the hydrogen chamber the laser is focused by an axicon optic [25] and reflected via a gold mirror into the chamber. The axicon has an angle of  and creates a line focus with a
  Bessel transverse profile, as illustrated in figures 6(b) and (c). The central lobe of the laser contains an order of magnitude higher intensity than the outer rings (the
  has an intensity ratio of the central lobe to the first ring of 6.3). The exact length of the plasma column formed cannot be calculated precisely since the laser propagation is affected by the plasma. From observations of plasma light from the chamber viewports, spaced by 0.5 m, the plasma length is estimated to order of one meter. The corresponding estimate of the intensity in the central lobe is a few 1014 W cm−2. The hydrogen gas has an ionization threshold of 1 × 10¹⁴ W cm−2, calculated assuming tunnel ionization [24]. At 1.3 Torr gas pressure, the laser is estimated to ionize a column of neutral plasma in the gas with radius of about 40
  . The horizontal and the vertical positions of the axicon can be adjusted. By adjusting axicon position, the center of the laser beam moves by the same amount as the axicon motion. The gold mirror can be tilted in order to vary the angle of the laser beam.
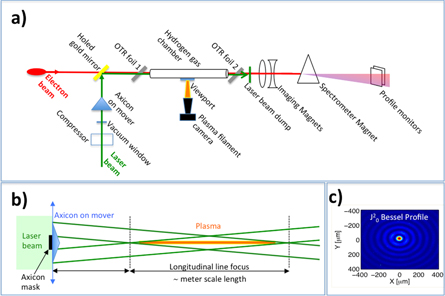
Figure 6. (a) Experimental setup. A Ti:Sapphire TW laser, focused using an axicon optic, is sent into a chamber that can be filled with H2 gas at different pressures. The axicon creates a line focus, with a  Bessel transverse profile inside the chamber. A plasma column is formed in the central lobe of the Bessel. The width of the plasma column formed is estimated to be 40 μm. A 20 GeV, 3 nC electron beam is initially aligned to the laser beam using optical transition radiation (OTR) foils on each side of hydrogen chamber. The axicon can be moved horizontally and vertically on the scale of mm, shifting the alignment of the plasma column with respect to the electron beam. The electron beam spectrum, as function of axicon position, is measured on a spectrometer downstream of the plasma. A camera is recording optical light from a viewport installed on the chamber wall. (b) The axicon optics is installed on horizontal and vertical movers, allowing the plasma column to be offset with respect to the electron beam. (c) A measurement of the laser profile, showing the
  Bessel profile.
Download figure:
Standard image High-resolution imageA 20 GeV, 3 nC electron beam, longitudinally compressed to a length varying between 20 and 40 μm, is sent through the hydrogen chamber, roughly 100 ps after the arrival of laser pulse. The gold mirror has a 2 mm radius hole in order to let the electron beam pass through unaffected. At 1.3 Torr pressure there is no measurable interaction between the hydrogen gas and the beam when the laser is not firing. Two titanium optical transition radiation (OTR) foils, positioned 1.9 m apart along z, are used to initially align the electron beam and the laser beam. Both the OTR light generated from the beam passing through the Ti foil, as well as the direct reflection of the laser Bessel beam, is recorded by the same camera, allowing for an initial electron/laser alignment, with a precision of a few tens of micrometers on each screen. This translates to an alignment angle precision of a few tens of micro-radians. The axicon motion is used to vary the relative position of the laser (and thus the plasma column) with respect to the electron beam. The position jitter of the electron beam as measured at a beam position monitor just upstream of the plasma was less than 10 μm. The position jitter of the laser beam as measured on the downstream OTR screen was about 30 μm. The axicon is moved in position step sizes of 100 μm. The combined electron beam and laser beam jitter is therefore small with respect to the axicon position step size, nevertheless leading to some shot-to-shot variation at each axicon position, as shown in the experimental results in figure 7. After being dispersed vertically by a strong dipole field the electron beam energy spectrum is measured on profile monitors, with an energy resolution better than 100 MeV [26]. Light originating from the plasma formation is measured using viewports on the hydrogen chambers. The amount of light is correlated with the strength of the beam–plasma interaction.

Figure 7. The experimental results of moving the laser transversely but parallel to the electron bunch, by horizontally scanning the axicon optics over a distance ±800 μm from the position where the laser beam spatially overlaps the electron beam. The electron beam position is fixed during the scan. Ten experimental shots are recorded for each position. (a) Single images from the scan, as recorded with the spectrometer. At extreme axicon positions, the beam spectrum is consistent with spectra measured when the laser is not firing. At intermediate axicon positions parts of the beam has received a kick transversally, in the direction of the plasma. When the laser beam is a few 100 μm misaligned with respect to the electron beam, significant deceleration is observed. (b) Summary of all experimental shots, projected on the spectrometer energy axis. Each vertical line in the plot corresponds to an experimental shot. Figure (b) should be compared to the numerical predictions in figure 5. (c) Summary of all experimental shots, projected on the spectrometer x-axis. Each vertical line in the plot corresponds to an experimental shot. The black dotted line indicates the predicted location on the spectrometer, of charge offset by the axicon position at the exit of the plasma source.
Download figure:
Standard image High-resolution imageThe attraction of the electron beam to the plasma column is measured by scanning the axicon position, recording the beam energy spectrum as well as the amount of light measured in the hydrogen chamber, for each position. After spatial alignment of the laser beam with respect to the electron beam, the beam enters the column of neutral plasma head-on. From this position, the axicon position was adjusted in steps of 100 μm, up to ±800 μm. The extreme values were chosen to correspond to axicon positions where no measurable effects beam–plasma interaction was observed. About ten experimental shots were recorded per axicon position.
3.2. Results
We summarize the results of the axicon position scan in figure 7. Figure 7(a) shows a single, typical shot for each of the axicon positions. If the beam enters the ionized plasma column head-on, corresponding to an axicon position of zero, we observe a deceleration of the beam of several GeV, consistent with the PIC simulation results presented in the last section. The spectrum is horizontally pinched at around 16.3 GeV because the spectrometer imaging magnets, shown in figure 6, was set to focus charge at this energy. At extreme axicon positions, ±700–800 μm, the beam spectrum as measured at the spectrometer profile monitors shows no sign of interaction. I.e. no effect of the laser on the beam spectrum is observed. Closer to the center, at axicon positions ±300–600 μm parts of the beam has received a transverse kick, in the direction of the plasma, while no or little deceleration is observed. This is consistent with the model and the numerical simulations; the beam has been attracted towards the plasma, but the plasma has ended before the beam reaches it. At axicon positions ±100–200 μm, deceleration of at least 2 GeV is observed. Figure 7(b) summarizes all shots by their energy spectra, projected onto the energy axis, as function of axicon position. Each vertical line in the plot corresponds to an experimental shot. The plot confirms that the deceleration increases towards the middle of the scan. Figure 7(c) shows the spectra for all shots projected onto the horizontal axis, illustrating net transverse offsets of the beam centroids on the spectrometer. The transverse offsets may be interpreted either as charge attracted into the plasma from its original transverse position, or charge having experienced a transverse kick towards the plasma. The imaging magnets magnifies a beam offset at the exit of the plasma source by a factor of about 5.5 at the location of the spectrometer monitor. If any charge has been transversally offset from the nominal beam position after propagating through the plasma source (for example due to attraction into the plasma column), it would also appear offset with respect to the nominal beam position at the spectrometer. The skewed black dotted line drawn on top of figure 7(c) shows a prediction of where charge, with a transverse offset equal to the beam–plasma offset, would appear on the spectrometer. We observe a reasonable agreement between the slope of the dotted line and the measured offset of transversally displaced charge.
To quantify the full transverse zone where the electron beam has been affected by the plasma column, we calculate the amount of charge unaffected by the beam–plasma interaction as well as the amount of light emitted from the plasma. Figure 8(a), black curve, shows the electron beam unaffected charge, calculated as the total charge remaining in the rectangular box displayed in the leftmost panel in figure 7(a), compared to the total charge in the same box when there is no beam–plasma interaction. Figure (b), black curve, shows the amount of light measured from at viewport on the hydrogen chamber, normalized to the measured light when there is no beam–plasma interaction. Both metrics show significant electron beam–plasma interaction when the beam enters the column of neutral plasma at a transverse distance of up to 500 μm. This is more than ten times the estimated radius of the plasma column. The experiment was repeated for the vertical axis. The results are shown in the red curves of figure 8. We note that the size of the measured attraction zone is similar in the two planes, as expected.

Figure 8. Measurements of the transverse zone where the electron beam has been affected by the column of neutral plasma. The horizontal data, in black, is the same data set as presented in figure 7. In addition, data from a vertical axicon scan is presented in red. (a) The amount of charge not affected by beam–plasma interaction, compared to measurements of the electron spectrum when there is no beam–plasma interaction (green line). (b) The amount of light originating from the beam–plasma interaction, compared to the camera count with the laser off (green line). Both measurements, in both planes, demonstrate that the electron beam interacts significantly with the initially neutral plasma for up to 500 μm initial offsets from the plasma column. This distance is more than ten times the estimated radius of the plasma column.
Download figure:
Standard image High-resolution image
We compare the experimental results to the numerical results discussed in the previous section. Figure 5 shows the deceleration as function of the beam–plasma distance, as calculated by simulations and predicted by the analytical model. The beam and plasma parameter used for this figure were chosen to represent the experiment for which results are shown in figure 7(b). The region where the beam is decelerated and the amount of deceleration corresponds reasonably well. For both the measurements and the numerical results deceleration of several GeV occurs when the beam–plasma distance about ±50 μm, while significant deceleration is observed up to ±250 μm.
4. Conclusions
We have observed experimentally that an ultrarelativistic electron beam initially traveling parallel to a neutral plasma, is attracted into the plasma from distances of several plasma column radii. The energy spectra of beams attracted into the plasma may be similar to that of a beam entering the plasma head-on. An analytical model has been developed to elucidate the physics of the attraction. Numerical 3D PIC simulations have been performed to further confirm and quantify the effect, and show good agreement with experimental results. The documentation of this long-range attraction furthers the understanding of interactions between charged particle beams and neutral plasmas and is of particular interest to the growing field of PWFA research and applications. In particular, the long-range attraction described can be viewed as a mechanism where transverse beam quality is traded off against need for precise beam–plasma alignment or a wide plasma column. Thus, the mechanism could be interesting to consider in applications where beam quality is not the key parameter, one example being plasma-based beam dumps.
Acknowledgments
We acknowledge the helpful cooperation of the FACET test-facility operational crew. This work is supported by the Research Council of Norway and the US Department of Energy under contract number DE-AC02-76SF00515. Open access costs are fully covered by the University of Oslo's publishing fund.