


Abstract
A topic of intense current investigation pursues the question of how the highly crowded environment of biological cells affects the dynamic properties of passively diffusing particles. Motivated by recent experiments we report results of extensive simulations of the motion of a finite sized tracer particle in a heterogeneously crowded environment made up of quenched distributions of monodisperse crowders of varying sizes in finite circular two-dimensional domains. For given spatial distributions of monodisperse crowders we demonstrate how anomalous diffusion with strongly non-Gaussian features arises in this model system. We investigate both biologically relevant situations of particles released either at the surface of an inner domain or at the outer boundary, exhibiting distinctly different features of the observed anomalous diffusion for heterogeneous distributions of crowders. Specifically we reveal an asymmetric spreading of tracers even at moderate crowding. In addition to the mean squared displacement (MSD) and local diffusion exponent we investigate the magnitude and the amplitude scatter of the time averaged MSD of individual tracer trajectories, the non-Gaussianity parameter, and the van Hove correlation function. We also quantify how the average tracer diffusivity varies with the position in the domain with a heterogeneous radial distribution of crowders and examine the behaviour of the survival probability and the dynamics of the tracer survival probability. Inter alia, the systems we investigate are related to the passive transport of lipid molecules and proteins in two-dimensional crowded membranes or the motion in colloidal solutions or emulsions in effectively two-dimensional geometries, as well as inside supercrowded, surface adhered cells.
Export citation and abstract BibTeX RIS

Original content from this work may be used under the terms of the Creative Commons Attribution 3.0 licence. Any further distribution of this work must maintain attribution to the author(s) and the title of the work, journal citation and DOI.
1. Introduction
The cytoplasmic fluid of living cells is a superdense medium [1–3], in which biomacromolecules occupy volume fractions reaching well above 30% [4–8]. This macromolecular crowding (MMC) affects the diffusion of larger passive molecules, endogenous as well as artificially introduced submicron tracer particles, and cellular components [9]. One of the central observations is the existence of transient but often very extended anomalous diffusion [10, 11] with the sublinear scaling

of the mean squared displacement (MSD) of the diffusing particles with the anomalous diffusion exponent in the subdiffusive range  [9, 12]. Here Kβ is the generalised diffusion coefficient with units
  . Subdiffusion in the crowded cytoplasm of living cells was observed for fluorescent smaller proteins [13, 14], labelled polymeric dextrane [15] and messenger RNA [1, 16], chromosomal loci and telomeres [16, 17], as well as submicron endogenous granules [18–20] and viruses [21]. Subdiffusion was also reported for the motion of tracer particles in artificially crowded environments [22–30]. We note that active transport processes in living cells may lead to superdiffusion with
  [31–35].
Similarly to the volume crowding, cellular membranes are highly crowded interfaces with up to 25% of the total area [36] occupied by various membrane proteins, ion channels, and pores [37]. By fluorescent correlation spectroscopy and single particle tracking methods anomalous diffusion of the form (1) was measured for both membrane embedded proteins [37–39] and lipid molecules [40]. These experimental findings are corroborated by molecular dynamics as well as coarse grained simulations [41–46]. In model membranes as the one shown in figure 1 the embedded proteins may form aggregates or show only weak mutual attraction, depending on the chemical structure of the lipids and proteins [43]. As illustrated in figure 1 the proteins may form cage-like environments and bottlenecks for the lipid molecules, effecting pronounced anomalous diffusion [43]. The effective mobility in effectively two-dimensional, crowded colloidal systems or emulsions is also of current interest, including the existence of jamming effects [47].
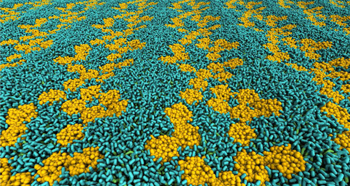
Figure 1. Protein crowded lipid bilayer membrane, illustration from coarse grained simulations. The lipids (small blue molecules) move in an array of proteins (large yellow objects) creating local confinement and bottlenecks for the passage of the lipids. This causes pronounced anomalous diffusion of lipids and proteins [43]. Figure courtesy Matti Javanainen.
Download figure:
Standard image High-resolution imageParticle diffusion in crowded and structured three-dimensional environments has been in the focus of a number of simulations [48–55] and theoretical studies [9, 49, 56, 57]. In membrane systems similar structural elements are effected by the cellular cytoskeleton supporting the membrane [37, 39]. The observed anomalous diffusion in such systems is addressed by various generalised stochastic processes [58–60]. Specifically in an environment of densely packed, freely moving crowders the tracer diffusion follows Brownian motion at sufficiently long times [53], whereas for crowders confined by a potential and for static crowders the tracer diffusion features an extended—albeit ultimately transient—subdiffusive regime [53, 61].
The current interest in crowding comes from experimental evidence of polydisperse mixtures of crowding proteins and spatial variation of the apparent diffusion coefficient in the bacterial [62–64] and eukaryotic [65, 66] cytoplasm, see also [8, 53, 55]. Moreover, the distribution of crowders in the cell was shown to be rather heterogeneous, effecting a faster mobility of small tracer proteins near the cell nucleus of surface adhered cells [65]. We also mention the spatially dependent protein diffusion in the cytoplasm and nucleus [66], the dynamical heterogeneity of the cell cytoplasm [3], and a position dependent viscosity in bacteria [67]. These properties of the cell cytoplasm impose severe restrictions on the rates of biochemical reactions [68, 69] including polymer dynamics [70–73] and particle diffusion [53, 55, 61]. As discussed below our two-dimensional model should remain valid for the diffusion of large tracers in surface adhered, superdensely crowded cells.
In lipid bilayer membranes heterogeneities are also common. Thus cholesterol is known to lead to aggregate [74] and supramolecular complex formation [75]. This controls the preference for different membrane phases [76–78]. Demixing of lipid components and pattern formation may occur [79]. The formation of such domains by electrostatic lipid-proteins interactions was demonstrated by simulations recently [80]. Moreover, microdomains of up to 200 nm in size, so-called lipid rafts, are believed to function as organising centres for molecular assembly [81].
Here we address two aspects of crowding: the finite size of the tracer and heterogeneous distributions of crowders (HDC) in a two-dimensional circular domain. This domain could represent a region of a protein crowded suspended model membrane or a membrane domain within a larger lipid bilayer. Similarly it could represent a fluidic device with a mixture of smaller and larger colloidal particles or emulsion droplets. In the space between the outer boundary and the centre—representing, for instance, a large receptor domain—we place either homogeneous or heterogeneous distributions of monodisperse crowders, as shown in figure 2. We then simulate the motion of a finite sized tracer through a static crowder configuration. Given the separation of mobilities between lipids and proteins in membranes or between small colloids and large, squeezed droplets in fluidic setups, the assumption of a static crowding background appears a good approximation. The implications of polydisperse mixtures of crowders is beyond the scope of this paper, see the discussion section. We investigate the two biologically relevant scenarios of in–out (from centre to domain boundary) versus out–in (from domain boundary to centre) tracer diffusion, finding fundamental differences. From extensive simulations we determine the particle distribution for different crowding environments and study the particle dynamics in terms of the ensemble and time averaged MSDs. We further analyse the non-Gaussianity of trajectories, the van Hove correlation function, as well as the behaviour of the survival probability of the tracer.
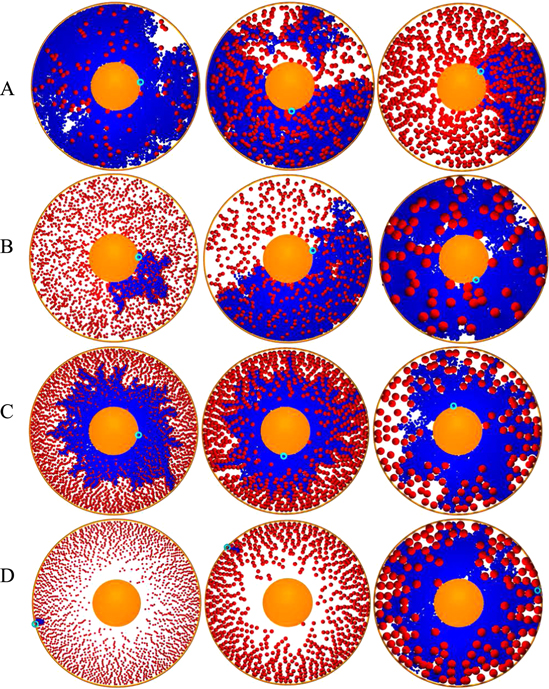
Figure 2. Diffusion profiles for homogeneous (panels (A) and (B)) and heterogeneous ((C) and (D)) monodisperse crowders. In panel (A) the fraction of crowders increases from left to right: ϕ = 0.05, 0.2, 0.3, and their size is fixed to Rc = 2. In panel (B) the size of the crowders grows from left to right: Rc = 1, 2, 5, while the crowding fraction is fixed at ϕ = 0.2. For HDC in panels (C) and (D), the crowding fraction  exhibits the linear growth (2). The centre represented by the excluded disk shown in orange represents a receptor domain or similar structure. The diffusion is in–out (i.e., from the centre to the domain boundary) in panel (C) and out–in (from the boundary to the centre) in panel (D). The initial tracer position is shown by the small blue circle. The crowder radius in panels (C) and (D) grows from left to right: Rc = 1, 2, 5. The regions of the domain visited by the tracer up to the diffusion time T = 104 are depicted in blue. For a single tracer diffusing in the domain with HDC, significant asymmetries in the particle spreading and sampling of the space may arise at higher crowding fractions.
Download figure:
Standard image High-resolution imageThe paper is organised as follows. In the next section we set up the model, discuss the simulation procedure and the data analysis. In sections 3 and 4 we describe the main results for the homogeneous and heterogeneous cases, respectively, and compare them to theoretical models. Further analyses of both cases in terms of the non-Gaussianity parameter and the van Hove function are shown in section 5, while the survival probability is discussed in section 6. In section 7 we draw our conclusions and discuss some applications of our results.
2. Model, simulations scheme, and data analysis
We consider a model domain in the form of a planar circular annulus between the centre, an excluded region of radius a, and the domain boundary at radius R, see figure 2. The space between the boundary and the centre is filled with static monodisperse crowders of radius Rc. We consider two cases: a homogeneous distribution of crowders with a prescribed crowding (area) fraction ϕ, and HDC with a linear radial gradient

for  . As we show below, equation (2) leads to a transient subdiffusion of the tracer motion from the centre to the boundary, emerging due to an increasing density of crowders near the boundary as evidenced by figures 2(C), (D). The present approach is complementary to our recent studies of heterogeneous diffusion processes [82–87] with a deterministic space dependent diffusivity. Similar to the findings in those studies the explicit HDC considered here gives rise to a radially varying particle diffusivity in the domain, to non-Brownian diffusion, and non-Gaussian statistics of particle displacements, see below. The methodology reported here further develops the model of tracer diffusion in lattices with periodically distributed crowders examined by us recently [61].
In the simulations the crowders are placed at random positions in the domain without overlap. The initial tracer position is well in between neighbouring crowders. The highest crowding fraction is around 30%. When computing the mean time averaged MSD we typically average over M = 102 random configurations of crowders. This disorder average is taken in addition to the average over individual trajectories in a given, quenched crowder configuration.
The tracer particle has a fixed unit radius σ/2. We set the outer and inner domain radii to R = 100 and a = 30, respectively. The radii are measured in terms of the length scale σ = 6 nm, see below. For most cases of HDC we set  and
and  . The latter value is considerably smaller than the percolation threshold in two dimensions. However, due to the finite size of the diffusing particles, the effective crowding fraction
  is higher than for a point-like tracer. For instance, for Rc = 5 and a unit tracer radius one gets for a domain with R = 100 and a = 30 that
  ; this is already much closer to the percolation threshold of
  .
.
The Weeks–Chandler–Andersen repulsive potential given by the 6–12 Lennard–Jones (LJ) potential  with the standard cutoff distance
  is used to parameterise the repulsion between the tracer and crowders

for  , and
, and  otherwise [88–90]. We do not consider here attractive tracer-particle interactions, see the discussion section. We evaluate the LJ based interactions in our two-dimensional system by calculating the centre-to-centre distance between interacting discs. We represent the LJ potential in polar coordinates, independent of the space dimension. The potential of the form (3) is often used to simulate the properties of two-dimensional fluids [91–93]—see also [94] for higher dimensions. When implementing the repulsive part of the LJ potential in our simulations, we calculate the force in one dimension and then update the coordinates x and y independently. The details of the system behaviour, however, can evidently depend on the procedure of truncation of the LJ potential, see, for instance, [89, 90] for an example of two and three-dimensional LJ fluids. Some of these differences for systems of repulsive discs can, however, be reconciled in terms of an effective particle diameter [92].
We simulate the dynamics of the mid point  of the tracer via the Langevin equation

where m is the mass of the tracer particle, ξ is the friction coefficient experienced by the tracer particle,  is its velocity, and
  is the static position of the Jth crowder. Finally
  represents a Gaussian δ-correlated noise with zero mean and covariance

The inertial term in equation (4) gives rise to a short time ballistic dynamics, as shown below (see [61] for more details). In the simulations we set  , and ξ = 1 corresponding to moderate damping [95–97]; the solution viscosity in these units is 1. The reader is also referred to the studies [55, 98] regarding the scale dependent viscosity known to exist in the cell cytoplasm. The diffusivity of a tracer in an uncrowded environment is

The unit time step of simulations corresponds to the physical time  . For the chosen radius of σ, given a mass characteristic for the molecular weight of biomolecular crowders of a similar size of about 68 kDa [55, 99, 100], the physical time scale corresponds to
  nsec. We employ the Verlet velocity algorithm with the time step δ t = 0.01 to integrate the stochastic equation (4).
To characterise the diffusion behaviour we evaluate the time averaged MSD

for individual particle trajectories  . Here T is the observation time and Δ is the lag time defining the width of the window slid along the trajectory. This definition is standard in single particle tracking experiments [1, 12, 60, 101]. Given N measured trajectories the ensemble average is

For quenched HDC we also calculate the disorder average over M realisations of a crowding environment (compare [102, 103]),

The ensemble averaged MSD is also computed as double average over N tracer trajectories for each crowders distribution and M crowders distributions

3. Homogeneous crowding: ensemble and time averaged MSDs
We start with the analysis of the tracer diffusion among static HDC, figures 2(A), (B). Figure 3 shows the ensemble averaged MSD  and the local MSD scaling exponent

when the crowding fraction ϕ and the crowder radius Rc are varied. For relatively large crowders the initial standard ballistic growth of the MSD (underdamped particle motion, see also [61]) crosses over to a quite prolonged Brownian regime with  , figures 3(A), (C). For the smaller crowders, after about the same physically expected relaxation time of
  , a region of subdiffusion emerges, compare panels (B) and (D) in figure 3 for the behaviour of the MSD and the scaling exponent with panels (A) and (C).
The ballistic regime in the tracer displacement extends to about the same time scale

both for normal and subdiffusive tracer behaviour at later times, as we checked in the simulations (results not shown). At even later times the tracer motion starts to be affected by confinement due to the outer reflecting membrane boundary positioned at r = R, and the MSD begins to saturate to a plateau, as expected. Concurrently the exponent  tends to zero. This drop is solely due to the HDC in our model: for the tracer diffusion in dense mixtures of purely repulsive and uniformly smeared crowders, the diffusion was shown to be nearly Brownian [55]. We also expect that the short time ballistic behaviour of the MSD and the peculiar features of the repulsive tracer-crowder interaction potential do not measurably affect the long time scaling behaviour of the tracer MSD.

Figure 3. MSD, local scaling exponent  , and time averaged MSD
  for tracer diffusion in homogeneously crowded domains. The two columns are for Rc = 5 (left) and Rc = 1 (right). The data for different ϕ are shown by different symbols in the panels (A)–(D). In panels (A) and (B) the two dashed lines indicate the ballistic asymptote at short times and the linear Brownian growth at intermediate times. In panels (E) and (F) we plot N = 100 time averaged MSD curves for a particular distribution of crowders. In panel (E) the long time plateau (13) of the MSD is shown by the dotted line. Parameters: the radius of the domain is R = 100 and the centre radius is a = 30. The fraction ϕ is indicated in the panels. Where applicable, the number of different crowders configurations used in the averaging for the MSD and the scaling exponent is M = 100 (disorder averaging), the number of tracer trajectories in each crowders configuration is N = 100 so that
  . To improve the presentation, a log sampling of the data points along the x axis is employed for time and ensemble averaged quantities.
Download figure:
Standard image High-resolution imageThe effect of ϕ on the MSD behaviour is illustrated in panels (A) and (B) of figure 3 for large and small crowders, respectively. For a tracer of unit size the larger crowders do not appear to create substantial obstruction for the simulated MMC fractions. Even at relatively large ϕ values the MSD only marginally diminishes with increasing ϕ, see panel (A). In other words, small tracers always manage to manoeuvre around large void spaces remaining between large crowders (figure 2). In contrast, relatively small crowders at identical MMC fractions yield severe reductions of the diffusive tracer motion, figure 3(B). This observation is consistent with the dramatic differences of the spatial space exploration patterns in panels (B) of figure 2. The magnitude of the MSD plateau attained for larger ϕ values is much smaller than expected for an annulus without crowders, compare with equation (13) below. This fact is due to the intricate labyrinthine environment formed by small crowders for diffusion of the same tracer. For small crowders the value of β is reduced significantly and at much earlier times for larger ϕ, see panels (C) and (D) of figure 3. These features obviously strongly depend on the specific quenched environment, in which the particle motion occurs, resulting in a high degree of irreproducibility of the tracer diffusion for different realisations of the disorder. This is also quantified in panel (F) of figure 3 and leads to substantially larger uncertainties in the scaling exponent  computed from the MSD curves. The strong effect of small crowders on the MSD and its scaling exponent at intermediate times and the minor effect of the large crowders is our first main result.
We now turn to the analysis of the time averaged MSD obtained from averaging over M = 102 tracer trajectories for a single crowder configuration. As shown in panel (E) of figure 3 for large crowders with Rc = 5 and small MMC fractions  the spread of
  is quite small. At later times—when the tracer motion starts to be influenced by the outer boundary—the average
  approaches a plateau which has about twice the amplitude of the MSD plateau, see panel (E) in figure 3. Note that due to the relatively small domain size used in the simulations, the moderate trajectory lengths, and the presence of randomly distributed crowders this plateau is not as distinct as, for instance, for the deterministic, confined heterogeneous diffusion processes, compare figure 4 in [86] and figure 8 in [87].
We recall that for the uncrowded case the long time (plateau) values of the ensemble and time averaged MSDs are related to the inner and outer radii in two-dimensions as

The factor 1/2 stems from the very definition (7) of the time averaged MSD [60, 104, 105]. The asymptote (13) is shown in figure 3(E). The attainment of a plateau value of both ensemble and time averaged MSDs on a bounded domain is a typical feature of both ergodic processes such as Brownian and fractional Brownian motion and even some weakly non-ergodic processes. It is thus inherently different from the deviations from a plateau value in confining potentials [60, 104].
In contrast, for small crowders at high MMC fraction of ϕ = 0.3 the amplitude spread of the time averaged MSD curves for a particular distribution of crowders is quite pronounced, figure 3(F). The magnitude of  is much smaller than that for larger crowders, compare the magnitude of
  in panels (E) and (F) of figure 3. In fact, time averaged MSD curves with very small magnitudes (below 1) resulted from almost immobile finite size tracers that were blocked by surrounding crowders. Moreover, the tracer only rarely reaches the outer boundary but mostly saturates at much lower values due to confinement by the crowders in a sub-domain of our model domain. The time averaged MSD itself features a much more pronounced amplitude scatter for the same number N of traces used in the averaging, see figure 3(F). Because of the tracer localisation and the wide amplitude spread of
  , the mean
  has poor statistics and its relation to the MSD prescribed by (13) is difficult to check. This behaviour of the time averaged MSD in homogeneous crowding environments is our second main result.
Figure 4 compares the average over N different tracer trajectories starting at random points at the centre for a single crowder distribution and the double averaging that includes the average over M random realisations of crowders. The time averaged MSDs for N = 100 and M = 100 are shown by symbols, while those for the case M = 1 and N = 104 are shown as solid lines. The two cases of homogeneously distributed crowders for large (panel (A)) and small (panel (B)) crowders are presented. We observe that the differences between the two averaging approaches are rather small: the single average over 104 trajectories and the double average over 102 trajectories and 102 crowder distributions yield very similar results.

Figure 4. Time averaged MSD curves for trajectory based averaging only (solid lines; M = 1, N = 104) and for double averaging over tracer trajectories and realisations of the crowder distributions (symbols; M = 102, N = 102), computed for homogeneously distributed crowders. These curves can be compared to the results in panels (E) and (F) of figure 3. The crowder radius Rc and the fraction ϕ are indicated in the plots. Note that individual  curves are not shown, only the averages
  and
and  .
.
Download figure:
Standard image High-resolution image4. Heterogeneous crowding: ensemble and time averaged MSDs
How does HDC affect the above results? An immediate effect consists in very different properties for the in–out (from the centre to the boundary) and out–in (from the boundary to the centre) scenarios of the tracer diffusion. The average local density of crowders in the simulation domain (see panels (C) and (D) of figure 2) is generated according to equation (2) which naturally leads to a higher local diffusivity close to the centre.
For the in–out diffusion from the centre to the domain boundary the tracers become trapped in progressively denser arrangements of HDC At the same  , these caging situations arise earlier in time for smaller crowders as compared to larger crowders, compare the panels (C) in figure 2. Similar to the homogeneous case the MSD starts ballistically, with the maximal time scale of ballistic motion being independent of the crowder radius and the extent of anomalous diffusion in the system at later times, equation (12). The tracer motion then reveals a linear Brownian regime, and finally saturates due to the confinement in the annulus. Concurrently, the scaling exponent
  decreases continuously and finally vanishes when the MSD approaches a plateau, see panels (A) and (C) of figure 5. The spread of
  is relatively small and their long time plateau is again about twice of that of the ensemble averaged MSD for a particular crowder configuration, as expected from relation (13) and seen in panels (E) of figures 3 and 5. At intermediate times a disparity between the ensemble and time averaged MSD is also observed when compared to the homogeneous case, see figure 5(E). The scatter of
  decreases when longer trajectories are analysed (results not shown). This behaviour is expected and is realised for several ergodic and nearly ergodic processes [60, 105]. The magnitude of the amplitude scatter of
  in panels (E) of figures 3 and 5 is comparable to that of Brownian motion [60, 106, 107] as the tracers explore a less crowded space over time.
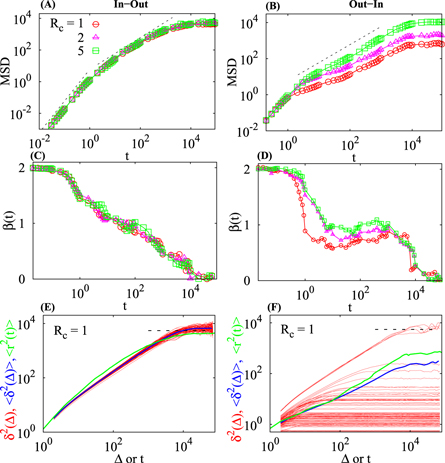
Figure 5. MSD, exponent  , and time averaged MSD for particles diffusing for HDC of the form (2). The two columns correspond to the in–out and out–in tracer diffusion, that is, respectively, for the release of the tracer particle at the inner and outer radii of the model domain. The data for different crowder radii Rc are shown by different symbols in panels (A)–(D). In panels (A) and (B) the dashed lines indicate the ballistic asymptote at short times and the linear Brownian regime at intermediate times. In panels (E) and (F) the long time plateau of the MSD for the uncrowded case given by the asymptote (13) is shown by the dashed line. Parameters:
  100, and N = 100.
Download figure:
Standard image High-resolution imageIn the opposite case of out–in diffusion (panel (D) of figure 2) we observe that for relatively high ϕ of small crowders a finite size tracer often cannot even leave the vicinity of the boundary, giving rise to prolonged trapping events in this confined area. This leads to a large proportion of low amplitude, nearly constant  curves, corresponding to the red curves in figure 5(F). The mean time averaged
  is in many cases dominated by several successful fast translocation events of tracers from the domain boundary to the centre. In the long time limit the asymptote (13) is thus not valid in this situation. The tracer localisation and the dominance of one or few extreme tracer trajectories in the mean
  is also a rather common feature of stochastic processes in the presence of well pronounced traps as well as in ageing stochastic processes [60, 108]. The distinctly different behaviour between out–in and in–out diffusion in the system of HDC is the third main results of this study.
Since the crowding fraction in equation (2) grows from the centre towards the boundary, the in–out diffusion for HDC is expected to be subdiffusive [84]. In this scenario the tracers are progressively trapped closer to the domain periphery. Here, however, we observe the formation of a radial percolation in the circular domain: the tracers are not allowed to penetrate beyond some critical radius that features a particular critical density of crowders, an effect that is crucially related to the finite size of both the crowders and the tracer particle. Similar effects of local confinement are naturally observed for single particle trajectories of tracer diffusion in random percolation systems [103]. The initial period of the tracer diffusion that occurs in the region with low crowder density is naturally reproducible and leads to a small spread of  curves, as shown in figure 5(E).
In contrast, for the out–in diffusion the tracer starts in the region of the highest concentration of crowders and diffuses into regions containing less and less crowders. The associated initial tracer localisation events give rise to stalling  curves with a very large spread, see figure 5(F). Early trapping in this scenario leads to the emergence of a longer plateau region in the corresponding time averaged MSD curve. The mean
  computed over an ensemble of N trajectories is rather imprecise because of the dominance of few extreme events.
We checked that for homogeneously distributed crowders the radial tracer diffusivity is approximately constant (panels (A) and (B) of figure 6), as it should be. As the size of the crowders decreases at a constant ϕ, the effective viscosity of the solution increases, as follows from the decreasing normalised diffusion coefficient plotted in figure 6(B). Also, the solution becomes effectively more viscous with increasing MMC fraction ϕ, see panel (A) of figure 6. In turn, for HDC given by equation (2) the radial tracer diffusivity is a decreasing and nearly linear function of the distance from the centre (panel (B) of figure 6),

The slope 0.78 is nearly independent on the crowder radius Rc. This linear dependence of the instantaneous diffusivity decrease in the domain is a consequence of the linear increase of the crowders density  , equation (2). This linear dependence of
  in equation (14) is our fourth main result.
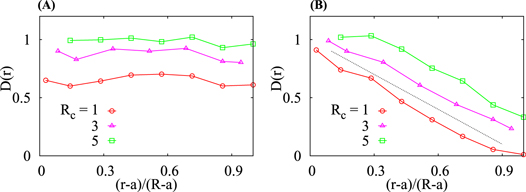
Figure 6. Effective radial diffusivity of tracers for ((A) and (B)) homogeneous and (C) heterogeneous  crowding. Other parameters are the same as in figures 3 and 5, respectively, and Rc and ϕ values are as indicated. The dashed line in panel (C) represents the asymptote (14) without the last constant term. The local tracer particle diffusivity values presented in panel (C) are identical for in–out and out–in diffusion.
Download figure:
Standard image High-resolution image5. Non-Gaussianity parameter and van Hove correlation function
Following reference [61] we now proceed to evaluate the experimentally relevant non-Gaussianity parameter for the tracer diffusion in our crowded environment. Similar to the ergodicity breaking parameter EB [60, 109] it contains the fourth order moment of the tracer time averaged MSD. Namely, in two-dimensions we have [9, 110]

We find that for in–out diffusion the non-Gaussianity parameter assumes moderate values for shorter lag times Δ while it becomes close to zero for longer lag times, figure 7(A). This is a typical long time behaviour of ergodic tracer diffusion, compare figure 3(a) in [110]. Indeed, as we show in figure 5(E), in the long time limit the ensemble and time averaged MSDs differ simply by the above mentioned factor of 2 for HDC In contrast for out–in diffusion the non-Gaussianity parameter attains substantially larger values. This feature is likely due to the highly non-reproducible trajectories of the tracer motion and prolonged localisation events near the domain boundary at high crowder concentration.

Figure 7. Non-Gaussianity parameter  (15) for in–out and out–in tracer diffusion. Parameters are the same as in figure 5, and the results are averaged over N = 104 tracer trajectories for a single configuration of crowders (M=1).
Download figure:
Standard image High-resolution imageThe trapping as well as the non-Gaussianity of the tracer diffusion can also be characterised by the van Hove correlation function  describing the probability that a particle moves a distance Δx during time Δt[111, 112],

where N is the number of tracers used for averaging. For a system of hard spheres this function simply corresponds to the Gaussian propagator [113] governed by the diffusion equation.
Figure 8 shows the behaviour of  for tracer diffusion in HDC We observe that for relatively large crowders the probability of trapping events of the tracer particle is quite low and the distribution of tracer displacements remains close to Gaussian for all ϕ studied, as it should (see panel (B) in figure 8). In contrast, for small crowders the non-Gaussianity of the van Hove function becomes quite pronounced, in particular for larger ϕ, figure 8(A). A faster decay of the tracer displacements at high ϕ and for small crowders is a consequence of tracer caging by crowders and anomalously slow diffusion. The almost exponential distributions for high crowding fraction in panel (A) of figure 8 compare well with the experimentally measured step size distributions for polymer diffusion on nano-patterned surfaces presented in figure 4 of [114] as well as for liposome diffusion in nematic solutions of actin filaments in figure 3(C) of [115]. HDCs for tracer diffusion cause a separation of particles into slow and fast populations (compare [83]), reflected in a cusp of the particle distribution near the origin and longer than Gaussian tails for large tracer displacements.

Figure 8. Van Hove correlation function for homogeneous crowder distributions, at several ϕ values. Other parameters are the same as in figure 3. The solid line shows the approximately Gaussian function obtained from our simulations for a tracer restricted to an annulus without crowders. Panels (A) and (B) are for crowder radii Rc = 5 and Rc = 1, respectively, computed for Δ t = 100 corresponding to Δ t/δ t = 104 simulation steps.
Download figure:
Standard image High-resolution imageFor HDC the behaviour of the van Hove function is illustrated in figure 9. We observe that for in–out diffusion the distribution remains approximately Gaussian for all crowder radii Rc in our simulations. This corresponds to the rather small non-Gaussianity parameter and quite limited spread of  curves. In contrast, for out–in diffusion among small crowders
  becomes progressively non-Gaussian. It features a pronounced cusp near Δ x = 0 describing a prevalence of small displacements characteristic for subdiffusion in rather confined conditions. The detailed behaviour of the non-Gaussianity parameter and the van Hove correlation function represents the fifth main result of the present study.

Figure 9. Van Hove correlation function for (A) in–out and (B) out–in diffusion plotted for several crowder radii Rc in HDC The solid line shows the simulated distribution of a tracer restricted to an annulus without crowders: it almost superimposes with the results for the largest crowders at Rc = 10. Other parameters are the same as in figure 5.
Download figure:
Standard image High-resolution image6. Survival probability
First passage time statistics are important to describe cellular processes, for instance, to quantify the diffusion limit of reactions triggered by incoming, diffusing molecules [116–118]. Similarly, the anomalously diffusive motion of membrane channels is implicated in the function of centres responsible for the exchange of larger particles across membranes [37]. In the present model for a membrane domain we focus on the survival behaviour of particles arriving to the boundary from the centre surface (in–out case) or arriving to the centre surface from the domain boundary (out–in case). To examine this behaviour we consider the survival probability  that a tracer started either at the centre or at the boundary, and does not attain a distance
  away from the centre up to time t. This standard definition of the survival probability is directly related to the probability density of the first arrival time
  of the tracer to that distance [116–118].
Figure 10 shows  for homogeneous and heterogeneous MMC. For both homogeneous case and in–out diffusion for HDC we observe at intermediate times

In turn, for out–in diffusion in HDC  has only a very weak dependence on the diffusion time t. As the distance
  increases the survival probability starts to follow the scaling behaviour at later times, figure 10. Similar scaling relations were obtained for subdiffusive heterogenous diffusion processes with a diffusivity
  for in–out diffusion of particles [84]. We also simulated the tracer diffusion in the annulus without crowders but with the effective local radial diffusivity
  presented in figure 6(C). In these simulations, the same scaling law (17) for
  was obtained, compare figures 10 and 11.

Figure 10. Survival probability  for (A) homogeneous crowding (tracers are released near the centre), and for HDC (2) for the cases of (B) in–out and (C) out–in diffusion. The asymptote
  from equation (17) is shown in panels (A) and (B). Different colours indicate
  for various distances
  from the centre within which the tracers are counted. Neither the inner boundary at r = a nor the outer boundary at varying radius
  is absorbing in the simulations. The parameters for panels (A)–(C) are the same as in figures 3 and 5, respectively, and the conditions of the most effective crowding are chosen, with a crowder radius Rc = 1. The averaging is performed over N = 104 tracer trajectories.
Download figure:
Standard image High-resolution image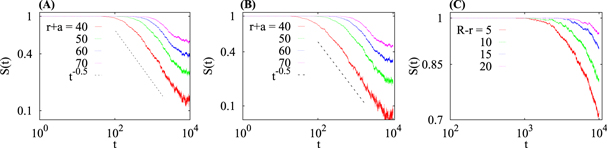
Figure 11. The same as in figure 10 but computed for the effective diffusivity  from figure 6(C). The asymptote
  is shown in panels (A) and (B).
Download figure:
Standard image High-resolution imageFigure 10 shows that the survival probability appears to saturate to finite values, instead of decaying to zero. The non-zero limiting value of  is related to the disorder averaging and should be equal to the fraction of HDC in which the circle of radius
  is not accessible for a finite size tracer. In fact, for such configurations the survival probability is 1, and it is then weighted by the fraction of these configurations. The behaviour of
  is the sixth main result of this study.
The probability density  of arrival times of the tracer particle at the inner and outer boundaries of a given domain for the particle diffusion in homogeneous and heterogeneous mixtures of crowders is shown in figure 12. It reveals a decay

at intermediate time scales when the scaling for  is very clear; namely, at times
  . The observed scaling of
  is thus consistent with the general relation
  known between the two quantities [118]. A better statistic and larger domain size might, however, be needed in simulations to unambiguously validate the precision of the scaling laws (17) and (18) and the regimes of their temporal validity.

Figure 12. Probability density of arrival times  for homogeneous crowding (panel (A)) and HDC for in–out (B) and out–in (C) diffusion. The arrival of particles was evaluated at the radius
  for in–out diffusion and r = R − 30 for out–in diffusion, to reach a satisfactory statistic. Parameters are the same as in figure 10, and the number of events in each panel is
  .
.
Download figure:
Standard image High-resolution image
7. Discussion and conclusions
The dynamics of the lateral mobility of individual lipid molecules in a lipid bilayer as well as of membrane embedded proteins is of fundamental importance for the function of biological membranes. For instance, the lipid demixing to form domains and patterns or protein complex formation are considered to be elementary prerequisites for membrane associated processes. Here we studied a schematic two-dimensional model system for such processes: small particles (the lipids or small embedded molecules) with a finite size diffuse in a static array of large particles (the crowding proteins or protein complexes) at different crowding densities and crowder distributions. We observed several remarkable effects that are of interest from a physical point of view but will also impact the study of (quasi) two-dimensional crowded systems such as lipid bilayer membranes or fluidic systems such as confined emulsions or colloids.
The spatial heterogeneity of physical systems is often modelled through space-dependent diffusivities  . These approaches include deterministic prescribed shapes of
  [82–87] corresponding to the systematic variation of the local particle diffusivity observed in living cells [65, 67]. Concurrently
  can be taken as a spatially and temporally random quantity [119, 120]. Both kinds of processes may lead to non-stationary anomalous diffusion exhibiting ageing even at long observation times [60]. Our extensive Langevin dynamics simulations of tracer diffusion in a finite heterogeneous environment reveal transient anomalous diffusion with a number of features that are similar to these idealised stochastic models.
For point-like diffusers one would expect that smaller crowders impede the diffusion less, as the tracer can always pass through even small gaps between the crowders. In turn, the point tracer would have to navigate around larger crowders and thus be affected more severely. As we showed here the opposite effect occurs for a tracer of a finite size, comparable to the size of the crowders. In this case small crowders significantly hamper the spreading of the tracers as compared to larger crowders at the same crowding fraction ϕ. Moreover, the van Hove correlation function acquires an exponential shape at higher ϕ and small crowders, whereas this function is nearly Gaussian and quite insensitive to the crowding fraction for large crowders. While one would expect this effect to be somewhat mitigated by a finite yet small mobility of the crowders recent simulations studies of protein crowded lipid bilayers indicates that the motion is very similar to that of particles diffusing in static obstacle arrays [43].
Concurrent to this effect we observe for larger, homogeneously distributed crowders an extended Brownian regime of the ensemble averaged MSD, whose magnitude is almost independent of the crowding fraction within the investigated range. The time averaged MSD in this case is also highly reproducible. For smaller crowders, however, anomalous diffusion effects in the ensemble averaged MSD occur and become more severe as ϕ increases. Additionally, individual time averaged MSD curves demonstrate the early immobilisation of the tracer particles in the quenched landscape, corresponding to the crossing of a local percolation threshold for the tracer motion.
Similar effects were observed for HDCs. Due to the deterministic gradient of the crowder distribution, we distinguished the two scenarios of in–out and out–in diffusion. The in–out case resembles in many aspects the homogeneous case: the spread of the time averaged MSD is small, the van Hove correlation function is close to Gaussian and weakly depends on the crowder size, and the survival probability exhibits the characteristic square root decay at intermediate times. In contrast, the out–in case is marked by a highly non-Gaussian diffusion of the tracer: high values of the non-Gaussianity parameter and a pronounced cusp in the van Hove correlation function near Δ x = 0 reveal a prevalence of small displacements. This is characteristic for subdiffusive processes. Moreover, the survival probability exhibits a very slow decay and tends to saturate at large values reflecting the dominance of crowder configurations that block the tracer near the release point at the domain boundary. As a consequence, the computed averages over tracer trajectories are dominated by few successful translocation events.
Could some of the observations of our two-dimensional system also be relevant for the diffusion of particles in the cytoplasm of biological cells? Many eukaryotic cells are often adhered onto surfaces and reveal a quasi two-dimensional, fried egg shape [21, 31, 65, 84]. The vertical cell thickness may be as small as several microns or less, as compared to tens of microns in the lateral dimension of non-adhered cells. This enables the tracking of tagged diffusing particles for longer distances, for instance, by conventional fluorescence microscopy when the particles need to stay close to the focal plane [121–123]. Still, we emphasise that for relatively small tracer particles (such as small cellular proteins), the cell thickness even in its flat regions is much larger than the average inter-crowder separations. However, larger diffusing particles may be impeded by crowders such as vesicles, often found in great abundance in certain cell types such as insulin producing cells [20] or amoeba [35]. In these supercrowded[35] cases our results could well be applicable albeit with a renormalised tracer particle size to accommodate for some possible overlap due to the third dimension.
In the present study we neglected hydrodynamic interactions between the tracer and the crowders. In three-dimensional systems this may affect the long time diffusion [2, 50, 124–126]. The slow, 1/r decay of this hydrodynamic coupling implies that a diffusing particle is impacted by crowders from a finite distance that helps avoiding to collide with the crowders. In the two-dimensional membrane system motivating our study the lipid molecules themselves represent a fluid background in which the crowding proteins are embedded. Water molecules are typically expelled from the bilayer and only wet its surfaces.
It will be of interest to extend our results to three-dimensional crowded situations, in particular, to the superdense [1] cytoplasm of biological cells. There, the crowding induced changes in the diffusion of signalling molecules is expected to impact gene regulation and metabolism [127] and also alter active transport properties [21, 33, 34, 128]. Other extensions of the current model include polydisperse static and dynamic crowders [129–131], cylindrical domains mimicking a typical bacterial shape [55, 132], specific and non-specific tracer-crowder interactions [55, 61], three-dimensional computer simulations, a variable tracer size, as well as deformable and non-spherical crowding particles [133, 134].
Acknowledgments
We thank E P Petrov for discussions and M Javanainen for providing figure 1. We acknowledge funding from the Academy of Finland (Suomen Akatemia, Finland Distinguished Professor to RM), the Deutsche Forschungsgemeinschaft (Grant to AGC), and the French National Research Agency (Grant ANR-13-JSV5-0006-01 to DSG).