


Abstract
The laser–plasma wakefield accelerator is a compact source of high brightness, ultra-short duration electron bunches. Self-injection occurs when electrons from the background plasma gain sufficient momentum at the back of the bubble-shaped accelerating structure to experience sustained acceleration. The shortest duration and highest brightness electron bunches result from self-injection close to the threshold for injection. Here we show that in this case injection is due to the localized charge density build-up in the sheath crossing region at the rear of the bubble, which has the effect of increasing the accelerating potential to above a critical value. Bunch duration is determined by the dwell time above this critical value, which explains why single or multiple ultra-short electron bunches with little dark current are formed in the first bubble. We confirm experimentally, using coherent optical transition radiation measurements, that single or multiple bunches with femtosecond duration and peak currents of several kiloAmpere, and femtosecond intervals between bunches, emerge from the accelerator.
Export citation and abstract BibTeX RIS

Content from this work may be used under the terms of the Creative Commons Attribution 3.0 licence. Any further distribution of this work must maintain attribution to the author(s) and the title of the work, journal citation and DOI.
1. Introduction
The laser–plasma wakefield accelerator (LWFA)[1] produces high quality relativistic electron beams with energies currently ranging from 100's of MeV to several GeV by exploiting the large electric field gradients generated by intense laser pulses interacting with plasma [2–7]. Potential applications of LWFAs include drivers of compact synchrotron sources [8, 9], which have been demonstrated first in the visible [10] and then in the vacuum-ultraviolet [11] and at gamma ray energies [12]. The accelerating structure of the LWFA operating in the nonlinear blowout regime, consists of a string of ion 'bubbles' of evacuated regions of plasma created by the combination of the ponderomotive force of an intense, ultra-short, laser pulse and the electrostatic restoring force of background ions acting on plasma electrons. Electrons can be injected into the LWFA structure, if their velocity exceeds that of the bubble, from either an external injector, from the background plasma, or from further ionized gas. High brightness beams with narrow energy spreads  % [13], geometric transverse emittance of
  mm mrad [14–16] and ultra-short duration
  fs [17] have recently been demonstrated. The highest quality beams with bunch charges of 1–20 pC are produced close to threshold for injection [13, 18]. These attractive parameters make the LWFA a suitable candidate for driving a compact free-electron laser (FEL) [8, 9]. FELs require beams of low emittance, narrow energy spread and high peak current electron bunches [19], which are possible when the bunch duration is short.
The injection process is crucial in determining the electron bunch properties. Several models have been proposed to describe injection, but most are not valid for current experimentally relevant parameters, as we show below, or do not accurately predict bunch properties, such as bunch duration and structure, or the threshold for self-injection, which has been studied experimentally [20] (in a restricted density range) and using numerical simulations [21] (but without investigating the bunch structure in either case). In these models, injection is invoked by wavebreaking [22], variations in the bubble length (Hamiltonian  ) [23, 24] or phase velocity [25, 26], or electron capture when the potential due to the ion background inside the bubble exceeds the kinetic energy of electrons in the sheath [25, 26]. Another condition for self-injection inferred from numerical simulations requires the bubble radius to be larger than four times the plasma skin depth [27].
Here we show that just above the threshold for injection it is necessary to take into account the build-up of charge in the sheath-crossing region, as schematically shown in figure 1. We show that near-threshold injection is always below the thresholds predicted by the existing models for injection, unless they take charge build-up into account. Whilst [24] describes a relaxation of the injection threshold due to charge build-up, they consider expansion of the bubble as the main mechanism for injection (and as 'crucial' for acceleration driven by petawatt lasers). Charge build-up in this region should also be accounted for in colliding beam injection and density ramp injection, but for the purpose of this paper we restrict ourselves to a LWFA driven by a single laser pulse in plasma with uniform density. We show theoretically, and confirm with simulations and experiments, that femtosecond duration bunches with high peak current are created by self-injection when the potential in the sheath crossing region is enhanced by this charge build-up, which is governed by the sheath current. Its time dependence leads to a bunch structure consisting of either single ultra-short duration bunches, with low (local) dark current, or more complicated trains of very closely spaced bunches that are injected into the same bubble. The formation of such bunch structure due to near-threshold injection cannot be explained by other injection mechanisms and to our knowledge has not been described before. Ultra-short duration bunches with femtosecond micro-structure have been experimentally confirmed on the ALPHA-X beamline [8, 9, 13, 18] from measurements of the bunch structure that are derived from the spectra of coherent transition radiation (CTR) emitted as the bunches traverse a pair of thin metal foils. We also show that the bunch structure can be controlled by varying the plasma density.

Figure 1. Model for the wakefield bubble. (a) Geometry and charge distributions; (b) and (c) potentials for  (without build-up) and
  (with build-up), respectively.
Download figure:
Standard image High-resolution image2. Near-threshold self-injection
When the normalized vector potential, a0  of an intense ultra-short laser pulse is greater than unity, its ponderomotive force drives a large amplitude plasma density wake to form a string of bubble-shaped cavities, where A is the vector potential, c the speed of light, and
  and me the electron charge and mass, respectively. The resulting charge separation produces an electric field of the order of
  V cm−1, with n0 the plasma density. For typical densities, this is more than three orders of magnitude larger than in conventional accelerators. The (normalized) bubble velocity,
  and associated Lorentz factor
  are determined by the plasma dielectric properties and the 'etching' of the front of the laser pulse, where
  and
and  are the laser and plasma frequencies, respectively; the bubble radius, for
  is
is  when the laser spot size matches the bubble size [27].
  is the critical power for relativistic self-focussing [28] and
For self-injection from the background plasma to occur, the initially stationary electrons must gain sufficient longitudinal momenta in the accelerating potential of the bubble to be captured and accelerated. The details of injection have a profound impact on the final beam properties, such as charge, peak current, brightness, bunch duration etc. Various semi-empirical models have been proposed to explain electron injection [23, 25, 26, 29]. According to [25, 26] injection of an electron occurs when its kinetic energy is less than the potential energy, i.e., for  which is only valid for high a0 and/or high densities where large energy spread beams are observed in experiments.
The motion of an electron in the bubble is governed by the Hamiltonian  [30, 31], where
  is the Lorentz factor,
  and
and  are the kinetic and canonical momentum, respectively, ϕ is the scalar potential, and
  with
with  and
and  Dimensionless units are used from here onwards unless otherwise stated: time is normalized to
  length to
  velocity to c, momentum to mec, the potential to
  the electromagnetic fields to
  energy to
  mass to me, charge to
  and the electron number density, n, to n0. The Hamiltonian varies slowly in time due to plasma bubble shape and velocity evolution resulting from beam loading, laser pulse shape and spectrum changes, and plasma density variations. Bubble expansion can be modelled as
  where
where  is the expansion rate and R0 the initial bubble radius [26].
The potential for an idealized spherically symmetric bubble, in the gauge where  is
is ![$\phi =-[{r}^{2}-{R}^{2}(t)]/8,$](https://content.cld.iop.org/journals/1367-2630/17/9/093033/revision1/njp519463ieqn35.gif) which can be used to predict the parameter range for electron trapping solely due to stretching of the bubble. The condition according to [23] for electron trapping in this case,
which can be used to predict the parameter range for electron trapping solely due to stretching of the bubble. The condition according to [23] for electron trapping in this case,  is shown graphically in figure 2. The equations of motion (3), below, have been solved with this potential for different values of the bubble radius and expansion rates to determine the trajectories as the bubble expands for up to four plasma cycles. As an example, no injection occurs for
  and
and  Parameters of several current experiments (cases A–D) and of a simulation taken from [23] (case E) are marked in figure 2. Since bubble expansion rates are not known for these experiments, we estimated upper limits from the parameters of [23]. Even for these expansion rates, which exceed those typically seen in simulations, all of them are in a region that would not allow injection solely due to bubble expansion.

Figure 2. Density plot showing the injection condition ( ) of [26] (not taking charge build-up into account) as a function of the radius of the bubble (
 ) and the expansion rate
  A selection of current experiments are plotted in the figure to show that current experiments are below threshold for injection unless build-up at the rear of the bubble is included in the Hamiltonian: A [3], B [2], C [4], D [5]. From the densities reported for these experiments, indicated on the top axis, typical expansion rates have been estimated by assuming a 300 μm expansion distance for a 20% bubble size increment (as in [23]), and an amplitude range
  (after self-focusing) has been assumed. E indicates the parameters corresponding to the injection threshold based on the analytical model of [23] (p 2), which uses an expansion rate of
  close to the threshold for injection, for Rkp = 5.
Download figure:
Standard image High-resolution imageIn the following we focus on the region  and develop a model for near-threshold injection, which includes the build-up of charge at the back of the bubble. We show that injection can only occur when the potential due to electron density build-up in the sheath crossing region [27] at the rear of the bubble exceeds a threshold value
  for which the incoming electrons are captured by the moving bubble. This is compared with experimental observations and numerical simulations using a 3D particle-in-cell (PIC) code.
From Maxwell's equations in the Lorentz gauge together with the quasi-static approximation,  the pseudopotential
  is obtained from
  [32]. The source term,
  comprises the ion charge density,
  and the electron charge and current densities,
  and Jze, respectively. For a completely evacuated bubble the interior contains only stationary ions,
  and is surrounded by a thin dense electron current sheath as schematically shown in figure 1.
We model (see figure 1a) the sheath as a spherical shell of inner radius R and thickness Δ, thus outer radius 
 We assume that all electrons encountered by the front half of the bubble,
  join the sheath, while in the rear half,
  a fraction η of electrons stay in the sheath, while the remaining fraction,
  leave it at a radial position corresponding to where they joined. Furthermore, we assume neutrality in every transverse plane through the bubble. The fraction of electrons remaining in the rear part of the sheath causes an asymmetry between front and rear of the bubble potential. We call this the remnant charge parameter and infer its value from simulations as, approximately,
  where
where  and
and  are the density in, and volume of, the sheath crossing region, respectively and
  is the volume of the bubble. This is observed to be typically below 20%. For
  the potential Ψ converges to zero in the sheath crossing region (see figure 1b), which precludes electron injection when solving the equations of motion for typical values. These assumptions result in
where, for 
 and
and  while for
![${\rho }_{1}={-\rho }_{0}[{R}^{2}-(1-\eta ){\xi }^{2}]/({r}_{{\rm{m}}}^{2}-{R}^{2})$](https://content.cld.iop.org/journals/1367-2630/17/9/093033/revision1/njp519463ieqn67.gif) and
and  for
for 
 If the sheath is closed at the rear and
  the neutrality condition cannot be satisfied for
  This calls for an extension of the model in the region
  which we will not discuss further as it does not affect the potentials for
Assuming that the electric field is dominated by the transverse components, the pseudopotential for the charge distribution (1) is
with 

 and
and 
More sophisticated models, which allow the calculation of a realistic bubble shape and field distribution for an assumed sheath profile, have been developed by Lu et al [32] and Yi et al [33]. While these models are more realistic than ours, they also require more effort to solve the equation for the bubble shape before the fields and electron trajectories can be determined. Our model captures the essential feature of these models, the broken symmetry between front and back of the bubble, by incorporating the observation from PIC codes, also seen in the models of [32, 33], that more electrons remain in the rear half of the sheath than in the front, and quantifies it in terms of a single parameter, η. Reference [33] shows a reduction of the expansion rate required for injection into a wakefield bubble moving at ultra-relativistic speed,  (which precludes injection without expansion). It is plausible that an extension to
  would show injection without expansion, as in our simplified model.
Assuming  (thus
(thus  ) and
) and  [23] we obtain the Hamiltonian equations:


Energy conservation, with H = 1 for initially unperturbed electrons far away from the bubble, implies that to capture electrons there must be a repulsive potential at the back of the bubble that exceeds a threshold value, or critical potential,

where  is a potential offset. Similar considerations, albeit with different initial conditions, were used by Pak et al [29] to determine the threshold for injection induced by ionization inside the bubble. The transverse momentum acquired by the electrons while slowing down at the back of the bubble is
  where the impact parameter rt is the initial distance from the axis. This gives the offset
  If
If  or equivalently
  then
then  which is a sufficient condition for electron injection, as suggested by [25]. However, most current experiments are not in this regime. If the offset is less than 1/2 then injection requires a repulsive (negative) potential. Note that in the case of an evolving bubble,
  corresponds to its rear. The enhanced repulsive potential in the sheath crossing region is due to increased electron density, i.e.
  The bow wave [34] and similar streams from the bubble and the laser pulse in plasma reduce the electron density in the sheath crossing region. The equations of motion (3) have been solved numerically, taking into account variations of the bubble radius where applicable. Figure 3 shows three cases of electron trajectories with their corresponding Hamiltonian and kinetic energy for the case with only build-up (
 ), with only expansion (
 ) and with both expansion and build-up. The inclusion of both these processes results in a negative Hamiltonian after six plasma periods,
  However, in this case injection occurs long before the Hamiltonian becomes negative, which would be the point at which injection is predicted to occur using the injection model of [23].

Figure 3. Analytical model showing electron trajectories in bubble. Sample trajectories (top), corresponding Hamiltonian (middle) and energy (bottom) for: 
 (a);
(a); 
 (b);
(b); 
 (c). Expansion of the bubble persists up to six plasma periods, after which the bubble is frozen. (c) A zoom into the rear of the bubble to provide a more detailed view of the trajectory.
Download figure:
Standard image High-resolution image3. Numerical simulations
To compare with our experimental measurements on the ALPHA-X beamline [8, 13, 14, 18] we have performed a series of 3D simulations using the PIC code OSIRIS [35], (simulations 1 and 2) for a linearly polarized laser pulse with parameters comparable with ALPHA-X beamline: vacuum laser energy 0.9 J in a spot of 25 μm ( radius), pulse length 35 fs and wavelength
  m. In simulation 1 the background plasma density is kept constant at 1019 cm−3 over a length of
  with linear ramps of
  at either end, which is equivalent to 2 mm gas jet, and
  In simulation 2 the background plasma density is kept constant at 1019 cm−3 over a length of
  with linear ramps of
  at either end, and
  The vacuum focus is placed at the start of the constant plasma profile. The simulation box of dimensions
  moves at the speed of light, and is divided into
  cells with
  particles per cell.
The results from simulation 1 are shown in figure 4, which includes a series of snapshots of bubble formation and the evolution of the charge density showing injection, and the corresponding potential with isocontours indicating the critical potential  necessary for injection at the back of the bubble. There is clear evidence of two distinct electron bunches with a clear spatial gap between them and fine structure in each bunch. The contour
  at the rear of the bubble is evident when electron injection occurs.

Figure 4. Simulation 1 results. Snapshots of 3D bubble formation showing charge density (a–d) in the  plane , and (e–h) potential, with isocontours (in light blue) indicating the critical potential
Download figure:
Standard image High-resolution imageFigure 5(a) shows more clearly the evolution of the critical potential  calculated from equation (4), and the potential
  the regions where
  are highlighted. For simplicity, the impact parameter for
  is approximated by the (dynamically updated) bubble radius.

Figure 5. Simulation results for two cases. Evolution of (a) critical potential  see equation (4) (red), the potential
  (blue), and the regions
  (cyan) for electron injection (labelled 1 and 2), (b) initial positions of 10,000 randomly selected injected electrons, (c) bubble half length, (d) bubble expansion rate
  (e) peak vector potential a0, (f) Lorentz factor
  of the back of the bubble, (g) fraction of electrons η in the sheath crossing region, and (h) the phase-space distribution of injected electrons. The length scale is
  .
.
Download figure:
Standard image High-resolution imageFigure 5(b) shows the initial positions of 10,000 randomly selected captured electrons, which should be compared with the highlighted regions 1 and 2 for simulation 1. Simulation 2 shows a single bunch, which also graphically illustrates the condition required for self-injection and the dependence on the peak vector potential a0, the Lorentz factor  of the back of the bubble, and η.
In figures 5(c) and (d) we show the evolution of the bubble length and expansion rate  respectively, to emphasize the weakness or lack of correlation of injection with
  . The phase-space distribution of the injected electron beam indicates a low energy spread and femtosecond bunch structure, which we compare with measurements below. The peak energy range is between 260 MeV (simulation 1) and 100 MeV (simulation 2) depending on the plasma profile and the value of a0. Figure 5(e) shows the evolution of a0; the increase in vector potential to
  is due to nonlinear self-focusing in the underdense plasma ( [36]). Figures 5(f) and (g) show the evolution of
  and η, respectively.
The bunch length in simulation 1 is given by the Lorentz contracted persistence or dwell length  of the highlighted regions in figure 5(a), which is approximately
  ( [37]) corresponding to an rms value of
  (∼1 fs). These self-injected electrons form a high quality beam with rms transverse geometric emittances of
  mm mrad. The rms energy spread of the injected electron beam is 4.8 %, and the slice energy spread is ≈1%–2%. In simulation 2 the rms is
  (∼1.2 fs), the transverse geometric emittances is
  mm mrad and the rms energy spread is 16%.
Simulation 1 (figure 5) highlights the origin of multiple electron bunches, with femtosecond temporal gaps, in a single bubble, which reflects the periodic injection and termination arising from the fluctuating potential and threshold. To corroborate our OSIRIS simulations we have also performed simulations using the WAKE [38] code and observe excellent agreement between the two. The longitudinal profile of the electron beam, in simulation 1 (see figure 5(h)), is characterized by two bunches with a gap of approximately 0.6 μm (2 fs), which correspond to electrons injected into the same bubble at different times. Such multiple/single electron bunches have been observed in experiments measuring CTR, as discussed below.
4. Experimental results
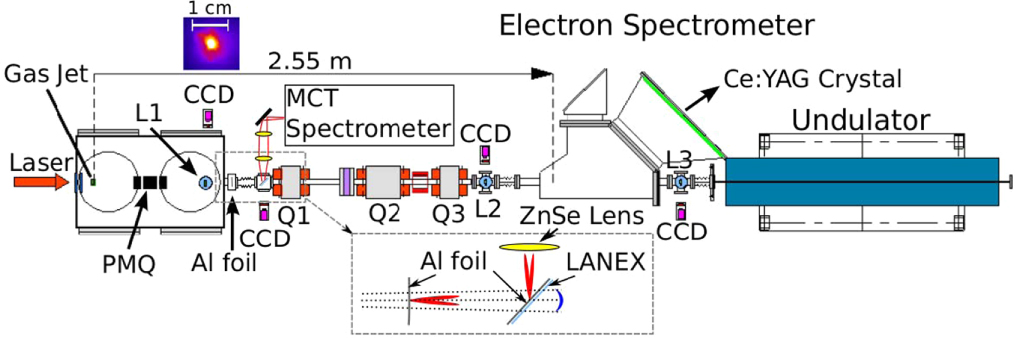
The predictions of the injection model are compared with experimental measurements of the bunch structure carried out on the ALPHA-X beam line [8], shown in figure 6, by measuring CTR [39] emitted from the electron bunches as they traverse two thin foils placed 84 cm and 1 m from the LWFA. Pulses from a Ti:sapphire laser with 35 fs duration, 800 nm wavelength and 0.9 J on-target energy are focused to a 25 μm ( radius) vacuum spot size providing an intensity of
  W cm−2, corresponding to a normalized vector potential
  After interaction with a 2 mm supersonic helium gas jet a plasma with density of 1019 cm−3 is formed. After leaving the accelerator, electron beams are partially collimated by a permanent magnet quadrupole triplet placed 4.5 cm from the gas jet (measured from the centre of the assembly). The gradients of the quadrupoles are 480 , 507 and 480 T m−1, the effective lengths are 1.05, 1.8 and 1.05 cm and the separation is 1.5 cm. After the triplet, electron beams are passed through two Al foils. The first foil, placed 84 cm downstream, is 30–45 μm thick and acts both as a source of CTR and as a laser beam block. A second foil made of a 25 μm thick Mylar pellicle with a 1 μm aluminium coating is placed 16 cm from the first foil at an angle of
  It acts as an additional source of CTR and as a mirror to reflect the radiation to an absolutely calibrated Oriel MS127i spectrometer coupled to a single channel, mercury cadmium telluride infra-red detector. Since the spectrometer is operated as a monochromator, CTR spectra are obtained from the combination of many shots. In order to ensure quality and consistency, the electron beam transverse profile is measured simultaneously with CTR on a charge-calibrated LANEX screen attached to the back of the second foil and imaged with a 12 bit CCD camera. Only on-axis, symmetric beams of similar charge and divergence are used to create the CTR spectra. After the CTR measurements, the foils are removed and the beam is transmitted to an electron spectrometer. In this experiment, electron beams with 90 MeV energy, 5%–10% energy spread, 2 mrad rms divergence and 10 pC charge are typically produced.

Figure 6. Experimental set-up. CTR is generated by two Al foils placed 0.84 and 1 m from the accelerator. The second foil is oriented at a 45 degree angle, sending the CTR to an infrared spectrometer. A LANEX screen mounted on the rear of the second foil is used to monitor the beam profile. Permanent magnetic quadrupoles (PMQ) transport the beam to the foils. Electromagnetic quadrupoles (Q1, Q2 and Q3) transport the beam to the electron spectrometer. Removable LANEX screens (L1, L2 and L3) are used to image the electron beam along the beam line.
Download figure:
Standard image High-resolution imageThe electron beam propagation through the permanent quadrupoles and two-foil system is modelled using GEANT4 [40] for initial normalized emittance of 1 π mm mrad and different energy, energy spread, divergence and bunch length, which are chosen to match the experimental parameters. This allows the particle distribution at the accelerator exit to be compared with the measured CTR spectra. The spectral angular energy distribution of CTR generated by a bunch of N electrons is ![${\rm{d}}{U}_{\mathrm{bunch}}/{\rm{d}}\omega {\rm{d}}{\rm{\Omega }}=\left[N+{N}^{2}f(\omega )\right]{\rm{d}}U/{\rm{d}}\omega {\rm{d}}{\rm{\Omega }},$](https://content.cld.iop.org/journals/1367-2630/17/9/093033/revision1/njp519463ieqn140.gif) where U is the energy emitted by a single electron, Ω is the solid angle and
where U is the energy emitted by a single electron, Ω is the solid angle and  is the form factor, corresponding to the square of the amplitude of the Fourier transform of the particle distribution function
  which approaches unity for wavelengths longer than the bunch length. The spectra are dominated by the strong coherent component, which enables the reconstruction of the temporal profile of the bunch [41]. CTR spectra are calculated numerically and the forward emission from the first foil is added to the backward emission from the second foil with phase difference
  [42, 43], where L is the distance between the two foils and
  is the formation length, with θ the observation angle, λ the radiation wavelength and
  the electron velocity over the speed of light. Simulated CTR spectra produced by a single Gaussian bunch in the two-foil system are shown in figure 7. The technique employed here cannot detect pedestals with long duration superimposed on short bunches. However, a long structure should mostly contain low energy electrons, which are defocused and filtered away by the permanent quadrupoles used for transport (pedestals are not important for FELs).

Figure 7. Simulated CTR spectra produced by a transversely and longitudinally Gaussian electron beam with 100 MeV energy and 10 pC charge. Both the total radiation from the two-foil system ( ) and the contribution from each foil (1, 2) are shown. (a) A bunch with 3% energy spread, 2 mrad divergence and duration at the source of 1 fs (lines) and 3 fs (lines and points). (b) A bunch with 3% energy spread, 1 fs duration and divergence of 2 mrad (lines) and 1.5 mrad (lines and points). (c) A bunch with 2 mrad divergence, 1 fs duration and energy spread of 3% (lines) and 1% (lines and points).
Download figure:
Standard image High-resolution imageTwo CTR spectra have been measured in different runs for different vertical distance between gas jet and laser beam, which introduced slight changes to plasma density and laser amplitude. The spectrum in figure 8(b), obtained for electron energies of 90 ± 15 MeV, is characterized by a peak around 4 μm, a dip around 7 μm and a continuous rise to longer wavelengths. CTR spectra of smooth bunch shapes, e.g. Gaussian, are similar to figure 7 and show little or no structure for the electron energies. On the other hand, a train of two or more bunches can accurately reproduce the observed features. The dip around 7 μm indicates the presence of two bunches separated by  fs after 1 m propagation from the accelerator. The peak at 4 μm requires at least one bunch to have energy spread of 1%–2% or smaller and bunch duration at the accelerator exit of
  fs for 2 mrad rms divergence. The second bunch should have similar duration and energy spread. The ratio of the amplitudes of the two peaks and the depth of the dip is reproduced when one bunch contains about 70% of the charge, for a total of about 10 ± 5 pC, depending on energy, energy spread and divergence. Variations of central energy within the measured 90 ± 15 MeV range have a small effect at long wavelengths, whereas the short wavelength peak shifts from 4.5 μm at 90 MeV to 3.5 μm at 110 MeV, decreasing quickly in amplitude for energies lower than 90 MeV. This behaviour suggests that the short wavelength part of the spectrum has been generated by the most energetic electron beams and therefore theoretical curves in figure 8(b) have been obtained by setting the central energy of two bunches to 100 MeV. The measured spectrum is compatible with the presence of additional ultra-short bunches with short inter-bunch delays and with charge of ∼0.5 pC or smaller. Examples are shown for a train of three bunches all separated by 11.5 ± 0.5 fs (curve 3) and with an additional fourth bunch with a delay of
  fs from the first (curve 4), as shown in the insets to the figures.

Figure 8. Measured and simulated CTR spectra. (a) CTR spectra calculated for simulations 1 and 2 (see figure 5). The insets show the corresponding bunch shapes. Simulation 1 shows a strong peak around 4.5 μm which is a signature of multiple electron bunches with a temporal separation of 2 fs in the accelerator. Simulation 2 shows a CTR spectrum with little structure around 4.5 μm, indicating the presence of a single bunch. The same features have been observed in experimental spectra (b) and (c), which are best reproduced by electron bunches with parameters chosen to match the measured energy and energy spread. However, the most important parameter is the temporal separation between the electron bunches. (b) A spectrum compatible with an electron bunch containing at least two short bunches separated by  fs after 1 m propagation from the accelerator. Three matching theoretical spectra are shown: (2) corresponds to two 100 MeV bunches separated by 11.5 ± 0.5 fs and with energy spread of 1%, charge of 8 and 3 pC and bunch length at the accelerator exit of 0.9 fs; (3) contains an additional 90 MeV bunch separated by 22 ± 2 fs from the first structure, 6% energy spread, 1.8 fs pulse duration and 0.5 pC charge; (4) contains a fourth bunch separated by 45 ± 1 fs from the first bunch, 3% energy spread, 1.8 fs pulse duration and 0.5 pC charge. (c) A spectrum compatible with a single electron bunch. Three matching theoretical spectra are shown: (1) corresponds to a 90 MeV, 12 pC electron beam with 1.5 fs bunch duration at the accelerator exit and 6% energy spread; (2) contains an additional 90 MeV, 0.9 fs, 0.5 pC bunch with energy spread of 3% and separation of 55 fs; (3) contains a third 90 MeV, 0.9 fs, 0.5 pC bunch in-between the first two with a delay of 10 fs. All bunches have 2 mrad rms divergence. Insets show the corresponding electron bunch shapes.
Download figure:
Standard image High-resolution image
Figure 8(c) shows a second measured spectrum produced by 89 ± 7 MeV electron beams accelerated with the laser 1 mm further away from the gas jet, decreasing the plasma density by approximately 10%. It shows no prominent structure, has a much more uniform increase at long wavelengths and possibly small modulations at short wavelengths. This different shape can be reproduced by a single bunch with 12 ± 4 pC charge,  fs bunch duration at the accelerator exit and 6 ± 1% energy spread. It is also compatible with the presence of additional short bunches with charge less than ∼0.5 pC and variable delay.
Figure 8(a) shows the calculated CTR spectrum from simulation 1 indicating a strong peak around 4.5μm due to multiple electron bunches with temporal separation of 2 fs, and from simulation 2 where there is no peak, which indicates the presence of a single bunch. The electron beam energy measured in the experiment is lower than that of simulation 1 (figure 5(h), left) for the experimental parameters, but comparable to simulation 2 (figure 5(h) right). The peak energy in the simulations is between 260 (simulation 1) to 100 MeV (simulation 2) due to variation in plasma profile and a slight change in a0. The energy of the electron beam strongly depends on where injection occurs in the gas jet and also the distance over which acceleration occurs, i.e., whether dephasing is reached or not. Injection close to threshold depends strongly on the plasma (density, length, ramps etc), and laser parameters (pulse length, focal spot size and position, chirp etc). Slight variations in these parameters can alter the point of injection and thus the final energy of injected electron beam.
CTR measurements have been performed at a distance of approximately 1 m from the accelerator, therefore the sub-structure delays obtained experimentally depend both on the initial separation at the accelerator exit (the gas jet) and on the electron bunch energy. After propagation over a distance D, two bunches initially displaced longitudinally by  and with slightly different mean energy E0 and
  (with
(with  ) will become separated by
  A positive (negative)
  corresponds to the higher (lower) energy bunch initially in front. For
  and D = 1 m,
  or
or  The ∼10 fs delay obtained experimentally for the spectrum of figure 8(b) indicates a separation at the accelerator exit of
  For an energy difference up to 10 MeV, which is compatible with the measured energy spectra, the separation at the accelerator exit is in the range of 0.5–3 μm (1.5–9 fs) if high energy electrons are travelling in front or 3–5.5 μm if high energy electrons are at the back. A 0.5–3 μm (1.5–9 fs) separation is compatible with the observation of multiple bunches within the same bubble, which is also observed in simulation 1, where high energy electrons are at the front and the spacing is about 0.6 μm (2 fs). Additional bunches with longer delays are consistent with electrons accelerated both in the first and second bubble. However, this case of injection of significant charge into subsequent bubbles is incompatible with the measured spectra.
5. Conclusions
In conclusion, we report CTR electron bunch length measurements from a LWFA driven by a single laser beam for two different experimental conditions, observing 1–2 fs structure containing ∼10 pC of charge, resulting in 1–10 kA peak currents. In one case a train of at least two bunches separated by less than 3 μm at the accelerator exit is observed. This is compatible with our theoretical model for near-threshold injection discussed above, supported by 3D PIC simulations of electron self-injection resulting in electron bunches with femtosecond scale micro-structure. The self-injection mechanism requires a threshold repulsive potential, which is facilitated through electron density build-up in the sheath crossing region at the rear of the bubble. If the condition for the threshold potential is no longer met then injection terminates. Periodic occurrences of injection followed by termination leads to a train of ultra-short bunches. The bunch length of the injected electrons is determined by the persistence (dwell) length over which the repulsive potential in the sheath crossing region remains at or above the critical potential. Our study highlights the importance of density variation in the sheath crossing region for determining the bunch structure, dark current, emittance, energy spread etc.
Our theoretical model enables an understanding of the near-threshold injection mechanism in the LWFA for typical experimental parameters that lead to high quality femtosecond duration electron bunches being produced. More complicated ionization injection [29] and two-beam injection schemes using multiple laser beams [44] have been demonstrated, the latter leading to multiple injection in subsequent bubbles [17, 45]. However, in the cases where injection occurs very close to threshold, it is necessary to include the effect of density build-up at the back of the bubble to properly understand the electron bunch structure. Injection close to threshold is very sensitive to laser and plasma parameters: very small changes can lead to a transition from a single to multiple bunches. Therefore, to investigate control of electron beam properties from shot to shot requires very stable lasers.
Acknowledgments
We gratefully acknowledge the support of the UK EPSRC (grant no. EP/J018171/1), the EU FP7 programmes: the Extreme Light Infrastructure (ELI) project, the Laserlab-Europe (no. 284464), and the EUCARD-2 project (no. 312453). The authors would also like to thank the OSIRIS consortium (UCLA/IST) for the use of OSIRIS, and TM Antonsen, P Mora and SY Kalmykov for the WAKE code. The authors are grateful to the Faculty of Engineering at the University of Strathclyde, for access to the High Performance Computer cluster. The data associated with this research is available at doi: http://dx.doi.org/10.15129/b5697435-7651-4333-b00e-2ed2e072eb6a.