


Abstract
Recent years have witnessed a growing interest in analyzing a variety of socio-economic phenomena using methods from statistical and nonlinear physics. We study a class of complex systems arising from economics, the lowest unique bid auction (LUBA) systems, which is a recently emerged class of online auction game systems. Through analyzing large, empirical data sets of LUBA, we identify a general feature of the bid price distribution: an inverted J-shaped function with exponential decay in the large bid price region. To account for the distribution, we propose a multi-agent model in which each agent bids stochastically in the field of winner's attractiveness, and develop a theoretical framework to obtain analytic solutions of the model based on mean field analysis. The theory produces bid-price distributions that are in excellent agreement with those from the real data. Our model and theory capture the essential features of human behaviors in the competitive environment as exemplified by LUBA, and may provide significant quantitative insights into complex socio-economic phenomena.
Export citation and abstract BibTeX RIS
1. Introduction
In recent years, theories and methods of statistical and nonlinear physics have been used to understand a variety of complex social and economical phenomena [1–10]. For example, stochastic acceleration was used to model the interacting forces between pedestrians and walls to gain significant insights into panic and crowding behaviors [2], the classical Ising spin model was adopted to describe the decision making processes in a closed community [3], and the radiation model without artificial parameters was used to predict the mobility patterns of migration processes among states in the US [4]. Also, the basic mechanism of emergence of wealth distribution can be understood using the analogy of energy transfer in particle collision [5]. In the financial market, models of stochastic processes such as random walk and lévy flies were often studied [6].
In statistical physics, properties of the macroscopic quantities are obtained from the behaviors of a large number of microscopic particles. In complex social and economical systems, certain macroscopic quantities can be measured, leading to large scale, empirical data sets. To probe into the complex dynamics of such systems, an effective approach is then to construct 'microscopic' models to describe the dynamical behaviors of individuals or agents, with the goal to predict macroscopic behaviors [9]. Agreement between the model prediction and real data can be taken as a plausible indication that the model correctly captures the essential dynamics of the underlying system. Guided by this basic principle from statistical physics, in this paper we study a class of complex economical systems: online auction systems for which a large amount of empirical data is available. Specifically, we focus on a modern form of auctions, called the lowest unique bid auction (LUBA). Different from the traditional auctions (e.g., English and Dutch auctions), LUBA allows the winners to gain expensive items at a considerably low entrance fee [11], provoking individuals to participate in the 'game' enthusiastically. A basic quantity to characterize the dynamics of any auction process is the bid distribution. In LUBA, similar to the 'lowest unique positive integer game' (LUPI) [12, 13], the player who offers the lowest unique bid wins the game.
There is a difference between LUBA and LUPI. That is, LUPI is free to join, which accepts only integer numbers in bidding, but LUBA requires an entrance fee and the winner is required to pay a bid price to obtain an item. However, players in both LUBA and LUPI are faced with the same essential strategic conflict: preferring lower bid price while trying to avoid overcrowded bid price [13]. Similar bid distributions were observed from empirical data of both LUBA and LUPI [12–15].
To understand the basic mechanism for the bid distributions in LUBA and LUPI processes, a number of mathematical models based on Nash equilibrium (NE) were proposed [12, 14–17]. For example, the two extreme cases of LUPI in which all players behave rationally or randomly [12] were analyzed, and the optimal strategy for rational bidding was identified. A framework of symmetric mixed-strategy equilibrium was proposed to study LUBA, and the equilibrium solution was numerically obtained through the theory of non-stationary Markov chains [14]. Also, it was suggested that the symmetric NE with the lowest expected gain should be optimal among symmetric strategies [15]. The uncertainties about the number of players was assumed to obey the Poisson distribution and a NE model was then proposed based on the assumption that the expected payoff is independent of the bid prices [16]. Quite recently, a model assuming that players prefer to bid the price for higher probability of winning was proposed [17]. To summarize briefly, most previous quantitative works were based on NE, assuming that perfect information is available for all players. However, in realistic situations, the decision making of players would inevitably be based on partial or imperfect information. In fact, significant deviations from the NE have been observed recently from real data [18].
Intuitively, the interactions among agents in a complex social-economical systems bear certain resemblance to many-body interactions in statistical physics. Multi-agent models formulated in this spirit have proven to be able to generate more accurate characterization of real social-economical systems [19]. In such a model, each agent acts according to its current state, the surrounding environment, and certain rules governing its behavior. The basic principle is familiar in statistical physics: searching for and analyzing the emergence of macroscopic patterns from local, 'microscopic' nonlinear interactions among agents [9]. In general, multi-agent models can be used to study a wide range of microscopic nonlinear interactions in socio-economic systems by reproducing and providing reasonable understanding of emergence of a rich variety of empirically observed phenomena at the global level [2, 3, 7, 19, 20]. This provides the main motivation for our present work: to construct a multi-agent model to simulate the complex auction systems and to develop a statistical-physics based analysis to understand the behaviors of 'macroscopic' quantities, in particular the empirically observed bid price distributions.
Our main results and their significance are the following. We first analyze two large online auction data sets. We find that, in spite of the apparent differences between the circumstances in which the data sets were generated, such as those in currency requirements and participants, the qualitative features of the bid distributions are essentially identical. This implies that the systems under the LUBA rule that the player who makes the lowest bid among unique ones wins the game, have the ability to self-organize to generate a stable bid price distribution that is likely to be universal. We then construct a multi-agent game model based on the LUBA rule, in which agents make decision in the field of winner's attractiveness. Simulations of the model reproduce the empirically observed bid distributions. To pin down the dynamical mechanisms for the bid distributions, we develop a mean field theory. Through a self-consistency analysis, the theory yields bid distributions that are in excellent agreement with those from both empirical data and our multi-agent model. The outcomes of our statistical-physics inspired model are more accurate than those from any existing mathematical models of auction systems, providing deeper insights into the fundamental dynamics underlying complex auction systems in a modern society.
2. Data source, bid distribution characters and model
2.1. Data collection and process
The data sets used in this paper were downloaded from two websites: www.auction-air.com and www.uniquebidhomes.com. The auctions on the two websites were performed in British Pounds and US Dollars, respectively. Moreover, the minimum unit of bid price on the first website is one Pound, while the second website requires the minimum unit to be cent. The historical information of the auctions recorded on these websites includes two categories: (1) general information such as the value V of the item, entry fee c, minimum bid price  , number N of bids (or participants), and (2) the bid price k offered by each participant and the winner's bid
  .
.
To be as general as possible, we chose six different types of items varying from mobile phone to digital camera of different values V. For each item, the auction was performed for R rounds. The corresponding six data sets are labeled as (a)–(f), respectively, and the related information is listed in table 1, where (a)–(d) are from the first website and (e), (f) are from the second.
Table 1. Basic parameters of the six online auction data sets studied in this paper.
| Data sets | Value (V) | #Bid (N) | #Rounds (R) |
|---|---|---|---|
| (a) | 300 | 98 ± 3 | 7 |
| (b) | 499 | 135 | 19 |
| (c) | 2000 | 193 ± 7 8 | |
| (d) | 699 | 199 | 16 |
| (e) | 199 | 160 ± 10 | 3 |
| (f) | 1000 | 310 | 6 |
The value V of the items, the total bid number N in each round of game, and the number of rounds R for the auction performed.
2.2. Bid price distributions
Due to the various sources of randomness involved in the decision making process, the bids offered by different agents participating in the same LUBA will in general be different. If the number of agents is statistically significant, the bid price can effectively be regarded as a random variable, with its probability distribution depending on the game setting/parameters. Figure 1 shows the bid distributions, denoted by fk, obtained from six data sets of LUBAs (black bars).
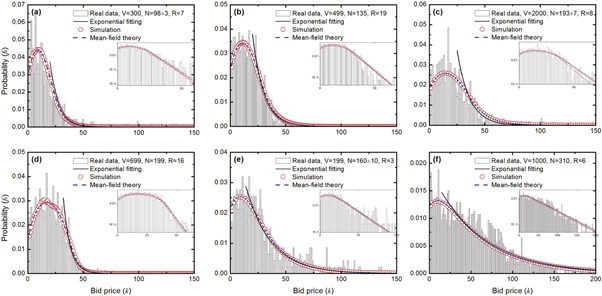
Figure 1. Distributions of bid prices from real data. Distributions from six real data sets (black bars) and exponential fittings to the tails of the distributions (black solid curves). The estimated exponential fitting indices in (a)–(f) are  , 0.10, 0.09, 0.16, 0.04, and 0.02, respectively. Also shown for comparison are the distributions from simulation of our multi-agent model (red open circles) and the corresponding predictions from the mean-field self-consistent equations (blue dashed curves). The subplots are in liner-logarithm coordinates.
Download figure:
Standard image High-resolution imageIn spite of the fluctuations caused by the finite number of bids, the distributions exhibit some general features that are independent of the particular details of the games such as the actual item values and the number of participants in the auctions. Interestingly, the lowest bid is not selected with the highest probability, and all distributions exhibit an inverted J-shaped curves, i.e., the bid probability increases non-monotonously for small bid price, reaches maximum for some medium bid price, and decays to zero in the large price region. For example, in the data sets (a), (e), (f), the most probable bid price is £ 7, $0.17, and $0.11, respectively. For the data sets (b), (c), (d), the most probable bid price is about £17.
Intuitively, the inverted J-shaped distribution can be attributed to users' efforts to bid less but to avoid biding the same as others [13], as driven by the rule that the lowest unique bid wins. Each participant thus seeks to bid at price as low as possible, so a bid originally regarded as low by some agent may in fact not be 'low' enough to win the game, as the bid prices offered by some other agents could be lower. As a result, the collective behaviors of the agents tend to self-organize into a non-monotonous distribution as exemplified in figure 1. The exponential decay of the probability in the large bid price region is in fact a general feature induced by the LUBA rule [16]. The tail region of each distribution can be well fit by the exponential function  , represented by the black solid curves in figure 1, where the values of the exponential parameter a for the data sets are listed in table 2.
Table 2. Fitting parameters in the bid distributions from the six data sets.
| Data sets | p (std.) | KS | R2 |

|

|
|---|---|---|---|---|---|
| (a) | 0.046 (0.013) | 0.059 | 0.895 | 0.13 | 0.136 |
| (b) | 0.034 (0.007) | 0.029 | 0.963 | 0.10 | 0.100 |
| (c) | 0.025 (0.004) | 0.045 | 0.903 | 0.09 | 0.089 |
| (d) | 0.058 (0.012) | 0.030 | 0.943 | 0.16 | 0.170 |
| (e) | 0.015 (0.001) | 0.038 | 0.912 | 0.04 | 0.045 |
| (f) | 0.006 (0.001) | 0.055 | 0.904 | 0.02 | 0.018 |
The attracting probability p is obtained through the minimum KS value in fitting the model generated with real bid distributions. The coefficient of determination R2, and the KS coefficient are listed. The exponent  is obtained from fitting with the tail region of the real bid distributions, and the exponent
  as a function of p is obtained analytically.
2.3. Model of LUBA dynamics
In spite of some subtle differences, the online settings of LUBAs (or LUPIs) that determine the game outcomes are the following. (1) The value V of an item and the target maximum number of bids, N, are known to all agents, where N is the total number of players if each bids once. (2) The bid price, denoted by k, is discrete and constrained within the interval ![$[\underline{k},\bar{k}]$](https://content.cld.iop.org/journals/1367-2630/17/9/093003/revision1/njp518507ieqn9.gif) , where
, where  . (3) The outcome of the game is calculated when all N bids are placed, and the participant who makes the lowest bid among the distinct ones (denoted by
  ) wins the game. Additionally, a constant entry fee c is required for each bid (
 ), which is identical for all players and thus will not affect the outcome of the game. Assuming that each participant bids once in each round of the game, we have that the payoff of the exclusive winner is
  (with the bid
  subtracted off), while all the other participants get the identical payoff
  . The rational upper bound of bid price k is
  , ensuring positive payoff for the winner.
Our construction of a computational model for the LUBA auction process benefits from the fact that a host of social and economical behaviors can be described by the minority game model [21–37], a multi-agent model characterizing a population of selfish individuals competing for limited common resources. The similarity between LUBA auction process and those described by the minority game model suggests strongly the suitability of using multi-agent models to understand the LUBA auction dynamics. Without loss of generality, we discuss the case where the bid interval is normalized to unity and each agent adapts his/her bid k step by step in the discrete space of bid price. Our model is schematically shown in figure 2, with the following detailed setting: the auction is performed iteratively and, in each round, the agent who bids the lowest unique  wins the game. Each of the N agents acts based on the historical information with probability p (which we name as the attracting probability), or acts without any information with the probability
  . In the former case, the winner's bid
  in the last round forms a field that attracts the agents towards
  , i.e., agents adapt their bid towards the last
  for one bid unit. In particular, those with bid
  choose
  , the agents with
  bid
bid  , and the winner simply keeps his/her bid. In the latter case, agents bid randomly by simply keeping the bid k in the last round, or moving one bit unit away from it (i.e., choosing
  , k, or
  with equal probability). The zero-flux boundary condition is adopted in the bid space
 ![$[1,V-c]$](https://content.cld.iop.org/journals/1367-2630/17/9/093003/revision1/njp518507ieqn28.gif) at the left hand side, subject to the requirement of positive bids. At the right hand side, the boundary condition is that the payoff of the winning agent must be positive. In simulations, the auction process is conducted iteratively to yield a stable bid distribution.
at the left hand side, subject to the requirement of positive bids. At the right hand side, the boundary condition is that the payoff of the winning agent must be positive. In simulations, the auction process is conducted iteratively to yield a stable bid distribution.
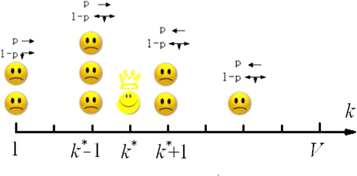
Figure 2. Schematic illustration of agent interaction patterns in our proposed multi-agent model for LUBA auction dynamics. During the auction process each agent either adapts his/her bid towards the winner's bid  with probability p or move randomly with the probability
  in the discrete bid space.
Download figure:
Standard image High-resolution imageThe bid distributions obtained from simulations of our multi-agent model are also plotted in figure 1 (red open circles), where the number of agents N is the same as the number of participants recorded in the LUBA data, and the attracting probability p is chosen to best fit the real bid distribution. Table 2 lists the values of the parameter p obtained from the minimum Kolmogorov–Smirnov (KS) test for fitting the real data sets. The corresponding KS coefficients denoted by KS, and the coefficient of determination denoted by R2, are also listed for reference. The remarkable agreement between the model generated and real bid distributions indicates that the processes articulated in our model capture the main dynamics of LUBA systems. In addition, we observe that small values of p lead to the best fit. From the perspective of multi-agent interactions, this implies that the observed inverted J-shaped bid distributions are result of small movements of participants to adapt their bid towards the previous winning bid  .
.
The three parameters in our multi-agent model are the value of item V, the number of agent N, and the attracting probability p. The respective effects of these parameters on the auction dynamics are illustrated in figure 3. The parameter V represents the upper bound for rational bids in the real cases and in our model, which is rarely observed due to the auction rule that the 'lowest unique bid wins.' As shown in figure 3(a), the value V has little influence on the bid distribution. In contrast, the parameters N and p both play a significant role in the emergence of the bid distribution. As N is increased, the location of the peak of the distribution, i.e., the most probable bid price, moves rightward and the height of the peak is reduced, as shown in figure 3(b) where, the variance of the bid is enhanced accordingly. We see that larger values of p give rise to a more concentrated bid price distribution with higher peak and narrower width. Distinct from the effects of N, the most probable bid price changes in a relatively small region of p.

Figure 3. Stable bid distributions for different parameters. The stable bid distributions are obtained from simulation for the systems with different (a) item value V, (b) number of agents N, and (c) values of the attracting probability p.
Download figure:
Standard image High-resolution image3. Mean-field analysis and evidence of exponential decay in bid distribution
3.1. Self-consistency equation in the mean-field framework
The stable bid distribution fk can be regarded as the probability for each agent to bid at k. Suppose that the number N of participants and the bid probability distribution fk are known. We can calculate the probability wk for one given bid k to win the auction, i.e., the lowest unique bid  . The quantity wk denotes the distribution function of the winning price. In contrast, since the winner's bid
  attracts all other participants, the winning probability distribution wk provides effectively a mean field with respect to which all the agents adapt their bids. That is, wk determines, probabilistically, the new bid distribution fk. The new fk will again result in an updated wk. These observations suggest that the approach of self-consistency in the mean-field framework can be used to analyze the dynamical process of online auction.
Our detailed analysis of the iterative, self-consistent process between fk and wk is as follows. Firstly, for a given bid distribution fk, we calculate the winning probability distribution wk. The simplest case is  , i.e., there is only one single bid at k = 1. The probability for this case is

where f1 is the probability for each player to bid at k = 1, and  is the number of potential agents who may bid at 1.
The case of  is critical for the analysis, which is slightly more complicated. In particular, the agents bidding at 1 unit will be excluded from the number of potential players who may bid at 2 units (denoted by n2). We have, on average,
  . The probability for
  is then


where  is the renormalized bid probability:
  , which is the probability of bidding 2 for all the agents except those who bid 1. For larger
  values, those agents who bid lower prices are excluded gradually. We have

where the number of potential agents to bid at k is  and the renormalized bid probability is
  . For a given bid distribution fk, the winning probability distribution wk can be uniquely determined from equation (4).
We next consider the process to determine the bid distribution fk in the field created by a given winning probability distribution wk. In our multi-agent model, agents move their bids one unit towards the winning bid  . Given wk, without specific knowledge of
  , the winner's influence can be regarded as probabilistic, since each agent makes decision in the mean field determined by wk. Specifically, each agent decreases (or increases) its bid by one unit with probability
  (or
(or  ), or keep his/her original bid with probability
  . The quantities
  ,
,  , and
, and  are the probabilities that the winner is located on the left side of k, is exactly at k, and is on the right side of k, respectively. That is, these probabilities are for the cases where the winning price
  is less than, equal to, or larger than k, respectively. We have
  . In our model, the two probable actions of each agent are attraction towards the winner's bid with probability p, and random adoption of its bid with probability
  , which correspond to drift and diffusion in a Markov stochastic process, respectively. The corresponding transition matrix can be written as
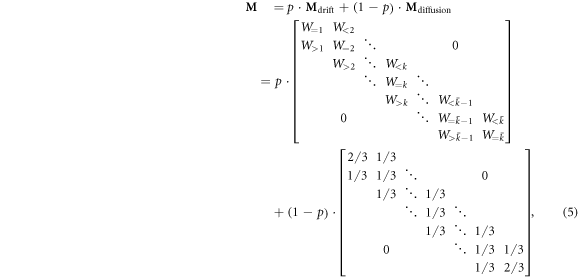
where both  and
and  are tridiagonal matrices, and the elements of
  are determined by the winning probability distribution wk. According to the ergodic theorem of Markov chain [38], every irreducible Markov chain of finite states is ergodic and admits a unique stationary distribution. The stable state fk can then be obtained from the iterative operation of
  until the following condition is met:

We see that equations (4)–(6) represent a self-consistency equation set, which can be solved iteratively. Figure 1 shows the stable distribution fk obtained from the self-consistency equations (the blue dashed curves labeled as 'mean-field theory'), with the same parameters N and p as in the simulations. We observe a good agreement between the stable fk from the self-consistency equations and those from direct model simulations (red open circles) and from the real data (black bars). Take, for example, the data sets (a) and (f) in figure 1. Figure 4 shows the stable wk and fk distributions obtained from the self-consistency equations, and the inserts show the corresponding probabilities  ,
,  and
and  versus k. Through extensive simulations, we find that the winning probability distribution wk has two main features: monotonic decreasing trend and bimodal distribution, as shown in figure 4.

Figure 4. Stable bid price distributions obtained from self-consistency equation. The winning probability distribution wk (red solid curves) and the bid distribution fk (blue bars) corresponding to the two typical data sets ((a) and (f)). The two inserts show the accumulated distribution  (black solid triangles) or
  (blue open triangles), which correspond to the probability that the winner is located on the left-hand side or the right-hand side of k. The probability for the winner to be located at k (denoted by
  in the inserts) is wk.
Download figure:
Standard image High-resolution image3.2. Exponential decay of bid distribution
Comparing the predicted bid distribution fk to the real data, we see that our model successfully reproduces the whole curve of fk, insofar as the value of p is chosen properly (as listed in table 2). Especially, both the non-monotonous feature in the small k region and the exponential decay in the large k region are predicted. Here we demonstrate that, in our model, the exponential decay of the bid distribution fk can be calculated analytically based on the concept of detailed balance.
For a large arbitrary bid price k, majority bids of the winner's bid price  appear on its left-hand side. For the action towards
  for certain value of the attracting probability p, the agents bidding about k tend to reduce their bids. If the action is random with probability
  , an agent chooses a nearby bid, leading to a chance to increase their bids. A stable bid distribution fk implies a detailed balance, i.e., the probability of flowing out of k is equilibrated by that into k. The corresponding equation can be written as

We have

The solution of equation (8) subject to the constrain  is the exponential function
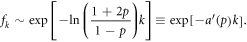
Table 2 shows the corresponding analytical result of the exponent  for each data set, with the parameter p satisfying the the best fitting of fk from multi-agent simulation (red circles in figure 1) with the whole curve of fk from real data (black bars in figure 1). A remarkable result is that the exponent a' with the best fitted p is approximately equal to the exponent
  obtained directly from the exponential fitting (black solid curves in figure 1) to the tails of fk from real data. This means that, our multi-agent model is self-consistent in predicting the local decaying feature of fk in the large k region and in predicting the whole curve of fk, both being associated with the same value of parameter p.
4. Analysis of another data set
The data sets analyzed so far are relatively brief, from which the players cannot be identified in different rounds of the game. In order to get the empirical evidence for the attractiveness of the winner's bid, we analyze another data set of LUBA, which recorded information about the individual agents. The data set was obtained from http://homes.soic.indiana.edu/filiradi/Data/lub/_data.tgz, uploaded by Radicchi etc, which they analyzed in their paper entitled 'rationality, irrationality and escalating behavior in LUBA' [11]. In this paper, it was mentioned that the bid of each player changes, but the issue of whether the changes are toward the winner's bid was not discussed. Our analysis of this data set yielded the following results. (For convenience, we label the data set as UBH, since its original website is www.uniquebidhomes.com.)
The original data recorded games with different numbers of participants and items of various values. We obtained data consisting of 17 rounds of game, where the item value is 50 000 cents. The number of players varies from 125 to 420 (with mean value 259). The total number of bids is 5018. The maximum and minimum bids are 1423 cents and 1 cent, respectively.
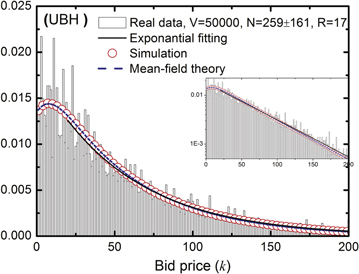
As shown in figure 5, the bid distribution of this empirical data set exhibits similar features to those from the data set in our previous version, e.g., the inverted J-shaped and exponential decaying tail. Furthermore, the results from our multi-agent model and from the mean-field analysis agree well with these from UBH data set.
Figure 5. Distributions of bid prices from an additional real data set, simulation and our theory. Distributions from the UBH data set (black bars) and exponential fits to the tails of the distributions (black solid curves). The estimated exponential fitting index is  . Also shown for comparison are the distributions from simulation of our multi-agent model (red open circles) and the corresponding predictions from the mean-field self-consistent equations (blue dashed curves). The subplot is in liner-logarithmic coordinate, which indicates that the distributions have an exponential tail.
Download figure:
Standard image High-resolution image
The parameters such as the attracting probability p, the exponent a' as a function of p, and the exponent  obtained from the fitting are listed in table 3. It can be seen that the values of a' and
  are quite close to each other, demonstrating the suitability of our model for the new empirical data.
Table 3. Fitting parameters in the bid distributions from the data set UBH.
| Data set | p | KS | R2 |

|

|
|---|---|---|---|---|---|
| UBH | 0.0062 | 0.0158 | 0.9490 | 0.0174 | 0.0185 |
We identified players in different game rounds and obtained the changes in the agents' bid prices with respect to the last winning bid. There are 167 records altogether. Table 4 lists the records of some typical participants.
Table 4. Samples of bid price for typical participants in UBH.
| Agent | Last | Last | Current | Direction |
|---|---|---|---|---|
| ID | bid | winning bid | bid | to last winner |
| 367 | 84 | 16 | 84 | Staying |
| 367 | 84 | 35 | 184 | Departing |
| 367 | 184 | 129 | 19 | Approaching |
| 367 | 19 | 83 | 76 | Approaching |
| 371 | 37.33 | 83 | 98 | Approaching |
| 371 | 98 | 44 | 30.67 | Approaching |
| 373 | 57 | 129 | 53.67 | Departing |
| 376 | 24.17 | 129 | 29.62 | Aapproaching |
Through statistical analysis, we find that in 88 (or  ) records the bid price moves towards the last winning price (approaching), while in 75 (or
  ) records, it moves in the opposite direction (departing). There are 4 (or
  ) records that the bid price did not change (staying). The probability of moving towards winner is larger than that associated with departing, which is also indicated by the positive attracting probability p of the winning bid obtained from our model.
For the case of p = 0.0062 listed in table 3, we simulate the biased random walk process, in which each walker moves to the right-hand side with the probability  = 0.33747 (i.e., the probability to move to the last winning bid in our model), to the left-hand side with probability 0.33127 (i.e.,
  ), or to stay at the current position with probability 0.33127. Initially, 200 000 walkers are located at 0. The process continues until the fraction of walkers at 0 decreases to
  , which is the actual value from the UBH data. We then obtain the fractions of walkers positioned on the right-hand side of 0, at 0, and on the left-hand side of 0 with probabilities
  ,
,  and
and  , respectively, which are approximately the same as the corresponding probabilities obtained from real data.
In real social systems, learning from the winners is one of the most straightforward strategy for individuals, which is also a common and ubiquitous behavior observed in population dynamics of competitive species. It is thus natural that players in the LUBA game try to learn from the winners, i.e., attracted towards the winning bids. The analysis and simulation results from the UBH example provide further evidence that this learning mechanism captures the main feature of the LUBA systems.
5. Conclusions
Online auctions represent an important type of socio-economical activities in the modern world. This is a typical example of complex dynamical systems, in which a large number of individuals interacting with each other by taking the action of bid in order to gain the maximum payoff. A basic quantity underlying the auction process is the distribution of bid price, which exhibits a general, inverted J-shaped type of functional form from various empirical data sets. There have been recent efforts, mainly based on the concept of NE, to understand the dynamical mechanisms leading to the distribution and to predict its mathematical form [12, 14–17].
The motivation of our work came from the observation that complex dynamical process of online auction bears certain similarity to minority game dynamics, a class of relatively well studied, multi-agent evolutionary game dynamics [21–29, 31–33] that have proven capable of providing great insights into a variety of social and economical processes. Our idea is then to construct a multi-agent game model with the aim to better predict the empirically observed bid price distributions. Using six real data sets of LUBA auction process to determine a minimal number of fitting parameters, we demonstrate that a mean field analysis of our model can generate distributions that agree well with those from the real data. Remarkably, our analysis identifies the attracting probability as a key parameter underlying the dynamics of complex auction systems. With respect to comparison with the real data, our analytically predicted bid price distributions are more accurate than previously achieved. Our work represents an interdisciplinary approach, using methods from complex dynamical systems and statistical physics, to understanding the dynamical processes underlying modern social and economical systems.
In addition, the behaviors of the players in a real auction game can be affected by various types of factors such as historical information, personal characteristics, and psychological activities. It is quite challenging to design a model capable of exactly matching the empirical data in all details. The main objective of our study is to develop a model that can accurately predict the inverted J-shape bid distribution observed from empirical data so as to elucidate the dynamical mechanism for the bid distribution. More specifically, our model focuses on the tendency in bidding towards the winning bid, which was proven to give rise to the essential mechanism for the J-shape bid distribution. The effect of diversified bid amounts that each player adjusts at each step remains to be an interesting topic to be explored.
Acknowledgments
We are grateful to Ms Yinan Zhao for providing the data and to Yuzhong Chen and Cancan Zhou for discussions and suggestions. This work was supported by ARO under Grant No. W911NF-14-1-0504 and by NSFC under Grants Nos. 11275003 and 61174165. The visit of QC to Arizona State University was partially sponsored by the State Scholarship Fund of China.