


Abstract
We analyze the mechanical properties of three epithelial/mesenchymal cell lines (MCF-10A, MDA-MB-231, MDA-MB-436) that exhibit a shift in E-, N- and P-cadherin levels characteristic of an epithelial−mesenchymal transition associated with processes such as metastasis, to quantify the role of cell cohesion in cell sorting and compartmentalization. We develop a unique set of methods to measure cell–cell adhesiveness, cell stiffness and cell shapes, and compare the results to predictions from cell sorting in mixtures of cell populations. We find that the final sorted state is extremely robust among all three cell lines independent of epithelial or mesenchymal state, suggesting that cell sorting may play an important role in organization and boundary formation in tumours. We find that surface densities of adhesive molecules do not correlate with measured cell–cell adhesion, but do correlate with cell shapes, cell stiffness and the rate at which cells sort, in accordance with an extended version of the differential adhesion hypothesis (DAH). Surprisingly, the DAH does not correctly predict the final sorted state. This suggests that these tissues are not behaving as immiscible fluids, and that dynamical effects such as directional motility, friction and jamming may play an important role in tissue compartmentalization across the epithelial−mesenchymal transition.
Export citation and abstract BibTeX RIS
1. Introduction and background
Spatial separation of distinct cell populations via the formation and maintenance of compartment boundaries is a vital process in all higher organisms. For example, cellular compartments that emerge during early embryonic development are precursors for complex tissue structures with distinct mechanics and function. Information about spatial lineage is preserved; cells are restricted to their original compartment throughout the entire life of an organism [1–3]. Tissues originating from different compartments actively maintain their lineage boundaries and re-establish them when they are disturbed [4, 5]. Sharp compartment boundaries can even exist without a basement membrane separating the tissues.
Another example of tissue compartmentalization is found in tumour spreading and metastasis. It has been observed that cancer cells of cervical carcinoma are confined, even after an early break through the basement membrane, by compartment boundaries until a very late stage of tumour development [6]. Moreover, a successful new surgical method called total mesometrial resection is based on morphogenetic compartment theory. Detailed studies show that when a tumour is removed along with tissues in the same morphogenetic compartment but without broaching compartment boundaries, patients exhibit improved survival rates compared to standard surgery with a tumour boundary defined by optical inspection [7, 8], corroborating the important role of compartment boundaries for cancer progression. However, metastatic tumours eventually transgress even the strong lineage boundaries, invading adjacent tissues. Therefore, a question of immediate practical importance is what changes allow metastatic cells to break through these boundaries, or conversely, what prevents non-metastatic tumour cells from leaving the compartment? Moreover, it is a fundamental question if a solid tumour behaves sufficiently like a fluid that surface tension-like effects hold cancer cells back at the tumour boundary.
Metastasis has been attributed to tumour cells losing epithelial characteristics and acquiring a more migratory mesenchymal phenotype [9–11]. This change known as the epithelial−mesenchymal transition (EMT) is typically accompanied by a loss of specific types of cellular adhesion. While epithelial cells are closely connected via various types of cell junctions such as adherens junctions and desmosomes that allow them to form organized cell layers in vivo and cell clusters in vitro, mesenchymal cells are less constrained, contacting only through focal points [11]. During EMT, the expression of E-cadherin decreases while the expression of N-cadherin and other cadherins increases [12–14]. This might be the molecular origin for the change in adhesiveness, although recent work highlights that different cadherins play vastly different roles in regulating intercellular forces and adhesion [15]. In addition, EMT also causes a down-regulation of the keratin cytoskeleton and a replacement with vimentin [16], which also hinders desmosome formation. This leads to secondary effects that modulate cell–cell adhesion. However, it remains unclear how these processes interact with boundary formation and compartment maintenance.
Inspired by the fact that two immiscible fluids spontaneously segregate, a common method to study cell segregation and boundary formation is an in vitro cell sorting experiment, where two distinct populations of suspended cells are mixed together in cell culture medium and imaged over time. If both cell populations originate from the same compartment, cells typically remain intermixed in the final aggregates. In contrast, mixtures of cells from different compartments or cell lineages eventually segregate into different domains. There are two typical outcomes, depending on the mixing ratio, cell type and culture conditions. In some cases, one cell population coalesces into smaller clusters embedded inside the other cell population. In other cases, one population forms a single cluster partially or fully enveloped by the other population [17–21]. In both cases, cells tend to maximize the amount of surface area in contact with similar cells, while minimizing area in contact with other cells or exposed to the surrounding medium [22].
This observation has been explained by the differential adhesion hypothesis (DAH), first developed by Malcolm Steinberg [4, 17–20, 23]. This hypothesis suggests that tissues behave as immiscible Newtonian fluids, where each tissue has a macroscopic tissue surface tension σ (TST) that drives coarsening and segregation. Steinberg further hypothesized that, just as in molecular fluids, TST arises from cohesive and adhesive forces between building blocks (cells in case of tissues), and that these mechanical interactions drive cells towards a configuration that minimizes the total free energy in the system. Thus, the DAH predicts that cells with higher adhesiveness will have a higher TST and should be enveloped by those with lower adhesiveness. To test the link between cell sorting and TST, Steinberg and collaborators developed a tissue surface tensiometer [24] to directly measures the TST of cellular aggregates of a single tissue type, and demonstrated that cell sorting experiments for different cell lineages extracted from chick embryos [20] proceeded exactly as predicted by their TSTs. Furthermore, additional experiments confirmed that the measured TST was directly proportional to cadherin expression in individual cells [25, 26]. Detailed theoretical analysis affirmed that adhesion alone could be indeed the driving force in cell sorting [27].
Although a correlation between TST and cell sorting is generally accepted, the molecular origin of TST is still strongly debated. The differential surface contraction hypothesis (DSCH) first proposed by Albert Harris [22] suggests that TST is governed by actomyosin contractility instead of adhesive interactions. An extension of this work by G Wayne Brodland [28] also includes cohesive interactions, but similarly concludes that 'the strengths of the cohesions are irrelevant' for predicting TST and sorting hierarchies. In both formulations, cells that are more contractile have a lower TST, an idea which is supported by experiments involving cells from gastrulating zebrafish embryos [29].
These apparent contradictions are resolved by several recent experiments focusing on shapes of pairs and triplets of cells. These works suggest that adhesion and cortical tension are co-regulated: while adhesion mechanically couples the cell cortices at contacts, downregulation of cortical tension (downstream of cadherin interactions at contacting interfaces) permits expansion of the contact area [30, 31]. This reduction in cortical tension acts as an effective adhesion, explaining why TST scales with cadherin expression and yet is proportional to measured cortical tensions [32]. In addition, the same balance of forces that generates cell shapes in doublets and triplets can be extended to cellular aggregates, suggesting that cell shapes at the surface of aggregates are directly related to TST [33].
Taken together, these two sets of recent results suggest that the downregulation of cortical tension along contacting interfaces leads to a strong polarization of cell mechanical properties along a boundary between tissue types [32]. If adhesive interactions between two distinct cell types are rare or misregulated, then the interfaces between them will have much larger cortical tensions than elsewhere in the co-culture. This 'extended DAH' provides a very simple explanation for the formation of compartment boundaries and supracellular actomyosin cables in tissues.
Although the 'extended DAH' is a powerful organizing principle, it makes two major assumptions that have not been carefully tested and may be particularly problematic in mesenchymal or cancer cells: (i) tissues are liquid-like and therefore the system can ergodically sample many configurations until it finds the minimum free energy states, and (ii) kinematic effects (such as active cell motility and cell shape fluctuations) are nevertheless sufficiently small and isotropic so that the system dynamics are governed by a free energy that is dominated by mechanical interactions between cells.
Recent theoretical and experimental work calls both assumptions into question: it has been shown that many tissues exhibit a rigidity or jamming transition where small changes to single-cell properties can cause the entire tissue to transition from a liquid-like to a solid-like state or vice versa [34–38]. In addition, recent computational and theoretical studies predict that even differences in cell motility could be sufficient to drive cell segregation [39–41].
Therefore, the goal of this manuscript is to determine whether the 'extended DAH' can explain cell sorting and boundary formation in epithelial and mesenchymal cancer cell lines. So far, most attempts to verify the DAH have been indirect, measuring either the surface tension [20, 21, 24, 25] and/or inferring from cadherin levels [21, 25]. Direct measurements of cell–cell adhesiveness and correlation with segregation experiments are rare [29]. Here, we develop several new techniques to study multiple aspects of the DAH simultaneously: we directly quantify and compare adhesion molecule expression, forces required to separate cell–cell contacts, cell shapes in three-dimensional aggregates of a single cell type, cell sorting dynamics between two different tissue types and the sorting hierarchy of the final sorted states. We perform these tests on three cell lines varying in epithelial/mesenchymal character. Together, this will provide a clear picture of which aspects of the 'extended DAH' apply through EMT.
2. Results
In this manuscript, we study three cell lines that represent changes from epithelial to mesenchymal properties. They are frequently used as model systems for in vitro studies in tumour research [42–46] and included in important breast cancer cell panels (e.g. ATCC 30-4500K): the epithelial MCF-10A and the mesenchymal MDA-MB-231 and MDA-MB-436, see section 4.1.
2.1. Cadherin surface densities do not correlate with short-time cell–cell adhesive forces
Cadherin densities were measured with molecular resolution using stimulated emission depletion (STED) microscopy (see methods section 4.2). An example illustrating the increased image resolution of STED is shown in figure 1. The determined surface densities of the three individual cadherin types presented in figure 2(a) are well within the range of densities found for other cells with methods like quantitative flow cytometry or AFM surface scanning [25, 47]. Our data show a qualitative difference in cell line specific contribution of E-, N- and P-cadherin, mirroring the typical characteristics of an EMT. For the MCF-10A cell line, the main contribution to the overall cadherin density is the high amount of E-cadherins, indicating an epithelial phenotype, while for the MDA-MB-231 and MDA-MB-436 cell lines N- and P-cadherins are more dominant, indicating a more mesenchymal state.
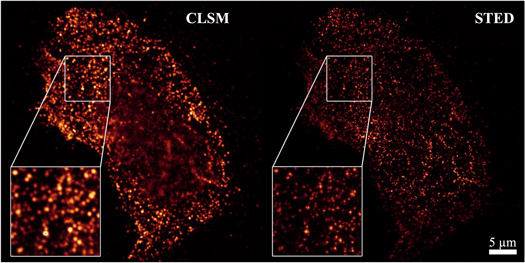
Figure 1. Comparison of the image resolution of conventional confocal laser scanning microscopy (CLSM) and stimulated emission depletion (STED) microscopy by the example of an adherent MDA-MB-231 cell stained for N-cadherins. Only the STED image was used for image analysis of the cadherin surface density as it clearly shows more and sharper details.
Download figure:
Standard image High-resolution image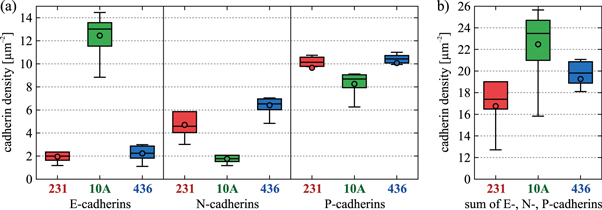
Figure 2. (a) Box-plot of the surface densities of E-, N- and P-cadherins for MDA-MB-231 (red), MCF-10A (green) and MDA-MB-436 cell lines (blue). (b) Pooled cadherin densities estimating the overall surface densities. The circle denotes the mean value, the horizontal line within the box denotes the median and whiskers denote the farthest data point still within 1.5 times the interquartile range.
Download figure:
Standard image High-resolution imageMoreover, a switch of cadherin types is often assumed to be characteristic when normal cells become cancerous [9, 11–14]. We observe a loss in E-cadherins and a modest increase in N-cadherins between the non-malignant MCF-10A cells and the breast cancer cell lines MDA-MB-231 and MDA-MB-436, while P-cadherin levels remain quite similar between all three cell lines. Although all of them are sometimes classified epithelial, the two cancer cell lines are obtained from pleural effusions, thus stemming from cells that have undergone EMT. Moreover, the cancer cell lines behave highly invasive in Boyden chamber essays [44].
Unfortunately, it is not clear a priori how each cadherin type contributes to the mechanical force required to separate cells. One approach would be to study only E-cadherins which are often assumed to dominate the interaction. However, recent results contradict the often voiced assumption that E-cadherin mediated contacts are particularly strong [48]. Previously reported cross-type cadherin binding [25, 49, 50] with binding strengths close to self-type binding [4, 51] motivates the assumption that all three types may contribute equally to the total energy of binding. The summation of all E-, N- and P-cadherins per surface area for each cell type is shown in figure 2(b). MCF-10A has the highest density with (23.5 ± 1.5) μm−2, followed by MDA-MB-436 with (19.8 ± 1.1) μm−2 and MDA-MB-231 with (17.4 ± 1.2) μm−2. If adhesiveness is, in fact, proportional to the total number of cadherins at the interface, our measurements predicts that MCF-10A should have the highest adhesiveness, while MDA-MB-231 should have the lowest. If TST is also proportional to the total density of cadherins, these data suggest  .
.
Next, we used the AFM-based CellHesion technique to measure the maximum effective adhesion between cell pairs for the three cell lines, i.e. the forces required for cell separation (see figure 3(a) and methods section 4.3). Since the contact area between the cells cannot be precisely determined, it is not possible to normalize the measured unbinding forces (see supplementary section S.1). Nevertheless, simple evaluations are sufficient to estimate when cellular size or stiffness effects dominate over changes in adhesive strength. The calculation of an adhesive surface energy is also problematic since cell detachment is more like a highly nonlinear rupture event. Figure 3(b) summarizes the measured maximum cell adhesion forces. Unlike the conventional dogma, it is not the normal epithelial MCF-10A cell line that adheres the strongest. With (976 ± 290) pN, MDA-MB-231 cells show the highest adhesion force, approximately twice as high as that of MCF-10A cells with (508 ± 62) pN. MDA-MB-436 cells have the lowest adhesiveness, only a quarter of that of MDA-MB-231 cells, with (257 ± 109) pN (mean ± STD). The cell–cell contacts strengthen with contact time, which makes the differences in maximum cell adhesion force even more pronounced (see figure 4). This ripening phase seems to level off after about 90 s.

Figure 3. (a) A typical force–distance curve recorded with the CellHesion AFM technique when two cells are brought into contact (1. blue approach segment), kept in contact for 5 s (2. red pause segment) and subsequently separated again (3. green retraction segment). The scale bar of corresponding side-view images is 20 μm. The minimum of the retract segment corresponds to the maximum adhesion force. (b) Box-plot of the maximum adhesion forces, i.e. detachment forces, between cell pairs for the three cell lines for a contact time of 5 s. The total number of cells measured is 16 for MDA-MB-231, 45 for MCF-10A and 43 for MDA-MB-436. The circle denotes the mean value, the horizontal line within the box denotes the median and whiskers denote the farthest data point still within 1.5 times the interquartile range.
Download figure:
Standard image High-resolution image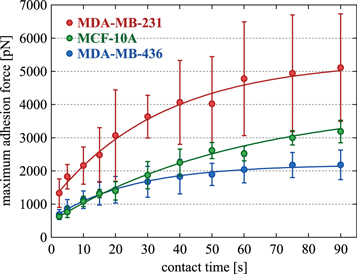
Figure 4. Plot of the maximum adhesion forces, i.e. detachment forces, between cell pairs for the three cell lines, depending on the contact time. For each cell line, five different cell pairs where used. Each cell pair was measured five times for each contact time. The contact times for each cell pair were scattered to avoid systematic errors. The circles denote the mean value and the error bars indicate 95% confidence interval.
Download figure:
Standard image High-resolution imageSince desmosomes form very slowly [52–54], the investigated cadherin types should be mostly responsible for the cell–cell contact on the time scale of the AFM experiments. In that light, the AFM results are quite surprising, as they demonstrate that the force required to separate cells is not proportional to the density of cadherins at interfaces. Even assuming that one of the cadherin types might be the main contributor to cell–cell adhesion, neither the distribution of E-, N- or P-cadherins fits our AFM adhesion data. For instance, E-E-cadherin bonds are reported to be stronger as the N-N-cadherin bonds [49, 55], but this cannot resolve the discrepancy.
One explanation for the discrepancy is that mechanical properties of cells other than adhesion or cell size are affecting the AFM measurement. For example, softer cells permit deeper indentation and correspondingly larger surface area in contact, resulting in a larger measured adhesiveness. In supplementary sections S.1 and S.2, we discuss several measurements of cell stiffness and cell contact area, which were used to estimate the adhesive force per unit contact area. However, we find that these effects are not sufficient to change the ordering of cell–cell adhesiveness among the three cell lines studied.
A second explanation is that different cadherin molecules regulate different spatiotemporal aspects of adhesion. For example, it has recently been shown that P-cadherin densities predict the overall magnitudes of intercellular forces while E-cadherin densities affect the rates at which these forces build up [15]. In this case, we might expect the relationship between adhesion and cadherin density to depend sensitively on the ratios between cadherin molecule densities and the time scale of the adhesion measurement.
A third possible explanation for the discrepancy is a difference in the spatial organization or regulation of cadherin molecules. Cadherins are able to nonlinearly alter adhesion by clustering [56], independent of contributions either from cytoskeletal or cytoplasmic interactions [57]. Unfortunately, it is not known how adhesion forces scale with cluster size, so we are unable to investigate this hypothesis quantitatively. Therefore, this represents a plausible but unverified distinction between different tissue types.
A related explanation is that cadherins primarily act as signalling molecules that down-regulate cortical tension over long timescales [30, 32, 33]. If this explanation is correct, we would expect cell shapes and TST to correlate strongly with cadherin expression but not with cell adhesion measurements. In contrast, if short time cell–cell adhesion does correlate with TST (as suggested by the original version of the DAH), our data would indicate  .
.
2.2. Cell shapes in aggregates correlate with cadherin expression and cortical tension but not with adhesion
We first imaged liquid-overlay cultures of homogeneous cell suspensions for each of the three cell types. As shown in figure 5, all three cell lines do form aggregates, which is a bit unanticipated given that MDA-MB-231 and MDA-MB-436 cells exhibit mesenchymal features. However, the aggregates differ qualitatively. While the MCF-10A cells form compact aggregates with a smooth, rounded, fluid-like surface, the MDA-MB-436 and MDA-MB-231 aggregates are increasingly less compact and display rough surfaces, where individual cells sit on the surface like sand grains. MDA-MB-231 aggregates are even less compact than MDA-MB-436, with branches, protrusions and even holes. It is important to note that any fluid-like droplet must have smooth, continuously rounded surfaces; therefore these observed macroscopic shapes already demonstrate that these aggregates are not acting as Newtonian fluids. Instead, the surface is more reminiscent of dense colloidal clusters or complex yield-stress fluids. This strongly suggests that cell activity and kinetics (as opposed to passive mechanical properties) are playing an important role.

Figure 5. Confocal fluorescence images of spheroids of (a) MDA-MB-231, (b) MCF-10A and (c) MDA-MB-436 cells whose membranes were stained with CellMask deep red plasma membrane stain (Cat.No. C10046, Molecular Probes/Life Technologies). Images are pseudo-coloured. In most cases only a few outer cell layers were stained, depending on the package density of cells within a spheroid. However, this was sufficient to measure the contact angle θ between the cell–medium interface and a vector tangent to the surface of the aggregate (see figure 6).
Download figure:
Standard image High-resolution imageNevertheless, we can study the mechanical forces acting on each cell and compare them to predictions of the DSCH and the regular as well as the extended DAH. The DSCH suggests that TST is governed by cortical tension. For cells described as an active fluid, a stiffer cell translates into a higher cortical tension and consequentially in a high TST, while softer cells have a lower cortical tension and lower TST. As discussed in supplementary section S.2, we used an optical cell stretcher to quantify cells' compliance. We find that MCF-10A cells are slightly stiffer than MDA-MB-436 cells, and both are significantly stiffer than MDA-MB-231 cells (see supplementary figure S.5). Because this stiffness correlates with cell cortical tensions, the DSCH would predict  .
.
As discussed in [32, 33], the extended DAH suggests that cell shapes at the boundary of an aggregate are determined by a balance between the effective tension on contacting and non-contacting interfaces, and should correctly account for downregulation of cortical tension due to adhesion molecule signalling at interfaces. Qualitatively, this means that for cell types with large numbers of adhesion molecules, cells at the surface share significant contact interfaces with neighbours and a nearly flat interface with the cell culture medium, as we have found for MCF-10A. In contrast, surface cells on MDA-MB-436 and MDA-MB-231 aggregates are much more rounded and share very little contact with other surface cells. MDA-MB-231 cells are clearly more loosely bound to the surface than the other two cell lines, if contact area is a measure how strongly the cells stick to the surface.
To quantitatively test the extended DAH, we analyzed the contact angle θ between the curved cell-medium interface for each cell and a vector tangent to the macroscopic curvature of the aggregate, see figure 6(a). The contact angles were determined manually from the fluorescence pictures of the cell aggregates. The results are highlighted in figure 6(b): the angles are (41 ± 36)° for the MDA-MB-231 (N = 68), (22 ± 12)° for the MCF-10A (N = 36) and (32 ± 11)° for the MDA-MB-436 (N = 40). This suggests that the mean values of the contact angles are mostly insensitive to the clearly visible surface roughening. The loss of the smooth surface for the mesenchymal cells becomes obvious when looking at the measured values for the variance which considerably increases for the MDA-MB-231 cells.
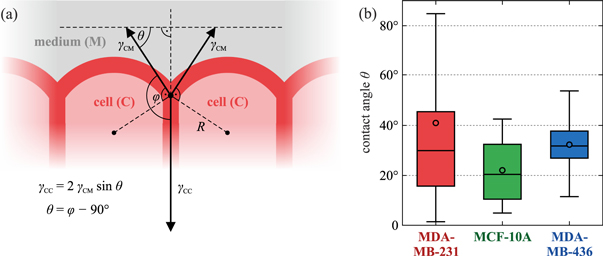
Figure 6. (a) Cortical tensions γCM at the cell–medium and γCC at the cell–cell interfaces determine the cell shape at the aggregate surface at steady state. The contact angle θ results from the balance of forces. We define the contact angle θ between the curved cell–medium interface and a vector tangent to the macroscopic curvature of the aggregate. In practice, identifying the tangent vector can be difficult, so we measured the angle φ between the cell–medium interface and the interface between neighbouring surface cells. (b) Box-plot of the contact angles θ for the three cell lines (see figure 5). Assuming a normal distribution, the average values and standard deviations are (41 ± 36)° for the MDA-MB-231 (N = 68), (22 ± 12)° for the MCF-10A (N = 36) and (32 ± 11)° for the MDA-MB-436 (N = 40). These standard deviations describe the spreading of the distribution of the different contact angles θi (i = 1, ..., N) for N different cells along the cluster periphery. Apart from that, each angle θi was measured 5 times (and averaged) to get an estimate for the human measurement error. Based on this error, a 95% confidence interval for the overall average contact angle was calculated, with its half widths being approximately 3° for all three cell lines.
Download figure:
Standard image High-resolution imageFor cell–cell contacts near the surface, the cell shape and simple force balance can be used to calculate the local tension as an estimate for the TST. As discussed in supplementary section S.3, the contact angles together with the data for the cortical tension can be used to predict  which correlates perfectly with overall cadherin levels, but not with AFM adhesion data.
2.3. Final state for cell sorting experiments is not consistent with other measures
We performed cell sorting experiments with all three possible combinations of two cell lines. (The method is illustrated in figure 7 and described in detail in section 4.5.) Our first observation is that 50:50 mixtures of cells (with about 2000 cells total) do, in fact, segregate. In all cases, an inner 'core' was formed by one cell type, surrounded by an outer 'shell' of the other cell type. A clear hierarchy was reliably reproduced in all experiments with the three cell lines: MDA-MB-231 envelops MCF-10A, which in turn envelops MDA-MB-436. Figure 8 shows the segregation processes after approximately 20 h, which is still an intermediate time point. As seen in figure 8(b), there are occasionally smaller satellite clusters that have not yet fused to the main cluster. For longer observation times, these clusters will eventually fuse, forming a single cell type phase embedded in the other cell type. This robust segregation behaviour was not necessarily expected because all cell lines originate from the same developmental compartment (mammary gland). This suggests that segregation is a universal process, and importantly, that even cells that underwent EMT, such as MDA-MB-231 and MDA-MB-436, can spontaneously segregate.

Figure 7. (a) Traditional setup for hanging droplet cultures. A small droplet of cell suspension is applied to the hydrophobic surface of the lid of a plastic Petri dish. Note that this setup is not suitable for long-term observation as the amount of nutrients is very limited inside the small droplet and optimal ambient conditions (e.g. heating and CO2 supply) cannot be ensured over longer times without drying the droplet (despite any liquid reservoir). (b) New setup for forming cell spheroids, suitable for long-term observations on inverted micoscopes. Hemispheric cavities have been moulded in a 2%(w/v) agar gel using a stamping technique. The agar gel prevents cell attachment, thus allowing cells to interact with each other in 3D, comparably to the situation in a hanging droplet.
Download figure:
Standard image High-resolution image
Figure 8. CLSM sections of 3D segregation experiments with the three mixing combinations of MCF-10A, MDA-MB-231 and MDA-MB-436 cell lines approximately 20 h after mixing. During the long-term observation, samples were maintained at 37 °C in 5% CO2 air atmosphere. The segregation into an inner core surrounded by an outer shell is clearly visible in all three mixtures: (a) MDA-MB-231 (red) encloses MCF-10A (green). (b) MDA-MB-231 (red) encloses MDA-MB-436 (blue). (c) MCF-10A (green) encloses MDA-MB-436 (blue). The scale bar applies to all images.
Download figure:
Standard image High-resolution imageNot surprisingly, if one cell type makes up less than 50% of the mixture then there is not a high enough density to generate a single main cluster [58]. Additional experiments with mixing ratios of 70:30 and 60:40 generated final states where small clusters of the minority are embedded in a spheroid of the majority type, and so we focus on 50:50 mixtures for the remainder of this manuscript.
According to both the DSCH and the extended DAH, the tissue with the highest surface energy should always sort to the interior, while the tissue with the lowest energy should sort to the exterior. If this is true, the cell sorting order would indicate  However, this is not consistent with predictions based on either the cadherin density (
 cortical tension (
 or surface cell shapes (
 or with predictions based on cell–cell detachment force (
 ).
).
Initially, this observation was very surprising, as previous experiments confirm that embryonic tissues sort according to these mechanical properties associated with surface energy [21, 36]. However, embryonic tissues behave like Newtonian fluids, while our observations demonstrate that our three cell lines undergoing EMT are not behaving as simple liquids. Because DSCH, regular DAH and extended DAH are all based on the assumption that tissues are liquids on long time scales (and therefore kinetic traps and cell activity can be neglected), it is not surprising that they fail.
2.4. Segregation dynamics does not match final sorted state
In order to test whether cell activity and dynamics play an important role in cell sorting, we analyze and quantify the temporal evolution of coarsening and segregation in our sorting experiments. Figures 9–11 show consecutive still images illustrating the typical domain coarsening we observe during cell sorting. In the beginning, cells sediment to the bottom of the moulded spherical cavity and then start to form connected regions. The clusters of the same cell type grow in size and fuse with one another. Gradually, they form one large cluster of an inner core and an outer shell. Time-lapse videos of the segregations can be found in the supplementary material. Using these videos, we quantify the length scale Lm associated with these domains as it evolves in time (see methods section 4.6). The temporal evolution of Lm for all three cell line combinations is plotted in figure 12. A theory for Newtonian fluids developed by Siggia [59] and extended to tissues by Beysens et al [60] predicts that the rate at which domains coalesce is linear in time; we fit the linear regime in each plot in figure 12 to estimate the domain coalescence rate m. We find that  .
.
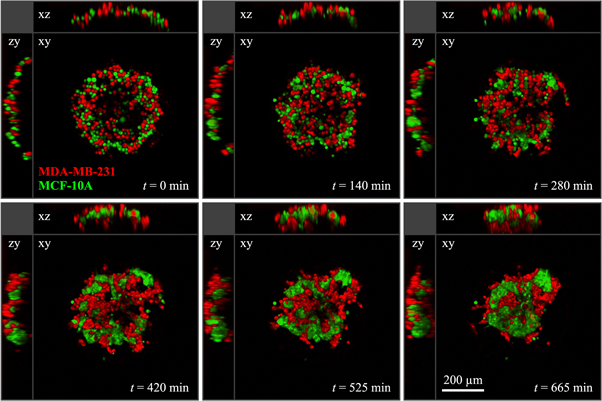
Figure 9. Multiphoton fluorescence microscopy sections at different time points of a 3D segregation experiment with a mixture of MDA-MB-231 (red) and MCF-10A (green) cells. During the whole experiment the sample was kept at 37 °C in a 5% CO2 air atmosphere. The xy-plane of each time-step is the central section of the 3D image stack, the xz- and zy-planes are cuts through the middle of the xy plane. At t = 0 min, the spherical shape of the non-adhesive cavity the cells are confined to is clearly visible in the xz- and zy-planes.
Download figure:
Standard image High-resolution image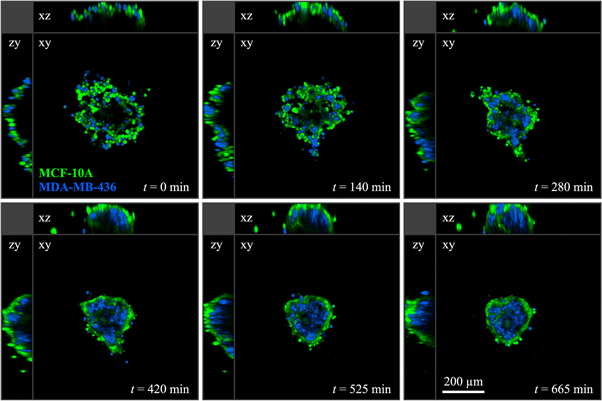
Figure 10. Multiphoton fluorescence microscopy sections at different time points of a 3D segregation experiment with a mixture of MCF-10A (green) and MDA-MB-436 (blue) cells. During the whole experiment the sample was kept at 37 °C in a 5% CO2 air atmosphere.
Download figure:
Standard image High-resolution image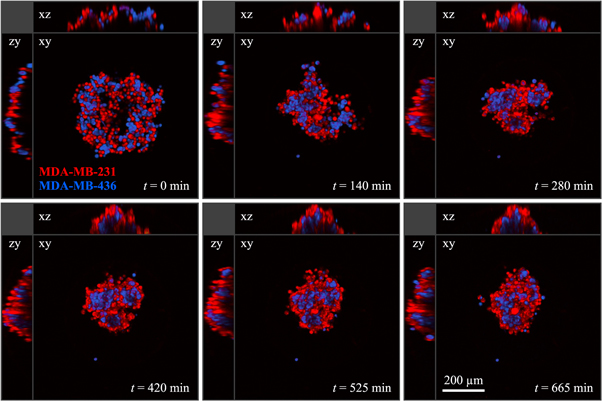
Figure 11. Multiphoton fluorescence microscopy sections at different time points of a 3D segregation experiment with a mixture of MDA-MB-231 (red) and MDA-MB-436 (blue) cells. During the whole experiment the sample was kept at 37 °C in a 5% CO2 air atmosphere.
Download figure:
Standard image High-resolution image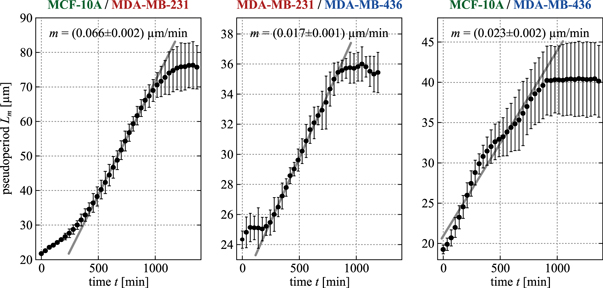
Figure 12. For all three mixtures shown, the pseudo period Lm corresponding to the average cluster radius of one cell population was determined by a 3D auto-correlation approach of the binarized image stack of the cell type forming the inner core. Error bars indicate the standard deviation of at least three separate segregation experiments with approximately 1000 cells of each cell type. The slope m of the linear part of the curve corresponds to the coalescence rate of the mixture. The errors of the fitted values denote 95% confidence interval.
Download figure:
Standard image High-resolution image
According to Newtonian fluid theory, cell mixtures with greater surface tension differences should have domains that coalesce faster (see supplementary section S.4). In combination with TST values concluded from the final sorted states ( see figure 8), this generates a testable prediction for the domain coalescent rates:
Obviously, this prediction does not fit to the coalescence rates m determined from the pseudo period data as the two mixtures containing MCF-10A cells have higher slopes m than the mixture containing no MCF-10A cells. This discrepancy again indicates that our epithelial cell lines are not behaving like a mixture of two fluids.
We can also use the TST predictions from our other measurements to make predictions for domain coalescence rates, as shown in the last column of table 1.
Table 1. Summary of the predictions for the tissue surface tension σ and coalescence rate m resulting from our different measurements. The order of m can be concluded from the order of σ among the three cell types according to Newtonian fluid theory that predicts that cell mixtures with greater difference of σ should coalesce faster.
| Predicted tissue surface tension σ: | Predicted coalescence rate m: | |||||
|---|---|---|---|---|---|---|
| Criteria | low |

|
high | low |

|
high |
| Cadherin density | 231 | 436 | 10A | 10A/436 | 10A/231 | |
| (STED) | ||||||
| Cell–cell adhesion forces | 436 | 10A | 231 | 10A/231 | 231/436 | |
| (AFM) | ||||||
| Cellular stiffness | 231 | 436 | 10A | 10A/436 | 10A/231 | |
| (optical stretcher) | ||||||
| Cell shapes and cell–medium | 231 | 436 | 10A | 10A/436 | 10A/231 | |
| interfacial tension | ||||||
| Sorting hierarchy | 231 | 10A | 436 | 10A/436 | 231/436 | |
| (segregation experiments) | (outside) | (inside) | ||||
| Pseudo periods | 231/436 | 10A/436 | 10A/231 | |||
| (segregation dynamics) | ||||||
3. Discussion and conclusion
We analyze three breast cell lines that exhibit a shift in cadherin levels characteristic of an EMT associated with increased invasiveness, in order to understand the role of mechanics in cell sorting and compartmentalization in collections of cancer cells. Existing theories developed for embryonic tissues, such as the extended DAH, consider cell clusters as Newtonian fluids and ignore cell activity and dynamics. They predict that cell sorting is entirely governed by passive mechanical properties. To test this hypothesis, we have developed an entire suite of methods to quantify cellular adhesiveness, stiffness and cell shapes for each cell type, and compare that to predictions for cell sorting in mixtures of cell populations.
One of our major conclusions is that cell sorting is very robust in these epithelial cell lines, even though two of them exhibit mesenchymal characteristics. This suggests that cell sorting could be an important factor in defining a tumour boundary or confining cancer cells to a primary tumour.
A second conclusion is that short-time measurements of cell adhesion are not correlated with the density of the examined cadherins at cell–cell interfaces. Even though these cadherin types should be predominantly responsible for forming cell–cell contacts on short-time scales, as the formation of desmosomes is much slower [52–54]. This suggests that either adhesion molecule dynamics (such as clustering [56, 57] or temporal evolution [15]) strongly affect the adhesion, or that energies associated with cadherin–cadherin binding are smaller and different from those associated with other mechanical effects downstream of cadherin signalling pathways, i.e. adhesion molecule membrane localization and cortical tension are strongly co-regulated. Moreover, none of our results support the conventional assumption that the transition from E-cadherins in epithelial cells to N- and P-cadherins in mesenchymal cells results in a loss of adhesive strength. To the contrary, the strongest cell–cell junctions are formed by MDA-MB-231 cells, which are highly invasive mesenchymal cells. An important direction for future work is to better characterize the roles played by different cadherin molecules in regulating intercellular adhesive forces and cortical tension.
A third conclusion is that there is significant agreement between existing theories (DAH, extended DAH, DSCH) on several TST predictions. The first two columns of table 1 use existing theories (the pertinent theory is listed in parentheses) to translate cadherin density (extended DAH), cell adhesiveness (DAH), cell stiffness (DSCH), cell shapes (extended DAH) and final sorted state (all theories) into predictions for the ordering of TST among the three cell lines. The last column uses a theory for Newtonian fluids to translate that ordering into a prediction for the rates of domain coalescence. These results show that cadherin density, cell stiffness and cell shapes all agree on the ordering of TST, and also agree with the observed rate of domain coalescence. This is encouraging, as all of these theories are based on minimizing the free energy and treating tissues as fluids.
However, none of these existing theories correctly predict the final sorted state for these cell lines that undergo EMT. This suggests that our cell lines are not ending up in the minimum free energy state as determined under the assumption of a fluid behaviour. This conclusion is further supported by the observation that aggregates of our mesenchymal cell types have rough surfaces that are not rounded, but instead individual cells become visible like sand grains. Both of these observations can be explained if cells are not exploring the mechanical landscape randomly and ergodically, as in a fluid. If instead cell motion is strongly oriented (so that cells move in the same direction over a long period of time), then the final shape and the segregation dynamics could be dominated by differences in those kinetic properties instead of the passive mechanical differences [39–41, 61]. Alternatively, if cells are nearly jammed (i.e. the collection of cells is 'frozen', nearly rigid like a solid), then cells cannot explore the landscape and it is possible for the aggregate to have a rough shape. Finally, it could be that dynamic processes such as cell traction (contributing to both locomotion and drag) significantly alter the static mechanical energies, which is not taken into account in existing theories.
Of course, these observations do not mean we should abandon the extended DAH for all tissues: these theories do seem to work well for embryonic tissues. However, it does strongly suggest that to understand compartmentalization and boundary formation in tumours, we must study the dynamics much more carefully. For example, it would be useful to perform fusion experiments [21, 36] to quantify whether these tissues behave as Newtonian fluids, and if so, to quantify their viscosities. In addition, it would be incredibly beneficial to develop cell tracking capabilities for these 3D aggregates, and to analyze individual cell trajectories to quantify caging behaviour (associated with jamming) and oriented cell motion.
The primary focus for understanding cancer cell invasion has been on changes to processes inside individual cells. For the stability of tumour boundaries, it is crucial to understand whether the cancer cell collective behaves like a solid or a liquid. Over the past two years, however, there has been growing speculation that EMT also changes the collective mechanical properties of a tissue [62, 63]. This is punctuated by our recent work indicating that the changes to cell mechanics and cell shapes associated with EMT may coincide with a global liquid-to-solid, or unjamming transition, in the entire tissue [37, 38]. On the solid side of the jamming transition, cells are able to jiggle around but retain the same neighbours, while on the fluid side, cells are able to rearrange and intercalate. This suggests a paradigm-shifting hypothesis that cell jamming regulated by material properties could be a key determinant of local cancer cell invasion.
4. Material and methods
4.1. Cells lines and cell culture
Breast carcinoma is a key example where normal epithelial cells transform to malignant mesenchymal cells. For our studies, we chose three breast cell lines: MCF-10A (Cat.No. CRL-10317, ATCC) as an example of normal breast epithelial cells as well as MDA-MB-231 (Cat.No. HTB-26, ATCC) and MDA-MB-436 (Cat.No. HTB-130, ATCC) as particularly motile and invasive cancer cell lines [44]. Thus, we consider an enhanced motility as the main feature of the EMT and do not focus on a particularly strong change in cadherin expression. Another reason for choosing these three cell lines was their similar elastic properties and cell size (see supplementary section S.1), yielding a scenario in which the segregation process should not be affected by differences in these properties.
MCF-10A cells were cultured in DMEM/Ham's F12 medium containing l-glutamine (Cat.No. E15-813, PAA Laboratories GmbH, Austria) supplemented with 5% horse serum (Cat.No. A15-151, PAA), 20 ng ml−1 human epidermal growth factor (Cat.No. E9644, Sigma-Aldrich), 10 μg ml−1 insulin (Cat. No.I9278, Sigma-Aldrich), 100 ng ml−1 cholera toxin (Cat.No. C8052, Sigma-Aldrich), 500 ng ml−1 hydrocortisone (Cat.No. H0888, Sigma-Aldrich) and 100 U ml−1 penicillin/streptomycin (Cat.No. P11-010, PAA).
MDA-MB-231 and MDA-MB-436 cells were cultured in DMEM containing 4.5 g l−1 glucose, l-glutamine, but without sodium pyruvate (Cat.No. E15-810, PAA) supplemented with 10% foetal bovine serum (Cat.No. A15-151, PAA) and 100 U ml−1 penicillin/streptomycin.
All cell lines were incubated at 37 °C in a 95% air/5% CO2 atmosphere. The culture medium was changed every 2–3 days and cells were passaged every 4–5 days. To detach the cells, a PBS solution containing 0.025%(w/v) trypsin and 0.011%(w/v) EDTA (Cat.No. L11-004, PAA) was applied for several minutes.
4.2. Measurement of the cadherin surface densities
STED microscopy introduced in [64, 65] was used to visualize E-, N- and P-cadherins on the cell surface, which were immunofluorescently labelled with cadherin type specific primary antibodies and a STED-compatible secondary antibody.
First, cells were seeded in glass bottomed tissue culture treated microwell plates (μ-Plate 96 well ibiTreat, Cat.No. 89626, ibidi GmbH, Germany) suitable for high resolution immersion microscopy. The adherent cells were fixed by applying a PBS solution containing 4%(w/v) paraformaldehyde and 1%(w/v) sucrose for 10 min at room temperature. Afterwards, cells were washed three-times with PBS, followed by incubation with blocking buffer composed of 0.1% Triton X-100 (Cat.No. X100, Sigma-Aldrich) and 10% goat serum (Cat.No. G9023, Sigma-Aldrich) in PBS for 15 min at room temperature. Then, cells were incubated with 5 μg ml−1 mouse anti-E-cadherin (Cat.No. 610181, BD Biosciences), 5 μg ml−1 mouse anti-N-cadherin (Cat.No. 610920, BD Biosciences), or 5 μg ml−1 mouse anti-P-cadherin (Cat.No. 610227, BD Biosciences) in blocking buffer for 1 h at room temperature. Afterwards, cells were again washed three-times with PBS, followed by incubation with blocking buffer for 15 min at room temperature. Then, cells were incubated with 0.2 μg ml−1 ATTO 647N conjugated goat anti-mouse IgG (Cat.No. 610-156-121S, Rockland Immunochemicals, USA) in blocking buffer for 1 h at room temperature. After that, cells were washed four-times with PBS and rinsed once in purified water (Millipore Milli-Q). Finally, cells were mounted in ProLong Gold Antifade (Cat.No. P36930, Invitrogen/Molecular Probes) to reduce photo-bleaching. Curing was allowed at least 48 h at room temperature before measurement.
Cadherins in the interface between the cell surface and the glass substrate were imaged with a confocal laser scanning microscope (Leica TCS SP5 STED, Leica Microsystems GmbH, Germany) in STED mode using a 635 nm laser for excitation. The conventional confocal laser scanning mode with a 633 nm laser was just used for control. The STED resolution in the xy-plane was measured to be 70 nm for the wavelength of the cadherin bound ATTO 647N fluorophore. The fluorescence signal was faint; thus, 32 to 64 line averages were done to increase the image contrast. Images were taken with at least half the maximal resolution of the STED system, in order not to lose any information.
For further image analysis, only the super-resolution STED images were used. A customized peak finding algorithm written in MATLAB applies a local maximum based filter to detect cadherins. If connected regions are larger than the maximum STED resolution, they are regarded to be clusters of multiple cadherins. Based on the cluster size and the reported size of single cadherin complexes [47], the number of cadherins in the cluster was approximated. For each of the different combinations of cell type and cadherin type, at least three cells were imaged and analyzed.
Note that the cadherins of individual adhered cells have been imaged and quantified at the cell–substrate interface, while during the segregation process, the situation of cadherins in the cell–cell interface might be different. We preferred this approach to quantify cadherins over real time quantitative PCR methods because they do not even quantify actually present receptors, but only the 'underlying' gene expression.
4.3. Adhesion measurements
An atomic force microscope (AFM) (JPK CellHesion 200, JPK Instruments AG, Germany) in combination with an inverted phase contrast microscope (Leica DM IRB, Leica Microsystems GmbH, Germany) was used in order to probe the adhesion forces between pairs of cells, as introduced in [66]. To allow cell attachment, tipless cantilevers (Arrow TL2, NanoWorld AG, Switzerland) with spring constants around 30 mN m−1 were functionalized by coating them with 20 μg ml−1 fibronectin (Cat.No. F1141, Sigma-Aldrich) in PBS overnight at 4 °C. For the measurement, suspended cells were freshly flushed into a surface-treated plastic Petri dish (Cat.No. 93040, TPP Techno Plastic Products AG, Switzerland). While the cells settled down and started to adhere to the substrate, one cell had to be attached to the cantilever. To 'capture' a cell, the coated cantilever was pushed with a force of 500 pN for 5–10 s onto a cell still loosely laying on the substrate and subsequently, it was retracted again with the cell slightly sticking to the cantilever. This was followed by a rest time of 20–30 min to let the one cell firmly adhere to the surface of the cantilever and the other cells to the substrate.
To measure cell–cell adhesion forces, the cell on the cantilever was brought into contact with a cell on the substrate with an approach speed of 5 μm s−1, pushed against it with a constant force of 500 pN for 5 s (constant force mode) and finally separated again with a pulling speed of 5 μm s−1. For the whole cycle, a force–distance curve was recorded. In this manner, each cell on the substrate was probed five times with a rest time of 10 s between cycles. A self-made Petri dish heater was used to keep the cells at approximately 37 °C during the whole AFM measurement. We used the same media which were used during cell culture (see section 4.1).
Our analysis concentrated on the maximum adhesion force which was extracted as the minimum of the retract segment of a force–distance curve, see figure 3(a). We ignored single (molecular) unbinding events which are sometimes visible as steps in the retract segment. As they only appear rarely, it is doubtful if they are representative.
Note that the AFM measurements have to be done on a different, much shorter, time scale in comparison to the segregation experiments which run over several hours to more than a day. On the one hand, this is necessary to gain acceptable statistics with the AFM by probing multiple cells. On the other hand, there are technical limitations impairing long-term AFM measurements such as drifts. Due to the limited pulling range of the AFM setup (in our case 100 μm), at one point, it becomes practically impossible to completely separate the cells after the contact (at least in a well-defined and measurable manner). Admittedly, short-term AFM measurements cannot cover the full dynamic range of cell–cell adhesion with respect to the segregation results. We tried to address this issue with a second set of AFM measurements in which a smaller amount of cells was systematically probed with varying contact times ranging from 2.5 to 90 s. The adhesion forces clearly reach a saturation level. Nevertheless, the formation of desmosomes at a later stage may further increase cell–cell adhesion in the normal epithelial cells.
Moreover, there is no generally accepted reliable method for normalizing the measured adhesion forces by means of the contact area between the two cells. Although our setup (at least to some extent) permits simultaneous usage of transmitted light microscopy techniques during a measurement, it is not able to precisely visualize the contact area. We tried several approaches to indirectly gain estimates for the contact area. But none of them turned out to be fully convincing (see supplementary section S.1). Still, our three cell lines do not drastically differ in cell size or elasticity (see supplementary section S.2), both of which would generally affect the contact area.
4.4. Cell clustering experiments
In order to create homogeneous cellular aggregates, a standard liquid overlay technique was used [67]. In brief, cells were passaged into plastic Petri dishes (Cat.No. 93060, TPP Techno Plastic Products AG, Switzerland) whose bottom surfaces had been coated with a 2%(w/v) agar gel (Cat.No. A6686, Sigma-Aldrich), preventing cell attachment. Thus, cells remained in suspension, only interacting with each other. After one day of culture, cell aggregates had formed. Then, aggregates were stained with 1x working solution of CellMask Deep Red plasma membrane stain (Cat.No. C10046, Molecular Probes/Life Technologies) for 10 min at 37 °C. A confocal laser scanning microscope (Leica TCS SP2 and Leica DM IR2, Leica Microsystems GmbH, Germany) with standard fluorescence excitation (633 nm HeNe laser) was used to image the aggregates.
4.5. Segregation experiments
For segregation experiments with heterogeneous mixtures of two cell populations, cells were first fluorescently labelled with unspecific cytoplasmic dyes, CellTracker Green CMFDA (Cat.No. C7025, Invitrogen/Molecular Probes) and CellTracker Red CMTPX (Cat.No. C34552) according to manufacturer's protocol. In brief, cell cultures were incubated with the staining solution (2 μM dye in serum-free medium) for 45 min at 37 °C and subsequently washed two-times with PBS, before detaching the cells by trypsinization (see section 4.1). Cells were then counted and mixed in the ratio of 50:50. As medium, we now used a 50:50 mixture of the two culture media of the individual cell lines (see section 4.1).
For initial experiments, the traditional method of hanging droplet cultures [68] was used, see figure 7(a). Droplets of 15 μl cell culture medium containing approximately 20 000 cells were deposited to the hydrophobic inner surface of the lid of a small plastic Petri dish (Cat.No. 93040, TPP Techno Plastic Products AG). The dish was sealed with Parafilm to prevent too fast drying. However, this method has several disadvantages: The amount of nutrients in such a small droplet of medium is very limited and turned out to be insufficient to observe the final stage of segregation for one of the cell population pairs. It seems that if all nutrients are depleted, the segregation process arrests prematurely. There is also the danger of cells altering their normal properties and behaviour under nutrient shortage. Furthermore, the setup is not suitable for long-term observations while keeping acceptable ambient conditions, in particular temperature and pH of the medium. Additionally, it is limited to upright microscopes. Since most culture media are carbonate buffered, CO2 supply is required to keep the physiological pH of 7.4 in the medium.
To solve these issues, a novel technique for studying multicellular spheroid formation and cell segregation was developed, see figure 7(b).Using home-made stamps, hemispherical cavities with diameters of either 1 or 2 mm were moulded into a 2%(w/v) agar gel (Cat.No. A6686, Sigma-Aldrich) resembling the essential geometry of a hanging droplet. Due to inverting the setup, now plenty of medium, a heating cup and CO2 supply can be used, allowing long-term observation of the segregation dynamics. As an alternative to the agar gel, a PDMS gel (Sylgard 184 Silicone Elastomer Kit, Dow Corning, USA) with a 0.1 mg ml−1 PLL-PEG (Cat.No. PLL(20)-g[3.5]-PEG(2), SuSoS AG, Switzerland) coating can be used instead, increasing the storage life. Cell cultures in the moulded cavities were observed with the same confocal laser scanning microscope (Leica TCS SP5 STED) used for imaging the surface cadherins, but without STED mode. Multiphoton excitation with a 780 nm laser was used to reduce photo bleaching and phototoxic effects compared to standard fluorescence excitation (with 488 nm and 561 nm lasers). Every 35 min, image stacks containing sections of the culture were recorded, thus providing 3D image information. An automated stage allowed parallel imaging of multiple cavities with cells, increasing the throughput of experiments considerably.
4.6. Analysis of the segregation dynamics
In order to quantitatively characterize the dynamics of segregation process, the pseudo period Lm was determined for each time step from the binarized confocal image stacks with a 3D autocorrelation based algorithm using customized MATLAB scripts (The MathWorks, USA). The pseudo period Lm is defined as the mean spacing between domains of fluid of the same type. Because we study nearly 50:50 mixtures of two cell populations, the average cluster radius of one phase is the mean spacing between clusters of the other phase. Here, we use the cell population that will eventually form the inner cluster for the evaluation of Lm for each time step. To measure the average cluster radii in the confocal image stacks, we borrowed a technique from the analysis of porous media [69, 70] and calculated a 3D two-point autocorrelation function of the binarized images via  where f is a characteristic function: 1 for pixels corresponding to the cell type forming the inner cluster and 0 for the rest. Brackets denote an average over the spatial coordinate x and radially outwards from the central point. Then, the specific surface area is
  and the volume fraction is
  [69].
[69].  and if there is little variation in droplet sizes
  We carefully checked the formalism for several test stacks and found good agreement to the test data, even for larger variations in droplet sizes.
Acknowledgments
We appreciate the assistance of Barbara Goettgens in running the confocal microscope as well as technical, logistical and administrative support by Bernd Kohlstrunk, Elke Westphal, Undine Dietrich and Claudia Brück. We acknowledge the financial support by the German Research Foundation (DFG grant KA 1116/9-1), the graduate school Leipzig School of Natural Sciences—Building with Molecules and Nano-objects (BuildMoNa) and the European Social Fund (ESF). MLM acknowledges support from NSF-BMMB-1334611, NSF-DMR-1352184 and the Alfred P Sloan Foundation. This article was supported by the German Research Foundation (DFG) and the University of Leipzig within the program of Open Access Publishing.