


Abstract
A Stark decelerator is used in combination with velocity map imaging to study collisions of NO radicals with rare gas atoms in a counterpropagating crossed beam geometry. This powerful combination of techniques results in scattering images with extremely high resolution, in which rotational and L-type rainbows with superimposed quantum mechanical diffraction oscillations are visible. The experimental data are in excellent agreement with quantum mechanical scattering calculations. Furthermore, hard-shell models and a partial wave analysis are used to clarify the origin of the various structures that are visible. A specific feature is found for NO molecules colliding with Ar atoms that is extremely sensitive to the precise shape of the potential energy surface. Its origin is explained in terms of interfering partial waves with very high angular momentum, corresponding to trajectories with large impact parameters.
Export citation and abstract BibTeX RIS

Content from this work may be used under the terms of the Creative Commons Attribution 3.0 licence. Any further distribution of this work must maintain attribution to the author(s) and the title of the work, journal citation and DOI.
1. Introduction
Molecular collisions play an important role in many chemical processes and have therefore often been the subject of experimental and theoretical studies. The result of a collision is determined by the path collision partners take over the underlying potential energy surface (PES), and the comparison between experimental and theoretical scattering cross-sections can be used to gauge the quality of the PES applied in the scattering calculations. One of the most stringent tests for the PES is the angular distribution of the collision products, as expressed in terms of the differential cross-section (DCS).
Our aim is to measure these DCSs with ever higher resolution in order to provide sensitive tests for the ever more accurate PESs that are available. With the velocity map imaging (VMI) technique, a two-dimensional image of the scattered molecules can be recorded that directly reveals the DCS of a collision process [1]. This technique greatly improved our ability to record DCSs in crossed molecular beam experiments. When this powerful detection method is combined with perfectly controlled molecular beams before the collision, scattering images can be recorded with high resolution.
The Stark deceleration method has proven to be an excellent technique for controlling the reactants [2, 3]. This method can produce molecular beams with a tunable velocity, a narrow velocity and angular spread, a narrow spatial distribution, and an almost perfect quantum state purity. We recently showed that the combination of a Stark decelerator and VMI significantly enhances the resolution of the scattering images [4, 5], such that quantum diffraction oscillations can be resolved in state-to-state DCSs. This resolution is further enhanced when a counterpropagating crossed beam geometry is used, effectively eliminating the contribution of the atom beam's velocity spread to the angular image resolution [6]. In addition, the counterpropagating geometry affords the use of image analysis methods that reveal the angular scattering distribution from the raw experimental images with optimal resolution.
Here, we present a combined experimental and theoretical study of state-to-state rotationally inelastic scattering of NO(X  ) radicals and the rare gas (Rg) atoms He, Ne, Ar, Kr and Xe. Scattering images with the highest resolution presently possible are obtained by combining the Stark deceleration, VMI, and counterpropagating beam scattering techniques. Different structures are observed in the DCSs for these systems, such as rotational and L-type rainbows with superimposed quantum diffraction oscillations.
The scattering between NO(X  ) and Rg atoms has emerged as a benchmark system for observing these quantum mechanical and classical structures and has therefore been the focus of many experimental and theoretical studies [4, 6–18]. The physical origin of rotational rainbows [9–11, 13, 19–24], L-type rainbows [11, 14–16, 25–29] and diffraction oscillations [4, 6, 27, 30–33] is well understood and these structures have been studied before. However, in atom-molecule collisions, especially L-type rainbows and diffraction oscillations could only be observed experimentally in a few systems. The extremely high resolution available in our experiments affords the clear observation of all of these structures in the state-to-state DCSs for fully state-selected NO + Rg collisions.
We compare our measured DCSs with the DCSs predicted by quantum mechanical close-coupling (QM CC) calculations, providing stringent tests for the quality of the PESs applied in the calculations. In addition, we use hard-shell models to reveal and interpret the physical origin of the different structures that are observed. For the scattering of NO with the series of collision partners He, Ne, Ar, Kr and Xe, we study how the anisotropy and well depth of the system influence the various structures, thereby explaining the general trends that are observed. For NO scattering with Ar, we have observed a distinct feature in the DCS that appears extremely sensitive to details in the PES, and that can be used to discriminate between two state-of-the-art NO–Ar PESs [6]. We present a full partial wave analysis of the scattering process, revealing the nature of the interference effect resulting in this feature.
2. Methods
2.1. Experiments
A schematic representation of our crossed beam scattering set-up is shown in figure 1. This apparatus has been described in detail in [5]; here, we will only describe some essential aspects of the experiment, as well as some modifications.

Figure 1. Schematic view of the experimental set-up. A pulsed beam of NO radicals is manipulated in a 2.6 m long Stark decelerator, and scatters with beams of rare gas atoms in a counterpropagating geometry. The scattered molecules are ionized and imaged onto a position sensitive detector using the velocity map imaging technique.
Download figure:
Standard image High-resolution imageA beam of NO molecules passes through a 2.6 m long Stark decelerator, resulting in a packet of NO ( ) radicals with a mean velocity of 350 m s−1, a longitudinal velocity spread of 2.1 m s−1 (
 ), and an angular spread of 0.1° (
 ). This packet collides with a beam of neat Rg atoms, produced by a Nijmegen Pulsed Valve [34], at a beam intersection angle of 180°. In this counterpropagating beam geometry, the angular resolution in the scattering images is mainly determined by the angular spread of the Rg atom beam, as described in [6]. To obtain high resolution images, the atomic beam is well collimated by passing a 2 mm diameter skimmer and a 1 mm wide slit before entering the interaction region. The scattered NO molecules are state-selectively ionized using an ion-recoil free (1+1') resonance enhanced multiphoton ionization scheme, and detected using a conventional VMI detector. The two laser beams are directed parallel to the detector plane, and cross each other at right angles. Both lasers are focused to obtain a small ionization volume and the excitation laser polarization is parallel to the detector plane.
When counterpropagating beams are used, it is important that the reagent beams only overlap within a well defined volume and time. This overlap can be determined by measuring time-of-flight (TOF) profiles for both beams. A TOF of the NO molecules exiting the Stark decelerator has been shown before [5]. From such a TOF we determined that the packet of NO radicals has a temporal width of 25 μs (full width at half maximum, FWHM). Trace amounts of NO molecules entrained in the rare gas atom beams allow us to measure the TOF profiles of the atomic scattering partners. Temporal widths of 19, 13, 16, 40, and 59 μs (FWHM) were obtained for beams of He, Ne, Ar, Kr and Xe, respectively.
In the scattering experiments, the leading edges of both beams are allowed to overlap for about 5–30 μs before the detection lasers are fired, depending on the system and transition of interest. Although the particle densities available in both beams contributing to the scattering are compromised, the reagent beams overlap for only a short period of time and spatially overlap within a well defined volume.
In order to determine the collision energies as precisely as possible, we carefully calibrated the VMI detector as described in [5] and found a calibration factor of 2.4 m s−1 pixel−1. From this calibration, the mean speed of the rare gas atom beam was determined to be 1850, 850, 660, 440 and 350 m s−1 for He, Ne, Ar, Kr and Xe, respectively, resulting in collision energies for this series of 715, 720, 730, 580 and 500 cm−1.
2.2. Example of experimental image and data analysis
In this section, we present the methods that are used to convert raw experimental scattering images into a DCS. In figure 2(a), a typical experimental scattering image is shown as an example. This image is obtained for the scattering of NO ( ) radicals with He atoms, exciting the NO radicals to the
  state. In this raw image, an oscillatory pattern in the angular intensity distribution is already visible, although the contrast between the peaks is relatively small. It is noted that a small segment of the distribution around forward scattering is affected due to imperfect state selection of the NO packet. In this area, the scattering intensity distribution cannot be trusted, and we manually set the intensity to zero, resulting in the black square. The area in which we cannot trust the data is only 2 × 2 pixels in size, but to be conservative we discard the data within 7 × 7 pixels.
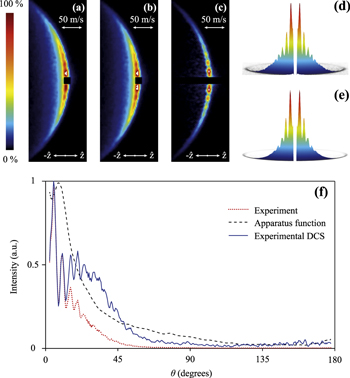
Figure 2. Scattering images for inelastic collisions between NO and He, exciting NO into the  state. The reagent beams of NO and rare gas atoms propagate in the
  and
and  directions, respectively. The colors represent the scattering intensity. (a) Raw experimental ion image. (b) Experimental image after Doppler correction. (c) Experimental image after Doppler correction and the inverse Abel transformation. (d) Three-dimensional representation of the inverse Abel transformed experimental data. (e) Three-dimensional representation of the angular scattering distribution derived from a simulation of the experiment after the inverse Abel transformation. (f) The experimental angular distribution resulting from image (c) (red dotted line), the apparatus function (black dashed line), and the experimental DCS (blue solid line) that is obtained by dividing the experimental angular distribution by the apparatus function. Small segments of the scattering distributions around forward scattering are masked (black squares in a–c, and white stripes in d–e) due to imperfect state selection of the reagent beam of NO.
Download figure:
Standard image High-resolution imageBecause we use a counterpropagating beam geometry, the scattering images are in principle cylindrically symmetric with respect to the mean relative velocity vector of the colliding beams. This allows us to apply the inverse Abel transformation to the raw scattering images, effectively canceling the blurring of images that occurs when three-dimensional Newton spheres are projected onto a two-dimensional detector plane [35]. It is seen in figure 2(a) that the raw image is indeed almost symmetric with respect to the relative velocity vector. Within our experimental geometry, however, Doppler and collision-induced alignment effects may lead to a small dependence of the detection probability on the angle between the scattered molecule and the laser propagation direction. No indications are found that collision-induced alignment plays a significant role for the scattering processes studied here. We apply a Doppler correction based on the geometry of the experiment, where we assume that the Doppler effect is mainly caused by the excitation laser with a bandwidth of 0.08 cm−1. After the Doppler correction, the scattering image as shown in figure 2(b) is obtained, which is symmetric with respect to the mean relative velocity vector.
The inverse Abel transformation can now be applied to the Doppler corrected image. We use the BASEX suite of programs without Tikhonov regularization [36], resulting in the image as presented in figure 2(c). The oscillatory diffraction pattern is retrieved with much higher resolution, as is also appreciated from the three-dimensional representation of the data shown in figure 2(d). We will use such three-dimensional representations of the data throughout in this manuscript for all measured state-to-state channels, and for all systems studied. The inverse Abel transformation introduces noise on the central line of the image, which is the line superimposed on the relative velocity vector of the collision system. We therefore discard the data on this central line, resulting in a white stripe of zero intensity around forward scattering in the three-dimensional representation of the data.
It is straightforward to extract the angular scattering intensity distribution from these Abel inverted symmetric images. These distributions, however, do not yet represent the DCS of the scattering process. Additional effects exist, related to the kinematics of the experiment, that lead for example to a strong detection bias towards forward scattering. This bias is caused by NO molecules that collide with Rg atoms before reaching the ionization volume, scatter in the forward direction and are to be found in the ionization volume when the lasers arrive.
In the case of a counterpropagating beam geometry, this detection bias for forward scattering results in a correction factor that is equal on both sides of the image, i.e., the inherent radial and angular resolution on either side of the image is equal. We can thus easily correct for the effect by calculating the apparatus function that gives the detection probability as a function of the scattering angle θ. This apparatus function is calculated using simulations of the experiment that are based on the temporal, spatial and velocity distributions of both beams, as well as on the spatial overlap of the laser beams with the scattering volume. The DCS of the scattering process under study is then evaluated by dividing the angular scattering distribution from the experimental Abel inverted image by the apparatus function. This procedure is illustrated in figure 2(f) that shows the experimental Abel inverted angular distribution, the apparatus function and the resulting experimental DCS. This experimentally determined DCS can now directly be compared to the DCS that is predicted by QM CC calculations.
The calculation of the apparatus function, and the procedure to correct the angular scattering distribution, is only correct to the extent that the simulations properly describe the actual experimental conditions. It is therefore very important to verify that the simulations indeed give an accurate description of the experiment and its kinematics. To this end, we simulate the scattering image for the process under study, using the DCS as input that is predicted by QM CC calculations, i.e., we simulate the raw scattering image that we expect to measure in the experiment. The same analysis procedure as described above is then applied to this simulated image, resulting in a three-dimensional and Abel inverted representation of the simulated data that can be directly compared to the experimental results. Figure 2(e) shows the three-dimensional representation of the simulated image for NO + He. There is very good agreement between the experimental and simulated images, which implies that the experimental parameters are indeed properly taken into account in the simulations. In general, similar agreement is found for all scattering systems and channels, adding further confidence in our description of the kinematics.
2.3. Theory
The  electronic ground state of NO consists of two spin–orbit levels with
  and
and  . A non-collinear approach of the rare gas atom towards the NO molecule leads to a splitting of this
  -state, resulting in two PESs of A' and A'' symmetry [37]. For Hund's case (a) molecules, Alexander has shown that spin–orbit conserving (
 = 0) transitions are coupled by the sum potential,
  , while spin–orbit changing (
 = 1) collisions are governed by the difference potential
  [37, 38].
For NO + He [39, 40], NO + Ne [41–43] and NO + Ar [41, 44–46], multiple ab initio PESs are available. In this work, we used the recent PESs from Cybulski et al for these systems [39, 41]. These two-dimensional PESs, with a fixed NO internuclear distance of re = 1.153763 Å, have been computed using the spin-restricted coupled cluster method with single, double, and non-iterative triple excitations (RCCSD(T)) with a doubly-augmented correlation-consistent polarized valence quadruple-zeta basis set (d-aug-cc-pVQZ), extended by midbond functions. For the NO + Kr and NO + Xe systems, which are less often studied, we used the PESs described in [47] and [14], respectively. These two-dimensional PESs have been computed using the RCCSD(T) method with the NO internuclear distance fixed to re = 1.15077 Å. For NO + Kr, an augmented correlation-consistent polarized valence triple-zeta (aug-cc-pVTZ) basis set extended by bond functions has been used. For NO + Xe, an aug-cc-pVTZ basis set has been used for the NO molecule, in combination with an ECP46MWB effective core potential for the Xe atom which includes scalar relativistic effects. The basis set has been augmented with midbond functions.
The most relevant properties of the various systems, such as the reduced mass of the NO–Rg complex, the polarizability of the Rg atom and the parameters for the well depth of the  PES are listed in table 1. Here, R is the length of the vector
R
connecting the center-of-mass of the NO molecule and the Rg atom. The angle between
R
and the NO bond axis is γ, where
PES are listed in table 1. Here, R is the length of the vector
R
connecting the center-of-mass of the NO molecule and the Rg atom. The angle between
R
and the NO bond axis is γ, where  corresponds to a collinear Rg–NO configuration.
Table 1.
Properties of the NO–Rg systems, with Rg = He, Ne, Ar, Kr, Xe. The reduced mass μ, the polarizability α, the well depth De of the  PES and the corresponding distance Re and Jacobi angle
  are given.
| Atom | μ (u) | α (10−24 cm3) | De (cm−1) | Re (a0) |
 ( ( ) ) |
|---|---|---|---|---|---|
| He | 3.5 | 0.21 | 27.7 | 6.12 | 96 |
| Ne | 12.0 | 0.4 | 57.0 | 6.18 | 95 |
| Ar | 17.1 | 1.64 | 114.4 | 6.78 | 93 |
| Kr | 22.1 | 2.48 | 139.3 | 7.10 | 88 |
| Xe | 24.4 | 4.04 | 141.7 | 7.52 | 90 |
The QM CC calculations were performed with a scattering program for open-shell diatom-atom scattering that was originally developed for OH + Rg collisions [48]. The renormalized Numerov method was used for the propagation of the wave function on a grid in R starting at 3.5 bohr for NO + He, at 3.0 bohr for NO + Ne and Ar and at 4.5 bohr for NO + Kr and Xe, up to 60 bohr for all systems. We used equidistant grids with 687, 1281, 1531, 2031 and 1591 steps for He, Ne, Ar, Kr and Xe, respectively. A channel basis set was used that included all NO rotational levels up to j = 20.5 and all partial wave contributions up to a total angular momentum of J = 160.5 for NO + He and J = 250.5 for the other systems to reach convergence. We calculated state-to-state scattering cross-sections using the  and
and  PESs. However, because we only studied spin–orbit conserving transitions, we effectively only probed the
  PES.
PES.
3. Results and discussion
We have measured the state-to-state DCSs for all scattering partners for two specific final rotational levels of the NO molecules, namely the  and the
  states. The three-dimensional representations of the experimental scattering images, after the inverse Abel transformation is applied, are presented for all NO + Rg systems in figure 3. A selected part of the image, displaying the finest structures that are observed, is shown next to each experimental image.
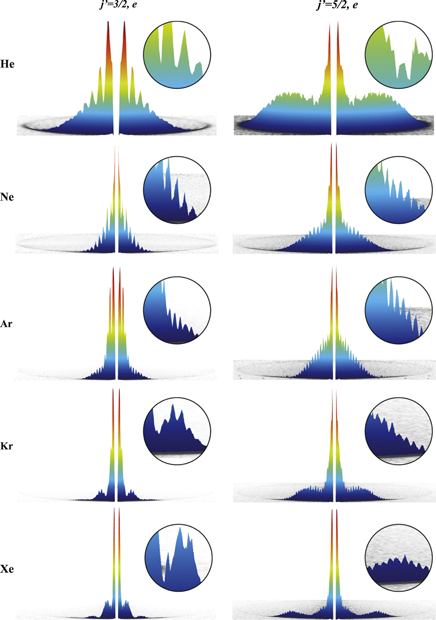
Figure 3. Three-dimensional representations of the experimental scattering images after the inverse Abel transformation for NO + He, Ne, Ar, Kr and Xe exciting the NO radicals to the  and the
  states. The colors represent the scattering intensity. Parts of the scattering distributions are shown on an enlarged scale next to the experimental images.
Download figure:
Standard image High-resolution imageBroad structures are visible with superimposed rapid oscillation patterns. It is seen that both these broader structures, as well as the diffraction oscillations, strongly depend on the scattering partner and on the final state that is probed. The angular spacing between the diffraction peaks decreases with increasing reduced mass, i.e., the spacing is largest for NO + He and smallest for NO + Xe. Moreover, there is in general more sideward scattering for the  state than for the
  state.
The angular distributions that are observed are almost perfectly reproduced by the QM CC scattering calculations. This is illustrated in figure 4 that shows the experimental DCSs derived from the experimental images together with the DCSs predicted by the QM CC scattering calculations at the mean collision energies of the experiment. In general there is very good agreement between the experimentally observed and theoretically predicted DCSs. Both the overall structure and the rapid diffraction oscillations are reproduced well for all systems and for both final states. The excellent agreement between experiment and theory, in particular at the high resolution levels of our experiment, demonstrates that all NO–Rg PESs used in this work are of high quality.
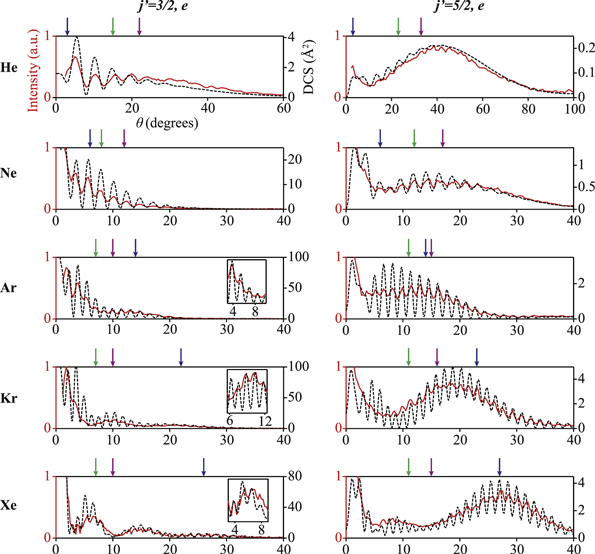
Figure 4. Experimentally determined DCS (red curves), together with the DCS predicted by QM CC scattering calculations (black dashed curves), for inelastic collisions of NO ( ) radicals with He, Ne, Ar, Kr and Xe atoms, probing the final states
  (left) and
  (right). The experimental and theoretical DCSs are scaled with respect to each other; the absolute value of the DCS that follows from the QM CC calculations is given by the right vertical axis. For the
  state of NO + Ar, Kr and Xe, a part of the DCS is shown on an enlarged scale with a different scaling between the experimental and theoretical DCSs. The angles at which the L-type rainbow, as well as the rotational rainbows from the N- and O-ends of the molecule are expected (see sections 3.2 and 3.3) are indicated by the blue, green and purple vertical arrows, respectively. Note the different horizontal axis that is used for NO + He.
Download figure:
Standard image High-resolution imageIn the experimental images as well as in the DCSs, different types of classical and quantum mechanical structures are clearly visible. The QM CC calculations accurately predict these structures, but they do not yield the interpretation on the physical origin of these structures. Although less quantitative, theoretical models such as hard-sphere models [10, 11, 20, 21], the quasi-classical trajectory (QCT) method [16, 49] and the quasi-quantum treatment [50–52] can yield qualitative and valuable insight into the origin of these structures. In the following, we will use simple hard-shell models to get a better understanding of the physical origin of these structures, and of the changes that are observed when going from He to Xe as a scattering partner.
3.1. Diffraction oscillations
The rapid oscillations that are visible in all images presented in this manuscript are diffraction oscillations. They originate from quantum mechanical interference of different trajectories of the colliding molecules on the underlying PES that result in the same final deflection angle. These are the narrowest structures that can occur in a DCS and are consequently the most difficult to resolve experimentally. We could already resolve these oscillations for favorable systems and states in our previous work, but due to the enhanced resolution afforded by the counterpropagating beam geometry and inverse Abel transformation, we can now measure them for all systems presented here.
Within a hard-sphere model, the angular spacing  between diffraction peaks can be approximated by [53]

where k is the wavenumber of the incoming wave and R is the radius of the sphere. The collision energy Ecoll is related to k via  , where μ is the reduced mass of the system.
For each NO–Rg complex, the radius R can be determined from a spatial contour plot of the NO–Rg  interaction potential [54]. These plots are shown for all NO–Rg complexes in figure 5. An effective radius of the complex then follows from the contour with an energy that equals the collision energy of the experiment. This contour is approximated by an ellipse as indicated by the red contour in figure 5, which is described by a minor semi-axis B and two major semi-axes AN and AO for the N-end and O-end of the molecule, respectively. The origin is the center-of-mass of the NO molecule.
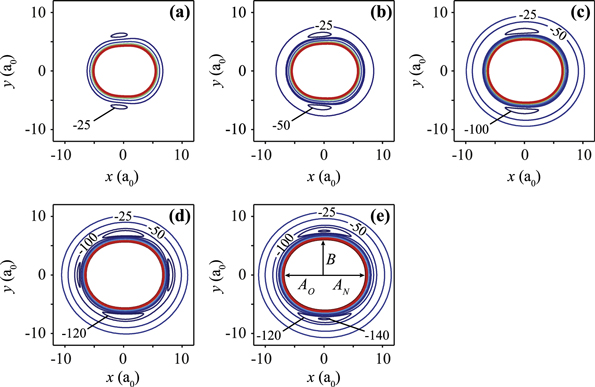
Figure 5. Spatial contour plots of the  potentials for the complex of NO with He (a), Ne (b), Ar (c), Kr (d) and Xe (e). The red contour shows the contour at the collision energy of the experiment. The contours of the attractive part of the potential with energies of
  and −25 cm−1 are labeled to demonstrate the differences between the potentials for the different systems. The two major semi-axes AN and AO and the minor semi-axis B for the complex are indicated in panel (e).
Download figure:
Standard image High-resolution imageThe values for the three axes are listed for each NO–Rg system in table 2, together with the collision energies of the experiment. Since NO can almost be considered homo-nuclear, the values for AN and AO are almost identical. We used the largest axis to determine R, and the resulting values for  are given in table 2, together with the angular spacings that result from the QM CC scattering calculations.
Table 2.
Parameters used for and following from the hard-shell models for the systems and states considered here. The experimental collision energies Ecoll, the major (AO and AN) and minor (B) semi-axes, the angular spacing  between the diffraction oscillations following from a h ard-sphere model and QM CC calculations, the rotational rainbow angles
  and
and  and the L-type rainbow angle
  are listed.
| NO + He | NO + Ne | NO + Ar | NO + Kr | NO + Xe | ||||||
|---|---|---|---|---|---|---|---|---|---|---|
| 3/2,e | 5/2,e | 3/2,e | 5/2,e | 3/2,e | 5/2,e | 3/2,e | 5/2,e | 3/2,e | 5/2,e | |
| Ecoll (cm−1) | 715 | 715 | 720 | 735 | 730 | 725 | 580 | 580 | 500 | 480 |
| AO (a0) | 5.13 | 5.13 | 5.50 | 5.49 | 6.21 | 6.21 | 6.53 | 6.53 | 7.03 | 7.05 |
| AN (a0) | 5.50 | 5.50 | 5.84 | 5.83 | 6.54 | 6.55 | 6.84 | 6.84 | 7.36 | 7.38 |
| B (a0) | 4.32 | 4.32 | 4.68 | 4.67 | 5.41 | 5.41 | 5.77 | 5.77 | 6.23 | 6.25 |
 ( ( ) model ) model |
5.1 | 5.1 | 2.6 | 2.6 | 1.9 | 1.9 | 1.8 | 1.8 | 1.7 | 1.7 |
 ( ( ) QM CC ) QM CC |
4.6 | 4.9 | 2.2 | 2.3 | 1.5 | 1.6 | 1.4 | 1.4 | 1.4 | 1.4 |
 ( ( ) ) |
22 | 33 | 12 | 17 | 10 | 15 | 10 | 16 | 10 | 15 |
 ( ( ) ) |
15 | 23 | 8 | 12 | 7 | 11 | 7 | 11 | 7 | 11 |
 ( ( ) ) |
3 | 3 | 6 | 6 | 14 | 14 | 22 | 23 | 26 | 27 |
It is seen that the model predictions for  are in qualitative agreement with the QM CC calculations, where the model predicts a 0.3–0.5° larger spacing than the QM CC calculations. It follows from both the hard-sphere model and the QM CC calculations that the spacing between the oscillations decreases with increasing reduced mass of the system, since the radius of the complex increases. Moreover, the spacing decreases with increasing collision energy. Even though Kr and Xe are much heavier than the other rare gases, their
  is only slightly smaller than for NO + Ar, because the collision energies for NO + Kr and Xe are substantially lower. The angular range in which diffraction oscillations occur becomes larger with increasing potential well depth [25]. Since the attractive interaction in NO + Rg is dominated by dispersion, the well depth correlates with the polarizability of the rare gas atom, and hence also with the reduced mass of the system (see table 1).
3.2. Rotational rainbows
Apart from the rapid diffraction oscillations, broader features exist that can be attributed to rainbow scattering. Two types of rainbows can exist for atom-molecule scattering: rotational rainbows and L-type rainbows.
Rotational rainbows originate from the repulsive part of the intermolecular potential and are a consequence of its anisotropic character. Their physical origin is found in an interference effect related to the fact that different initial conditions (impact parameter and relative orientation) can lead to the same collision outcome (scattering angle θ and final state j'). The rotational rainbow angle corresponds to the minimum scattering angle at which sufficient incoming translational momentum is converted into molecular rotation [13]. Angles smaller than the rotational rainbow angle are classically forbidden. This effect results in a maximum in the DCS caused by extrema in the angular momentum of the scattered molecule as a function of its initial orientation [16].
For an atom-ellipsoid hard-shell model, the rotational rainbow angle  appears at [55]

where An is the semi-axis AN or AO of the ellipsoid as described in the previous section. In the case of an open-shell molecule, such as NO,  is approximately equal to j'+
 /2 for the
  initial state [13]. Here,
  is the spectroscopic parity index, which is related to the parity p of the NO wavefunction by
  . The Λ-doubling components with e parity have
  , whereas the components with f parity have
  . In the present experiments, both parity p conserving (
 ) and parity p changing (
 ) transitions are measured, where
  is even and odd, respectively. For NO, two rotational rainbows are expected: one from the N-end and one from the O-end. These rainbow angles are referred to as
  and
and  , respectively. Both calculated rainbow angles are listed in table 2 for both final states and for all NO + Rg systems studied. In addition, the angles at which this model predicts
  and
and  are indicated in figure 4 by the vertical green and purple arrows, respectively.
It is seen that the rotational rainbow angles decrease with increasing reduced mass of the complex, reflecting the differences in anisotropy of the systems. Moreover, they shift to larger scattering angles with increasing rotational energy transfer  .
.
3.3. L-type rainbows
The L-type rainbows arise from attractive forces between collision partners. Classically, they are caused by the focussing of trajectories around the maximum negative deflection angle [28]. The glory point, i.e. the minimum scattering angle in the deflection function, is associated with the classical impact parameter that leads to trajectories in which attractive and repulsive forces cancel, leading to zero deflection. Quantum mechanically, the L-type rainbow originates from partial waves with higher J than the glory partial wave, and can therefore only occur when these high partial waves contribute to the cross-section. As these partial waves with high J cannot transfer sufficient energy to rotationally excite the molecule to high rotational levels, L-type rainbows are particularly prominent for low  transitions. Since we measured
  = 1, 2 transitions, it is expected that L-type rainbows are manifest in the DCSs.
In contrast to rotational rainbows, L-type rainbows also occur in elastic atom-atom scattering, and have been extensively studied in the past. Within a hard-sphere model, the angle  at which the L-type rainbow for elastic atom–atom scattering is expected can be approximated by [27]

where is the average well depth of the PES. It is noted that in a semiclassical description of the rainbow effect that takes the de Broglie wavelength of the particles into account, additional maxima in the DCS can occur. The angles at which these supernumerary rainbows are found depend on the path difference between two trajectories that lead to the same scattering angle, and strongly depend on the collision energy [28].
To apply the hard-shell model to the systems studied in this paper, we used the minimum of the isotropic potential as the average well depth. Table 2 lists the positions of the L-type rainbows  predicted by this model for all NO + Rg systems and they are indicated in figure 4 by vertical blue arrows. In contrast to the rotational rainbow, the position of the L-type rainbow only depends on the system and collision energy and not on the rotational excitation of the molecule. It is seen that the L-type rainbow shifts to larger angles when the reduced mass of the system increases, since the average well depth increases. Moreover, as can be inferred from equation (3),
  increases with lower collision energy.
3.4. Assignment of the structures
The simple hard-shell models described above yield predictions for the angular spacing of diffraction peaks and the angular positions at which the various rainbows occur. In the observed DCSs, the diffraction pattern is most easily identified. The assignment of rotational and L-type rainbows, however, is more ambiguous, because they can occur simultaneously and in overlapping angular regions. Table 2 and figure 3 show that  decreases, while
  increases with increasing reduced mass of the system. The positions at which the two types of rainbows are expected cross each other around the NO + Ar system. To assign the rainbows we use classical trajectories and quantum opacity functions.
We calculated approximately 105 classical trajectories for each system using the two-dimensional  PESs described in section 2.3. The NO rotational constant B = 1.69611 cm−1. The initial angular momentum of NO was set to zero, we chose random initial orientations, and selected an appropriate range of impact parameters b. For each trajectory we determined the deflection angle χ. In figure 6 we plot the scattering angles
  for each system in the panels on the right. The green arrows indicate the glory impact parameters, i.e., the impact parameters for which the deflection angle is zero. Trajectories with smaller impact parameters have positive deflection angles and we refer to those as nearside collisions. For the smallest impact parameters we find backward scattering at
  , as expected. Above the glory point we find trajectories with negative deflection angles, which we refer to as farside collisions.

Figure 6. Opacity functions for inelastic collisions of NO ( ) radicals with the collision partners He, Ne, Ar, Kr and Xe, probing the final states
  (left) and
  (middle), together with the deflection functions (right) for the
  (black) and
  (red) inelastic channels, that are computed at collision energies of 715, 720, 725, 580 en 500 cm−1 for collisions with He, Ne, Ar, Kr and Xe, respectively. The vertical green arrows indicate the impact parameter or partial wave at which the glory point is found in the deflection function or opacity function, respectively.
Download figure:
Standard image High-resolution imageIn figure 6 we also show the quantum opacity functions for both inelastic channels. These functions give the contributions of individual partial waves with angular momentum J to the integral scattering cross-section. They are calculated from the QM CC partial cross-sections σ as [14, 56, 57]

where j and j' denote the rotational quantum number of the initial and final state, respectively, and J represents the total angular momentum. All other quantum numbers of the initial and final states are represented by α and  , respectively. The green arrows in the plots of the opacity functions indicate the partial waves J that correspond to the classical glory impact parameters of the right panel. We refer to partial waves with smaller (larger) J as nearside (farside) partial waves. Note that more advanced methods exist to distinguish nearside and farside contributions in quantum calculations [58].
For the series He to Xe as collision partner, figure 6 shows that the range of impact parameters and the total number of partial waves that contributes to the cross-section increases. This is expected, since the well depth increases for the heavier systems. The extra energy and angular momentum that must be transferred to excite the  channel compared to the
  channel requires smaller impact parameters. The opacity functions confirm that for the
  channel partial waves up to higher J contribute.
For NO + He the highest impact parameters and partial waves that contribute to the scattering coincide with the glory point, the contribution of farside collisions is negligible, and we do not expect L-type rainbows. For NO + Ne, an interesting situation arises: for inelastic collisions populating the  state, there is just enough attraction to result in a small farside component, whereas these impact parameters above the glory point are incapable to excite NO to the
  state. The NO + Ar, NO + Kr and NO + Xe systems have larger well depths, and L-type rainbows are expected to be more pronounced. In particular for the
  state in NO + Kr and Xe, the L-type rainbow is clearly visible as a broad maximum in the DCSs around
  and
and  , respectively. The positions of the L-type rainbows, as predicted by the simple hard-shell model, closely match these values.
In figure 7 we analyze the NO + He and NO + Kr DCSs for both inelastic channels in more detail by comparing the full quantum results (blue solid curves) to the contributions of three groups of partial waves. The ranges are based on the opacity functions in figure 6 and the exact J values contributing to each group are given in figure 7. The group with the lowest angular momenta (black dotted line) has a negligible contribution to the total DCS. The second group (red dash-dotted curve) consists of the remaining nearside partial waves. For NO + He, this group gives rise to rotational rainbows and dominates the DCSs. The third group (green dashed curve) consists of farside partial waves with large J, which give rise to an unambiguous L-type rainbow in the  channel for NO + Kr around
  . Interference between nearside and farside partial waves gives rise to superimposed diffraction oscillations. Similar arguments hold for NO + Xe. For the intermediate cases NO + Ne and NO + Ar, however, the assignment is more ambiguous, as both L-type and rotational rainbows play a role. For the
  state in NO + Ar, where according to the models the L-type and rotational rainbows overlap, the amplitudes of the diffraction oscillations are very large.
Figure 7. Differential cross-sections for the  and
and  final states that are calculated for NO + He and NO + Kr using restricted sets of partial waves as indicated in the panels.
Download figure:
Standard image High-resolution imageIt should be noted that an L-type rainbow for NO + Kr has recently been observed, although with lower resolution, for the  state at a collision energy of 514 cm−1 [15]. The assignment of the L-type rainbow was based on QCT deflection functions and QM and QCT opacity functions. The transitions to the
  state studied here and the
  state are so-called parity pairs, which are primarily caused by the same expansion coefficient of the PES and therefore exhibit similar DCSs [8, 11, 13, 38].
3.5. Subtle interference effects
Clearly, the experimentally determined DCSs in general show excellent agreement with the DCSs that are predicted by the QM CC calculations, up to the highest level of detail. Surprisingly, however, close inspection of the data reveals that there is one small but intriguing peak in the experimental DCS for the  state in NO + Ar that does not match with the theory based on the recent PESs of Cybulski from 2012. This is illustrated in figure 8(a), showing the scattering intensity around forward scattering for this channel on an enlarged scale. As indicated by the blue vertical arrow in figure 8(a), we have measured a peak at a scattering angle
  where theory does not predict a peak.
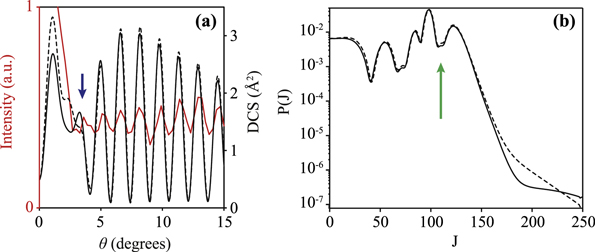
Figure 8. (a) Enlarged section of the experimental scattering distribution for NO + Ar collisions exciting the NO into the  state (red curve), together with the DCSs predicted by the Cybulski (black dashed curve) and Alexander (black solid curve) PESs. (b) Semi-logarithmic plot of the corresponding opacity functions, based on the Cybulski (black dashed curve) and Alexander (black solid curve) PESs. The green vertical arrow indicates the glory partial wave.
Download figure:
Standard image High-resolution imageBy contrast, we have found that theory based on the older PESs of Alexander [44] from 1999 does predict a peak here, as described earlier in [6] and shown in figure 8(a). In the following, we investigate the origin of this peak, which appears to be extremely sensitive to details in the PES, and hypothesize why the more recent PESs of Cybulski et al show less good agreement with the experiment.
The origin of the peak at  for the
  channel in NO + Ar is investigated using the appropriate opacity functions that are derived from both PESs. The opacity functions that result from the Cybulski PESs (black dashed curve) and the Alexander PESs (black solid curve) are shown in figure 8(b) on a semi-logarithmic scale. This figure reveals that the opacity functions are very similar for partial waves up to
  , but differ significantly for partial waves
  . The opacity function takes values below 10−4 in this region. The glory point is found at
  , as is indicated by the green arrow in figure 8(b).
Just as in the analysis of L-type rainbows described in section 3.4, we investigate the origin of the peak by calculating the DCS using only partial waves within a restricted window of values of the total angular momentum J. Figure 9 shows the DCS that results from both PESs in the following three situations: all partial waves with  are taken into account (blue solid curve); only partial waves with
  around the glory point are taken into account (black dashed curve); only partial waves with
  are taken into account (red dotted curve). It is checked that partial waves with
  do not influence the results.
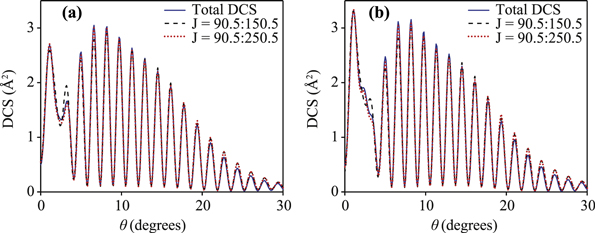
Figure 9. DCSs predicted by the Alexander PESs (a) and Cybulski PESs (b), when only a selected window of partial waves is taken into account. Blue solid curves: all partial waves are taken into account. Black dashed curves: only partial waves with  are taken into account. Red dotted lines: only partial waves with
  are taken into account.
Download figure:
Standard image High-resolution imageAs can be seen from figure 9, the general structure in the DCS is dominated by partial waves  . These partial waves yield a DCS that is almost identical to the DCS obtained with all partial waves. This is in particular the case for scattering angles
  , where a regular pattern of diffraction oscillations is observed. For smaller scattering angles, however, the DCS changes significantly when additional partial waves with
  are taken into account. In particular, the peak at
  is strongly affected. When the extra partial waves are taken into account, the intensity of this peak slightly decreases when the Alexander PESs are used, whereas the peak disappears completely for the Cybulski PESs. We can therefore conclude that both PESs inherently give rise to the peak at
  , but its contribution to the total DCS strongly depends on a subtle interference effect that involves partial waves with high values of J.
This behavior can be clarified using the classical deflection function for this scattering process. We refer to the deflection function as shown in figure 6 that was calculated using the Cybulski PESs. We refrain from plotting the deflection function for the Alexander PESs as well, as only minor differences occur that are not relevant for the argumentation given below. The diffraction oscillation pattern observed for  is caused by interference between partial waves around the glory point and the partial waves higher than the L-type rainbow partial wave at
  , that corresponds to the second maximum in the deflection function. This regular diffraction pattern does not extend to very small deflection angles, as the highest partial waves that still contribute to the deflection function for the
  state correspond to such large impact parameters that they cannot transfer sufficient energy to excite the NO radicals to the
  state. The deflection function therefore misses a tail of partial waves with high J. Consequently, the scattering in the region
  is dominated by a very subtle interference phenomenon, that is particularly sensitive to the exact shape of the opacity function for high values of J.
Both the forward peak at  and the peak at
  are located in the transition region, where the partial waves that can just induce a sufficient amount of rotational excitation contribute to the scattering. The scattering in this area is therefore extremely sensitive to small variations in the contribution of partial waves with very high values of J (i.e.
  ). This explains why the Cybulski and Alexander PESs yield identical DCSs for
  , but differ significantly in their prediction for the region
  .
.
Although the Alexander PESs predict a peak at  and thus yield better agreement with our experiments, both PESs fail to agree quantitatively with the DCS that is measured experimentally for
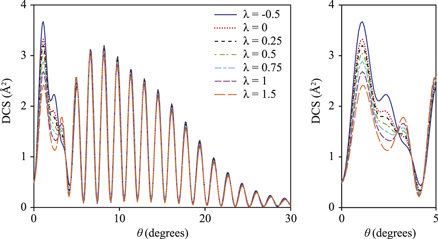
  . The subtle interference effect described above suggests that a tiny modification of the intermolecular potential can result in either an increase or decrease of this peak in the DCS. We may therefore use modified PESs, constructed via the relation V
 VAlexander + (1 −λ) VCybulski, thereby interpolating between the Alexander and Cybulski PESs using the scaling parameter λ.
The results are shown in figure 10, where the DCSs that result from the modified PESs are shown for different values of λ. It is seen that small variations in the PESs do not influence the diffraction pattern for angles  , but they result in striking changes for angles
  , consistent with the observations and interpretation given above. We can even extrapolate the Cybulski or Alexander PESs by using values for λ of −0.5 or 1.5. It is seen that the peak at
  is further reduced for
  and further enhanced for
  , suggesting that the NO–Ar PESs require more 'Alexander' character to match the experimental observations. Unfortunately, we have been unable to experimentally observe the peak at
  , as this region is masked by imperfect state selection of the reagent NO packet. Future experiments with improved state selection may yield experimental data in this region, such that our hypothesis can be tested using both features at
  and
and  . Either way, the ability to experimentally resolve and study these details in the DCS as demonstrated here offers new tools to compare experiment and theory, even for extremely well-known systems such as NO–Rg studied here.
Figure 10. DCSs predicted by hypothetical PESs  that are constructed from the Cybulski and Alexander PESs via
  VAlexander + (1 − λ) VCybulski. Right panel: zoom of the angular section
  .
.
Download figure:
Standard image High-resolution image
However, a puzzling observation remains: the more recent PESs of Cybulski et al [41], calculated with superior computational power, appear to show worse agreement with the experiment than the 15-year old Alexander PESs [44]. A possible explanation for this observation lies in the long range part of the PESs of [41]. According to theory [38], one should expand the sum potential  in terms of Legendre polynomials
  and the difference potential
  in terms of associated Legendre functions
  with M = 2. Instead, Cybulski et al [41] expanded the adiabatic potentials
  and
and  in terms of Legendre polynomials
  . The potentials
  and
and  must be equal and
  must vanish for linear geometries with
  and 180°. This holds exactly when the mathematically correct expansion functions are used, as in [44], but in the expansion used in [41] this only holds approximately. We found by inspection that the numerical error is small for most NO–Rg distances, but relatively large in the long range. Hence, the PESs of [41], although perhaps superior to the Alexander PESs [44] for shorter distances, behave slightly incorrectly for very large distances. Since the behavior of the PESs at such large distances turns out to be essential to obtain the interference between partial waves with very large values of J that causes the peak in the DCS observed experimentally at
  , it might well be that the formally incorrect angular dependence of the PESs of Cybulski et al. explains why these PESs fail to predict this peak.
The peak observed at  for NO + Ar, and the comparison with two PESs for this system, is a striking example of the level of detail that can now be reached, and the prospects this yields to advance theoretical methods and fitting procedures. In fact, close inspection of our experimental data also reveals a mismatch between theory and experiment for the
  state of NO + Kr. Here, theory predicts a peak in the diffraction pattern at
  , whereas this peak appears absent in the experiment. Unfortunately, only one PES is available for this system, preventing us from performing a comparative study between PESs as we did for NO + Ar. We hope that new NO–Kr PESs become available in the near future, such that the origin of this peak can be further investigated.
4. Conclusions and outlook
We have presented a set of DCS measurements for state-to-state inelastic collisions of NO ( ) radicals with He, Ne, Ar, Kr and Xe atoms. We used a novel experimental arrangement combining counterpropagating beam scattering, Stark deceleration and VMI to achieve optimal image resolutions. The inherent image symmetry afforded by the counterpropagating geometry was exploited to improve the resolution further by applying the inverse Abel transformation to the experimental scattering images, thereby directly revealing the scattering intensity on the equator of the Newton sphere. Together, this resulted in a set of experimentally determined state-to-state inelastic DCSs, in which rainbow features with superimposed quantum diffraction oscillations are fully resolved. Excellent agreement was found between the experimental DCSs and the DCSs that result from QM CC calculations with recently computed ab initio PESs. The origin of the main structures that are present in the DCSs and the general trends that were observed were elucidated using simple semiclassical hard-shell models and deflection functions, as well as full quantum mechanical partial wave analyses of the scattering processes.
The observation of small details in the DCS, with high sensitivity and good contrast, yields new possibilities to test PESs with unprecedented level of precision. This is illustrated in this manuscript using a specific peak that was observed in the DCS for the NO + Ar system as an example. This peak was found to originate from a very subtle interference effect involving partial waves around the glory point and the highest partial waves that just induce sufficient rotational excitation. The existence of this peak, however, was predicted by one PES available for this system, whereas it was not predicted by another PES. Both PESs are of high quality, but minor differences in calculation methodology and fitting procedures result in observable changes in the DCS, in particular around forward scattering where the peak was found.
The NO + Rg systems studied here belong to the most intensively studied and well-known systems in the field of molecular collision dynamics. Near-exact theoretical predictions for collision cross-sections exist for these benchmark systems. Yet, as demonstrated here, even for these systems the new instrumentation and experimental approaches available now can lead to new surprises and challenge the theoretical methods used. It is our hope and expectation that these tools will very soon also become available to less well-known systems, for which experimental validation of the PESs and of the approximations used to calculate them is still necessary. These include elastic, inelastic and reactive scattering processes involving polyatomic molecules, bi-molecular scattering processes, and collisions at (ultra)low temperatures that are dominated by quantum effects.
Acknowledgments
This work is part of the research program of the Foundation for Fundamental Research on Matter (FOM), which is financially supported by the Netherlands Organisation for Scientific Research (NWO). S Y T v d M acknowledges support from NWO via a VIDI and a TOP grant, and from the European Research Council via a Starting Grant. The authors thank J Kłos, M Alexander, H Cybulski and B Fernández for providing their PESs. The expert technical support by L Gerritsen, C Berkhout, P Claus, N Janssen and A van Roij is gratefully acknowledged.