


Abstract
To search for the lowest energy nuclear isomeric transition in 229Th in solid samples, a novel adsorption technique which prepares 229Th atoms on a surface of CaF2 is developed. Adsorbed 229Th is exposed to highly intensive undulator radiation in the wavelength range between 130 and 320 nm, which includes the indirectly measured nuclear resonance wavelength 160(10) nm. After the excitation, fluorescence from the sample is detected with a VUV sensitive photomultiplier tube. No clear signal relating to the nuclear transition is observed and possible reasons are discussed.
Export citation and abstract BibTeX RIS

Content from this work may be used under the terms of the Creative Commons Attribution 3.0 licence. Any further distribution of this work must maintain attribution to the author(s) and the title of the work, journal citation and DOI.
1. Introduction
The lowest nuclear radiative transition in 229Th is thought to have an exceptionally low transition energy, which is indirectly measured via γ-ray spectroscopy to be 7.8(5) eV (corresponding to a wavelength around 160 nm) [1]. Since this wavelength range is reachable by state-of-the-art vacuum-ultraviolet (VUV) lasers, it is believed that this nuclear transition offers unique opportunities to study an atomic nucleus via high resolution laser spectroscopy, which may open new fields bridging atomic physics and nuclear physics [2, 3].
The natural linewidth of the nuclear transition in 229Th is estimated to be ultranarrow, in the range of 1 mHz. Therefore, one of its promising applications is an optical 'nuclear clock': an atomic clock based on this nuclear transition [4, 5]. The performance of atomic clocks has been greatly improved over the past decades [6], with the most accurate optical atomic clocks reaching a fractional uncertainty below  10−17 [7–9]. All these atomic clocks are based on forbidden transitions in the electron shell. Therefore, their reference frequency is susceptible to effects from the surrounding environment such as electric and magnetic fields. Frequency shifts caused by such effects limit the accuracy of the atomic clock. A nuclear clock can greatly relax these difficulties because the atomic nucleus is highly isolated from the environment at its position in the center of the electron cloud and interacting only via the relatively small nuclear moments. As a result, field-induced frequency shifts (such as the AC Stark shift due to blackbody radiation, the scalar quadratic Stark shift etc) could be greatly suppressed. The achievable fractional frequency uncertainty of the nuclear clock is expected to be below
  10−18 [4, 10].
In addition, thanks to the immunity of the nuclear transition to the environment, the construction of a solid-state atomic clock is also regarded to be possible [4, 11–13]. A 229Th doped crystal is expected to enable a significantly simplified atomic clock which possesses better short-term stability than present atomic clocks because of the high number of interrogated nuclei. Such a handy but extremely high-performance atomic clock will have a large impact on the field of time and frequency metrology, for instance, with a view on atomic clocks in space missions.
In spite of these attractive possibilities, the lowest nuclear transition in 229Th has not been directly observed yet. At present, the nuclear transition energy is only known with an uncertainty of about 10 nm as the result of an indirect measurement through γ-ray spectroscopy [1]. Therefore, direct excitation and determination of a much more precise value of the resonance energy is strongly pursued around the world [5, 14–20].
We use the emission of an undulator device from an electron storage ring in the VUV wavelength range in a search for direct excitation of the nuclear transition. Based on the available photon flux and with a lifetime of the 229Th isomer in the range of 1000 s, we estimate that about 1013 229Th atoms are required as a target to obtain a signal in time-resolved fluorescence detection. A 229Th doped crystal is the most suitable sample for this measurement. However, due to the strong radioactivity of 229Th (halflife 7880 years), making such crystals is challenging. Instead, we develop a novel way to efficiently prepare 229Th atoms on a surface of a CaF2 crystal via adsorption. After irradiation with undulator radiation, we detect luminescence from the sample by VUV sensitive photomultiplier tubes (PMTs), but no indication of a long-lived fluorescence from 229Th is observed. In the following, the experimental details are described and possible reasons for observing no signal relating to the nuclear transition are discussed.
2. Preparation of 229Th adsorbate samples
2.1. Adsorption of Thorium on CaF2
In this study, about  1014 229Th nuclei are prepared on a surface of a transparent crystalline substrate at an areal density of
  1013 mm−2. Since the estimated energy of the investigated nuclear transition of 229Th is 7.8 eV, the substrate material must have a bandgap larger than that. Among a number of candidate materials, we choose CaF2 due to its large bandgap energy (12 eV) and the availability of highly pure material mainly developed for photolithography optics in the semiconductor industry. Purity of the substrate is one of the important requirements because luminescence from impurities may obscure the searched signal [21]. In addition, to reduce the luminescence intensity caused by radioactivity (Cherenkov radiation and scintillation light), the thickness of the sample should be as small as possible [22]. Diameter and thickness of our substrate (from Hellma Materials GmbH) are 10 and 0.5 mm.
Thorium atoms are prepared on a surface of CaF2 via adsorption from a solution. Thorium is known for its strong tendency to be adsorbed on the surface of many kinds of materials such as amorphous silica and alumina [23, 24]. The major factor which determines the adsorption efficiency is the acidity of the solution. We first investigate the adsorption efficiency of thorium on a surface of CaF2 as a function of pH of the solution. The long-lived isotope 232Th that is easier to handle due to its low radioactivity (halflife 1.4 × 10¹⁰ years) is used because we expect no difference of chemical properties between 229Th and 232Th.
232Th is available as  ions in nitric acid solution (Th(NO3)4 in 5% HNO3, Alfa Aesar). First, we take one drop of solution which contains 1014 232Th atoms and put it into a vessel made of perfluoroalkoxy (PFA). PFA is known for its high chemical inertness, which is helpful to avoid contamination during sample preparation. The PFA container is then heated to 80
  to evaporate the liquid. After evaporation, the PFA container is cooled down to room temperature and then dilute nitric acid, whose pH is tuned to the desired value, is added to dissolve the 232Th nitrate.
The surface of CaF2 is cleaned by UV ozone cleaning in order to remove adsorbed hydrocarbons and to improve the wettability before placing a drop of the solution on it. This cleaning procedure is essential to obtain stable and efficient adsorption. The surface of CaF2 is first masked with an aluminum plate which leaves an aperture of 4 mm diameter. Then, it is irradiated with UV light from a low-pressure Mercury lamp for 20 min in air. The distance between the sample and the lamp is a few millimeters. This UV ozone cleaning is efficient only in the area which is exposed to the light and the border between cleaned and none-cleaned area is used to constrain the region that is wetted by the solution. After irradiation with the UV light, the sample is rinsed with distilled water and subsequently dried. Next, 20 μl of solution is put on the surface and the sample is kept in a closed container to prevent evaporation. We find that, at room temperature, it takes three days for adsorption to reach equilibrium. The quantity of adsorbed 232Th is measured by comparing that of 232Th in the solution before and after adsorption. To measure the quantity of 232Th in the solution, we use the dye Arsenazo-III [25]. The color of the Arsenazo-III is originally red and becomes green when thorium ions are added, depending on the quantity of added Th. By observing the change of the transmission spectrum with an optical spectrometer, we can measure the thorium concentration.
Figure 1 shows the adsorption efficiency as a function of pH of the solution. No measurements have been performed at pH > 4 because precipitation starts in this pH range [24]. Stable complete adsorption is realized between pH = 2 and 3.5, and we use pH = 3 for the preparation of the samples described below. In comparison to [23, 24], where complete adsorption of Th on silica and alumina is observed between pH = 3 and 4, the results in figure 1 indicate a stronger binding of Th to the CaF2 surface, that may be related to the stronger ionic character of CaF2.
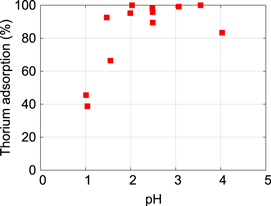
Figure 1. Adsorption efficiency of 232Th on a cleaned CaF2 surface as a function of pH of the solution. Complete adsorption is achieved between pH = 2 and 3.5.
Download figure:
Standard image High-resolution image2.2. Characterization of the 229Th sample
To prepare the 229Th sample, we repeat the same procedure described above with 229Th instead of 232Th. To characterize the sample, we first compare the UV transmission curve of a pure CaF2 substrate with one with adsorbed 229Th. Transmission spectra between 120 and 220 nm are shown in figure 2, which are measured using monochromatized synchrotron radiation at Metrology Light Source (MLS) [26]. Although a slight decrease of transmission is observed for the sample with adsorbed 229Th over the whole wavelength range, no strong absorption at a certain wavelength is noticeable. We also note that the small degradation of VUV transmission shown in figure 2 ensures that the reduction of a VUV fluorescence signal from 229Th due to absorption in the surface layer is less than 10%.
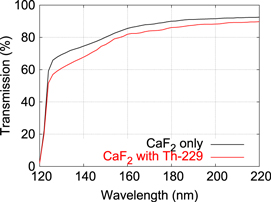
Figure 2. Comparison of transmission curves between pure CaF2 and CaF2 with adsorbed 229Th on the surface.
Download figure:
Standard image High-resolution imageNext, we investigate the spatial distribution of adsorbed 229Th using the emitted ionising radiation. Figure 3 (left) shows an autoradiograph picture of the 229Th sample. The 229Th solution used for the preparation of the samples was prepared several years ago and contains 229Th in radioactive equilibrium with all its progenies [27]. The distance between the sample and the film is 0.5 mm and the exposure time is 10 min. This picture shows that the distribution of adsorbed 229Th and its radioactive progenies is homogeneous over the area of the excitation beam (beam radius: 1 mm).
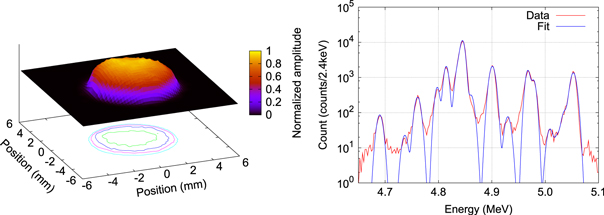
Figure 3. (Left) autoradiograph picture of the 229Th sample developed in this study. The picture shows the spatial distribution of adsorbed 229Th and its radioactive daughter elements. The four rings in the contour plot describe the normalized amplitudes 0.2, 0.4, 0.6 and 0.8 from outside to inside. (Right) α-spectrum of the 229Th sample. Sixteen peaks corresponding to the dominant α-decay lines of 229Th are identified by fitting with Gaussian functions.
Download figure:
Standard image High-resolution imageFor the quantitative estimation of 229Th, α-spectroscopy of the sample is performed. The spectrum obtained in a measurement time of two days is shown in figure 3 (right). The activity of 229Th is estimated to be 269(7) Bq based on the solid angle of the detector and the observed count rate, which is consistent with the value estimated from the 229Th content of the original solution. In repeated measurements we could quantitatively confirm that the adsorbed 229Th remains stably on the surface under heating up to 110 °C and irradiation with VUV radiation during this study.
In order to investigate the effect of a possible contamination layer around the 229Th nuclei via the lineshape of the α-spectrum, the data in figure 3 (right) is fitted with a combination of 16 Gaussian functions, corresponding to the dominant α-transitions [28]. The peak positions are fixed to the values listed in [28] while the amplitude of each Gaussian function and a common spectral width are taken as fitting parameters. As a result of the fit, the full width at half maximum of the spectrum is found to be 10.5(1) keV, which is consistent with the resolution of the silicon detector used for the measurement. We therefore conclude that the adsorbed 229Th is contained in a surface layer whose thickness is so small that its effect on the shape of the α-spectrum as tails or broadening of the line is not detectable here.
3. Experimental apparatus
3.1. Excitation and detection system
In order to excite the nuclear transition at about 160 nm, where a powerful and widely tunable laser is not easily available, we use undulator radiation from the MLS of the Physikalisch-Technische Bundesanstalt in Berlin [29]. The MLS is an electron storage ring dedicated to metrology with radiation in the spectral range from the THz- to the extreme ultraviolet regime. In one of its straight sections, the storage ring comprises a U125 undulator with N = 30 full magnetic field periods of 125 mm length each. The undulator spectrum basically consists of a set of quasi-discrete harmonics (with harmonic numbers n) with wavelengths following  -proportionality. The wavelength of the harmonics can be tuned by change of the magnetic field strength, i.e. change of the gap distance between the pole shoes. Thus, the MLS U125 undulator's first harmonic can be continuously tuned from about 65 nm through the VUV, UV, and visible spectral range up to infrared wavelengths of about 1200 nm. The spectral width of the first harmonic is given by
  , thus it is about 5 nm (full width) with the first harmonic at 160 nm. For the experiments, the undulator beam is focused by a toroidal mirror resulting in a beam size of about 1 mm radius at the sample position.
Figure 4 schematically shows the experimental setup used in this study, which includes a movable sample holder and a PMT. The sample holder can hold four samples and is equipped with CaF2 with adsorbates of 229Th and 232Th and with pure CaF2. The latter two samples and an empty position are used for reference measurements. Since VUV light around 160 nm is strongly absorbed by water, all samples are heated to above 100 °C in vacuum before measurement. Background pressure is always kept at 10−5 Pa or lower during all measurements described here. To detect photons in the VUV and UV wavelength ranges we use PMTs of the types (Hamamatsu Photonics GmbH) R7639 (diamond photocathode, sensitive from 115–230 nm) and R6836 (Cs-Te photocathode, sensitive from 115–320 nm). The quantum efficiency of R7639 is 40% at 155 nm, which is higher than that of R6836 (10% at 155 nm). The distance between the sample and the PMT is 8 mm, which leads to a solid angle collection efficiency of 0.1 for R7639 and 0.36 for R6836. As a result, the total photon collection efficiency is 0.03 for both R7639 and R6836, which includes the electron collection efficiency of 0.8. Both PMTs are operated in photon counting mode.
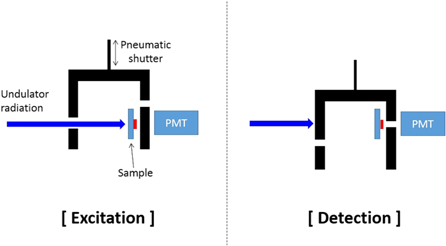
Figure 4. Schematic of the experimental setup for (left) excitation of the sample with undulator radiation and (right) the subsequent detection of photons from the sample with PMT. In order to achieve minimum deadtime caused by shutter operation, two shutters are attached to the same pneumatic linear slide. The sample is placed as close as possible to the PMT to efficiently collect photons from the sample.
Download figure:
Standard image High-resolution imageThe main chamber has two mechanical shutters (see figure 4). One is a beam shutter in front of the sample, the other is mounted between the sample and the PMT. To excite the sample, we open the beam shutter and close the PMT shutter. To detect the fluorescence from the sample after the excitation, we close the beam shutter and open the PMT shutter. To make dead time due to shutter operation as short as possible, both shutters are attached to the same pneumatic linear slide. As a result, the dead time between excitation and detection phases is only 10 ms. Great care is taken to prevent scattered light at the beam shutter.
It is well known that under irradiation with intense VUV light optical elements may get rapidly contaminated with surface layers from cracked hydrocarbons [30]. We found that the fundamental undulator radiation used in this measurement (wavelengths 130–350 nm) does not cause severe carbon contamination under the ultra-high vacuum conditions of our experiment. But the second and higher harmonics in the beam create the carbon contamination very rapidly. After irradiation for 3 min with the full undulator spectrum, transmission of the input window of our chamber decreases to less than 40%. To prevent the harmonics with wavelengths shorter than 120 nm from hitting the thorium sample, an additional filter made of MgF2 is installed in front of the chamber, protecting all elements behind the filter from the carbon contamination. Since the filter itself is now subject to darkening within the irradiated area, it is continuously moved during the measurements in order to obtain stable excitation power.
4. Irradiation of adsorbed 229Th with undulator radiation
4.1. Estimated nuclear fluorescence signal
For the very narrow nuclear transition the undulator device is effectively a broadband continuous radiation source and one may estimate the excitation rate based on the Einstein B coefficient and the spectral density of radiation intensity:

Here, P is the light power available in bandwidth  over the focus area A, τ is the lifetime of the 229mTh isomeric state and
  Hz the resonant frequency at 7.8 eV. This reasoning is independent of details of the electrodynamics of the transition and the only relevant nuclear parameter is the lifetime τ for spontaneous emission. So far, τ has not been measured experimentally. Theoretical predictions for an isolated nucleus at 7.8 eV transition energy are in the range of 1000 s to 1 h [31, 32]. In a solid, the decay can be considerably accelerated due to coupling with the surrounding electrons, either in radiative (so-called electronic bridge) or non-radiative processes [33, 34].
Taking the presented experimental parameters into account, figure 5 shows the predicted initial photon count rate after excitation as a function of the isomer lifetime. The photon flux of the undulator radiation is 100 photons s−1 per 1 Hz of spectral bandwidth at 160 nm. The number of atoms is 2 × 10¹³ within an excitation beam cross section of 3 × 10⁻⁶ m2. The selected excitation time is 500 s and the total photon collection efficiency is 0.03 as mentioned above. We take into account not only radiative decay but also non-radiative relaxation processes which are not detected by our measurement set-up. Both channels are modeled as exponential decay with time constants τ for the radiative lifetime (isomer lifetime) and  for the non-radiative decay. Curves plotted in figure 5 are for
  s (dotted), 100 s (dashed) and infinity (solid). The estimate shows that with a signal detection threshold of a few photons per second (determined by PMT dark counts and luminescence background) it should be possible in this experiment to observe the 229Th fluorescence for the range of predicted values of the isomer lifetime, unless non-radiative decay dominates, i.e.
  .
.
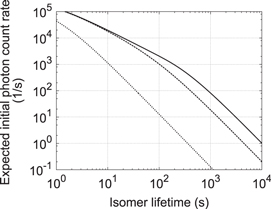
Figure 5. Expected initial photon count rate as a function of isomer lifetime. Both detectable radiative decay and undetectable non-radiative relaxation are taken into account. Exponential decay describing relaxation has two time constants: one is the isomer lifetime (horizontal axis) and the other is an additional non-radiative decay constant  . Curves plotted here are for
  = 1 s (dotted), 100 s (dashed) and infinity (solid). Excitation time is assumed to be 500 s.
Download figure:
Standard image High-resolution image4.2. Experimental results
Targeting a nuclear lifetime of 229mTh in the predicted range, we excite the 229Th sample for 500 s. Figure 6 (left) shows typical observed fluorescence signals from the sample. The origin of the horizontal axis corresponds to the beginning of the shutter operation to stop excitation and start detection. The data is averaged over five measurements. Gate time of the counting unit is 1 s. The lower (black) curve shows the signal obtained with the PMT R7639 which is sensitive in the wavelength range 115–230 nm. To investigate a wider wavelength range, we also use the PMT R6836 which is sensitive in the wavelength range 115–320 nm (upper, red curve). The constant level of PMT signals (65 counts s−1 for R7639 and 220 counts s−1 for R6836) is due to radioluminescence from the 229Th sample, i.e. Cherenkov light and scintillation light. The rates of dark counts of the PMTs are 5 s−1 (R7639) and 60 s−1 (R6836), respectively.

Figure 6. (Left) fluorescence signal from the 229Th sample after excitation at 160 nm for 500 s with two different PMTs. The black curve is obtained with the PMT R7639 which is sensitive to 115–230 nm and the red curve is observed with R6836 which is sensitive to 115–320 nm. The origin of the horizontal axis corresponds to the beginning of the shutter operation. These data are fitted by a single exponential function with constant offset, appearing here as straight curves. (Right) the exponential amplitude of the fitting function is shown as a function of excitation wavelength. Here we assume the decay time constant to be 100 s.
Download figure:
Standard image High-resolution imageIn order to investigate whether the obtained signals contain a fluorescence decay signal or not, we fit them by a function consisting of a constant offset and a single exponential function. No statistically significant decay signal is found. To obtain information on the scatter and uncertainty in the amplitude of the exponential function, it is left as the only free fit parameter, while the decay constant τ is fixed. In figure 6 (right), fitting results for both PMTs are shown as a function of excitation wavelength for τ = 100 s. No clear decay signal exceeding the noise level is observed. We also conduct the same analysis for different decay constants such as 50 s and 500 s. However, the results are similar to figure 6 (right).
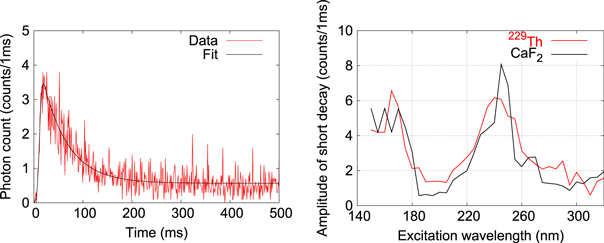
Targeting a nuclear lifetime shorter than one second, the photomultiplier signal within 500 ms after the excitation (for a time = 500 s) is analyzed. Figure 7 shows a typical signal taken by the R6836 with a gate time of 1 ms. A fluorescence decay with a lifetime of about 100 ms is observed both for 229Th-coated and pure CaF2 samples. In order to see the wavelength dependence of this signal, we fit the data by a combination of a Gauss error function and a single exponential function, which describes the shutter operation and decay of the fluorescence, respectively. In figure 7, the amplitude of the exponential function determined by the fitting is shown as a function of the excitation wavelength. At 160 and 240 nm strong fluorescence is observed. But, since they are observed not only for the 229Th sample but also for the pure CaF2 sample, we regard that these are emitted from the CaF2 substrate. The origin of the fluorescence at 160 and 240 nm is not clear so far. It is known that CaF2 shows emission of a self-trapped exciton around 270 nm under exposure to UV light [21]. But, the lifetime of such fluorescence is of the order of 1 μs. Again, no clear fluorescence related to 229Th nuclei is observed.
Figure 7. (Left) typical fluorescence decay signal observed within 500 ms after excitation. Data is fitted with a combination of a Gauss error function, which describes shutter operation, and a single exponential decay. The origin of the horizontal axis corresponds to the beginning of the shutter operation. (Right) amplitude of the exponential function derived from data fitting is plotted both for 229Th and pure CaF2 samples as a function of excitation wavelength.
Download figure:
Standard image High-resolution image
4.3. Discussions
Different reasons may be considered why no clear signal from excitation and decay of the 229mTh isomer is observed in this study. The isomer excitation energy or lifetime may be outside our detection range, or radiationless decay may prevent the observation of fluorescence. We have covered a range of excitation energies from 3.9–9.5 eV, corresponding to  to
to  around the result from γ spectroscopy 7.8(5) eV [1], that is generally accepted, but has not been confirmed in an independent experiment so far. The commonly accepted nuclear lifetime is around 1000 s, and our experiment is designed for this range. However, the electron bridge mechanism may make the nuclear lifetime much shorter [34]. If it is too short, our apparatus cannot detect the nuclear fluorescence because of the time required for operation of the shutters. There are theoretical predictions about the nuclear lifetime being much longer than 1000 s [35], which is also outside the sensitive range of our apparatus, because the excitation rate will be small and the fluorescence hidden in background noise of the photo detection.
Based on the large bandgap of the CaF2 substrate and the predominant tetravalent character of thorium compounds we do not expect radiationless decay to significantly reduce the isomer lifetime, because bound electronic resonances and ionization potentials of CaF2 and  are higher than the isomer excitation energy. This is confirmed by the absence of resonances in the VUV transmission spectrum of our sample (see figure 2). Phonon energies, on the other side, are much smaller than the isomer energy so that fluctuating electric charges or magnetic moments from adsorbate molecules or the substrate lattice would couple to the nuclear transition only in a high-order multiphonon process. However, without complete information on the structure of the Th adsorbate and about unexpected chemical compounds relating to, for example, the nitric acid used to optimize pH during sample preparation, we can not rule out radiationless decay with certainty. X-ray photoelectron spectra of Th(NO3)
 H2O have shown a broad structure around 5.6 eV [36]. If such compounds are formed, non-radiative decay due to internal conversion may shorten the isomer lifetime. More detailed information about the chemical environment around the adsorbed 229Th on CaF2 could be obtained by x-ray surface spectroscopy such as XPS or EXAFS [36, 37] or from electron energy loss spectroscopy.
5. Conclusion and future prospect
In this study, we present a newly developed adsorption technique, with which 229Th atoms can be prepared on a surface of CaF2. The 229Th samples prepared by this technique have been characterized optically and used for a search of the lowest-energy nuclear transition in 229Th. To investigate shorter or longer lifetimes of the nuclear transition, which are outside the detection range of our present apparatus, additional improvements are necessary. For a search in the range of shorter nuclear lifetime, excitation and detection should be done at the same time to eliminate the deadtime of shutter operation. For a possibly longer nuclear lifetime, additional averaging of fluorescence data would be required to reduce statistical noise from the background luminescence. For both cases, using a spectrometer to obtain wavelength information of the fluorescence signal should give us more detailed information. Detecting conversion electrons from the sample instead of photons may be an option to investigate radiationless decay.
Let us briefly mention a possible application of the adsorption technique developed here in the preparation of α-sources. Compared to an atomic layer prepared by electrochemical deposition [38], the layer prepared by adsorption may be cleaner and thinner. Adsorption could prepare a cleaner layer because the purity of the solution can be well controlled. The minimal thickness of the layer leads to very narrow 229Th peaks in the α-spectrum (figure 3 (right)) whose width is not degraded by a low-energy tail caused by energy loss of α particles within the layer. Such a thin layer of radioactive elements may be attractive for high resolution α-spectroscopy [39], for an efficient vapor source of short-lived radioactive elements such as 220Rn from 228Th [40], or as a source of recoil nuclei like 225Ra from 229Th [41].
Acknowledgments
We are grateful to U Kroth, M Richter and G Ulm for helpful discussions and their support of the experiments at MLS, to K Kossert, M Ehlers, S Hennig and R Dersch for their expert work on the sample preparation and characterization and to Chr Tamm, O A Herrera-Sancho, M V Okhapkin and N Nemitz for many fruitful discussions. A Y acknowledges support from the Alexander von Humboldt Foundation.
During revision of this manuscript, we learned about related work by J Jeet et al on a direct search using synchrotron radiation for the low-energy 229Th nuclear transition with 229Th-doped LiSrAlF6 crystals [42].