


Abstract
In this paper we study two cold atmospheric pressure plasma jets, operating in Ar + 2% air, with a different electrode geometry but with the same power dissipated in the plasma. The density profiles of the biomedically active NO and O species throughout the plasma jet, previously obtained by laser diagnostics, are calculated by means of a zero-dimensional semi-empirical reaction kinetics model. A good agreement between the calculated and measured data is demonstrated. Furthermore, the most probable spatial power distribution in an RF driven plasma jet is obtained for the first time by comparing measured and calculated species density profiles. This was possible due to the strong effect of the power distribution on the NO and O density profiles. In addition the dominant reaction pathways for both the NO and the O species are identified. The model allows us to obtain key information on the reactive species production inside the jet, which is difficult to access by laser diagnostics in a coaxial geometry. Finally, we demonstrate that water impurities in the order of 100 ppm in the gas feed can have a significant effect on the spatial distribution of the NO and O density.
Export citation and abstract BibTeX RIS

Content from this work may be used under the terms of the Creative Commons Attribution 3.0 licence. Any further distribution of this work must maintain attribution to the author(s) and the title of the work, journal citation and DOI.
1. Introduction
Cold atmospheric pressure plasma jets are currently drawing a lot of attention due to several promising applications in the field of medicine and biology [1]. The beneficial effects of these types of micro-plasmas are attributed to the cocktail of chemical species, UV-radiation and electric fields. Depending on the type of application, certain plasma agents are desired more than others. For example, nitrogen oxide (NO), oxygen atoms (O) and ozone ( ) are identified to play a key role in wound healing [2] and sterilization applications [3]. However, in the case of healing applications, the flux of such biomedically active species is critical as too high fluxes might lead to cell damage [4]. A detailed knowledge of the chemical composition of these discharges is therefore crucial. Furthermore, it is important to investigate how the chemical composition can be controlled by altering the operating conditions of the plasma jet (setup, gas feed, etc).
A lot of data can be obtained by a range of different diagnostic tools, however, experimental measurements are often expensive and time consuming. Moreover, several species or areas in the setup are often difficult to access by diagnostics. Numerical simulations, on the other hand, offer a large amount of information but have the disadvantage that the complexity of the plasma processes often has to be reduced by making assumptions. Therefore, a good validation of the model is necessary.
Comparing calculations with experiments is especially interesting when using modelling techniques that make a considerable simplification of the actual setup. Indeed, this is the case for the present work, as we make use of a semi-empirical zero-dimensional (0D) model to study the chemistry in the effluent of an argon RF plasma jet. This approach is very suitable for studying complex reaction kinetics that involve many species and reactions, while maintaining a reasonable calculation time. However, with a 0D simulation it is not possible to model (self-consistently) all the physical properties of the plasma at the same time. To this end, we use experimental data as input to maintain a good level of accuracy. Note that up to now, very few models are available for describing non-thermal plasma jets, and even less models include also a chemistry set able to simulate certain biomedically active species that have lower concentrations than the main plasma species. A summary of the current state of art in these models can be found in [5].
In a recent publication by Zhang et al [6], we showed a good quantitative agreement between model and experiment for the ozone density in the effluent of a RF driven  plasma jet. By means of a joint effort of the experimental measurements by UV absorption and a chemical analysis of the model output, it was possible to clarify the formation and destruction processes of ozone. The main goal of the present paper is to identify the reaction mechanism for NO and O in a power modulated RF driven plasma jet for two distinct electrode configurations. With this information, the density of these important biomedically active species in the plasma jet might be better controlled. Additionally, we will also investigate in more detail the effect of power modulation on the chemistry.
In the next section a brief description of the two types of plasma jet devices studied in this work is given, next to the operating conditions and the diagnostic tools that were used to obtain the experimental data. In section 3, we will explain how the numerical code was designed to mimic the important physical plasma properties such as ambient air diffusion and gas temperature. Section 4 will start with an investigation on how the species densities are affected by a modulation of the RF power and we will also compare the densities calculated by the model with the experimental data. Subsequently, we will show that the electrode configuration largely affects the power deposition profile, which results in a different chemistry and species density distribution in the effluent. Walsh et al already reported on the contrasting characteristics of such different plasma jet types [7], although mainly by optical emission spectroscopy. The next two subsections will elaborate on the reaction kinetics for both O and NO. Subsequently, the influence of feed gas humidity will be discussed, before arriving at the overall conclusion in section 5.
2. Experimental setup
The plasma jet source studied in this paper is an RF micro discharge generated inside a glass tube and flows freely into the surrounding humid air environment. The setup was previously characterized for a range of different operating conditions by Hofmann et al [8, 9], Zhang et al [6] and van Gessel et al [10–12]. Furthermore, the setup was also used in biological studies [13, 14].
A powered needle electrode is placed coaxially within the glass tube and the electric field is directed towards a grounded counter electrode for which two distinct configurations were designed. In a first configuration the electrode is ring-shaped and is placed over the glass tube. In the alternative case the electrode consists of a metal plate with a small hole in the centre, through which the plasma jet can freely propagate, and which is positioned 3 mm from the nozzle exit. Both configurations are displayed schematically in figure 1. It is clear that the electric field is orientated in a different direction in these two configurations (cross field on the left and linear field jet on the right) and this will strongly impact the chemistry in the effluent, as we will demonstrate in this paper.
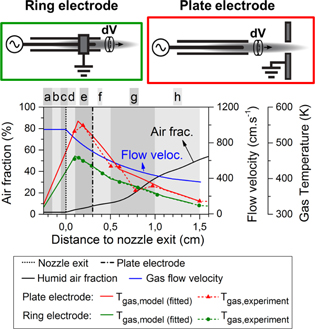
Figure 1. Schematic diagrams of the two different plasma needle configurations considered in this study, and input data used in the model (graph): humid air fraction diffusing into the argon stream (the same for both configurations; black curve); estimated flow velocity profile at the jet symmetry axis, based on 2D fluid flow calculations (again the same for both configurations; blue curve); and gas temperature profiles used in the model, for the two different electrode geometries, as obtained from the experiments as well as the fits used in the model (red and green curves, solid and dashed lines, respectively).
Download figure:
Standard image High-resolution imageFor this specific study, an argon gas feed of 1.0 slm is used, mixed with 2% of dry air. This argon gas mixture flows freely into a stationary humid air environment. The plasma is operated at a frequency of 13.9 MHz and modulated at 20 kHz with a 20% duty cycle.
It is important for this modeling study that the power deposited in the plasma can be determined experimentally. To achieve this, the total power is corrected for the power dissipated in the matching box as described in [8]. The resulting value for the plasma dissipated power is used in the numerical simulations to match the experimental conditions (see below). Although experiments were performed for different plasma dissipated powers, we will study the plasma at approximately 3.5 W dissipated power as a representative case in this paper.
The experimental data in this work are obtained by Rayleigh scattering to measure the gas temperature, laser induced fluorescence to measure the NO density in situ, and two-photon absorption laser-induced fluorescence to measure the O density. Moreover, a calibration step enabled the determination of absolute species densities. Finally, Raman scattering was used for evaluating the humid air fraction in the argon effluent. More details about these diagnostics and the measurement conditions and procedures can be found in [10–12, 15].
3. Model description
The model that is used in this work is based on the model reported in [5]. That paper describes the chemical properties of a needle-type argon plasma jet, such as the main plasma species and reactions. Those simulations were performed with a pure argon gas without any admixtures, except for some ppm level air impurities. Furthermore, the same numerical code was used for a follow-up study focusing in detail on the chemical reaction pathways of the biomedically important species [16]. The paper also contains a sensitivity study on the effect of ambient air humidity, total power deposition and gas temperature along the plasma jet effluent.
In addition, we demonstrated in [6] by comparing with experimentally obtained values (through UV absorption spectroscopy) that our model correctly describes the ozone density along the plasma jet effluent. Note that this also concerned a RF driven (needle-type) argon plasma jet, but with 2% oxygen admixture and operating at a power deposition of 6.5 W.
The numerical model used in this study is based on the original GlobalKin source code, developed by Kushner and co-workers [17]. A large  /
/ /
/ reaction set of 85 species, interacting by means of 302 electron impact reactions and 1626 heavy particle reactions is implemented, necessary to calculate the densities of biomedically active species at relatively low concentrations and for a broad parameter range. This reaction set is almost identical to the one used in Van Gaens et al [16]. The only modification is the addition of a vibrationally excited state for ozone,
  which resulted in more accurate model results. The reactions with this species are shown in table 1.
Table 1.
Modified reaction scheme for  and
and  compared to our previous modeling work [16], with reactions taken from [19].
| Nr. | Reaction | Rate coefficient |
|---|---|---|
| (A.1) | O +  + Ar + Ar   + Ar + Ar |
2.10 × 
  
|
| (A.2) | O +  + Ar + Ar   + Ar + Ar |
4.30 ×  exp(663/ exp(663/ ) )  
|
| (A.3) |
 + O + O   + + 
|
8.00 ×  exp(−507/ exp(−507/  
|
| (A.4) |
 + +  (a) (a)   + +  + O + O |
2.60 ×  exp(−1287/ exp(−1287/ ) )  
|
| (A.5) |
 + + 
  + +  |
3.00 × 


|
| (A.6) |
 + O + O   + O + O |
2.00 × 
 
|
In the literature it is described that 2/3 of the three-body association reactions of O and  forming
  generate this vibrationally excited state of ozone [18, 19]. Most of these
  molecules fall back to the ground state by physical quenching (A.5-6), but several chemical quenching reactions (A.3-4) are slightly accelerated as well, compared to the corresponding reactions of ground state
  molecules, which results in a lower overall
  density. This
  reaction mechanism, which was not included in our previous work, contributed to the smaller decrease in
  in the far effluent in the model compared to the experimental observation [6].
Several modifications to the original model enable us to evaluate the species densities and chemical reaction pathways throughout the effluent of a plasma jet propagating in an open humid air atmosphere. It is important to keep these assumptions in mind, which we summarize below.
First of all, we employ a pseudo-1D approach. In this approach we assume that the plasma jet is located within a cylinder area along the effluent and with a diameter corresponding to the inner diameter of the plasma jet tube (see figure 1). We divide this cylinder in segments with lengths that correspond to the distance that such a segment would move along the effluent within one time-step (order of μs), according to the flow speed of the gas at that position. The plasma properties for each cylinder segment are global averages over the volume of that cylinder segment.
Thus, just like in most 0D plasma kinetics models, we solve the (time dependent) conservation equations for all the plasma species and for the electron energy to see how the plasma properties change by moving further up the effluent. We simply use the gas flow speed to convert the time variable into a spatial variable, i.e., distance from the nozzle exit. The gas flow velocity follows from an external 2D numerical fluid simulation of a neutral gas at room temperature. Note that we assume that this gas flow velocity is similar for both electrode configurations.
The energy is supplied to the electrons by means of a power deposition density term in the electron energy equation that represents the Joule heating of electrons. In this way the average electron temperature can be determined which is then used to obtain the reaction rates for most electron impact reactions from the (continuously updated) look-up tables that are generated by an internal Boltzmann solver.
The plasma properties within the cylinder segment obviously change because it is subjected to a varying power deposition, gas temperature and ambient humid air diffusion, as a function of its position. For the last two of these important plasma parameters, we use experimentally obtained values as an input for our simulations (hence not calculated within the model).
The experimental data are obtained with spatial resolution in both the axial and the radial direction in the plasma jet. Thus, we compare our volumetrically averaged data points, on each position along the jet effluent (i.e., the axial dimension), with the radially averaged experimental density for the region up to 1 mm from the jet axis. Indeed, most of the active species can be found in this area, at least within 1–2 cm from the nozzle exit.
The experimental gas temperature profiles and the mixing of ambient air into the jet were already presented by van Gessel in [10, 12] for the effluent region but the exact input in our model is plotted again in figure 1.
The diffusion of (humid) ambient air is simulated by adding an artificial loss term for Ar and artificial source terms for  ,
,  and
and  O in the continuity equations of these species. In this way we mimic the gradual replacement of argon by ambient air in the jet effluent. Furthermore, as the air humidity is not controlled in the lab environment we use a common air humidity of about 50% relative humidity. Furthermore, the gas feed humidity is set to contain 100 ppm
  O (see also section 4.5).
As the experiments show that the gas temperature profile is very different in the two distinct plasma jet configurations, we also use a different input in our model. Obviously, the gas temperature significantly affects the chemistry, as many reaction rate coefficients are a function of this parameter [5].
The experiments indicate that the gas temperature starts decreasing in the effluent at 1–2 mm from the nozzle exit, along with the NO density. It is worth mentioning that from these experiments, however, it remains unresolved whether the temperature at this position is at the maximum, because inside the discharge tube no measurements have been performed. For the majority of this paper we assume for the calculations that a maximum in the gas temperature profile is indeed reached at this position (i.e., 1 mm from the nozzle exit). Moreover, we presume that the gas temperature begins to increase at the needle tip position (i.e., where also the power deposition is high), starting from room temperature as this is the temperature of the gas when entering the tube.
Note that we also performed a self-consistent temperature calculation (results not shown) which showed that the gas temperature rapidly rises inside the device but only towards the nozzle exit due to exothermic reactions. These highly exothermic reactions are mainly recombination processes of highly reactive species like radicals which are created by collisions of argon or nitrogen metastables with oxygen and water species. Due to the high flow speed the time is too short for a significant temperature rise in the device before this position (at least at this power). Close to the needle tip the electron energy is transferred efficiently to argon and nitrogen by inelastic collisions without much heat dissipation. However, these calculations were found not to be fully consistent with the experiments for the far effluent. These deviations are probably related to complex gas flow and mixing phenomena which influence the heat transfer. Therefore we opted not to adopt the calculated temperature profile but rather to use the experimentally measured gas temperature as input.
Nevertheless, at this stage we are not able to exclude the possibility that the gas temperature does not start rising earlier or more rapidly nearby the needle electrode. This is especially the case for the ring electrode configuration where most of the power is deposited within the plasma jet device, as we will demonstrate further in this paper. At the end of section 4.2 we will comment on the possible effect of such a temperature profile on the formation of O and NO. Also worth mentioning is that we identify several specific regions (a–h), as can be seen from figure 1, which will be used later in this paper to show how the dominant chemical reactions change throughout the effluent.
Another interesting feature of our model is that we can adjust how much power is transferred to the electrons, as a function of the distance from the powered electrode. We will demonstrate further in this paper that the power deposition profile varies significantly for the two plasma jet configurations.
In this work we also include the time modulation of the power deposition (kHz). This modification implies that the duty cycle of 20% is now taken into account, while maintaining the same time-averaged power deposition of 3.5 W. To achieve this, we multiplied the power deposition profile with a factor 5, but this power is 'ON' only 20% of the time. Indeed, this is the power that a gas segment would feel, flowing along the powered needle electrode and beyond. However, the next segment (that follows the previous one) experiences a power deposition at different positions along the effluent. Therefore, we performed simulations for five different kHz modulated power profiles, averaged the results and compared this average with the experimental data for the NO and O density. This is acceptable because the absolute density measurements are performed with high temporal resolution but are always accumulations of a large number of laser shots and thus are intrinsically averaged in the same way.
One of these five modulated power profiles is shown in figure 2 for the ring electrode geometry. Note that the power is instantaneously five times higher than the time-averaged power deposition, plotted in the remainder of this paper (figures 4–6).
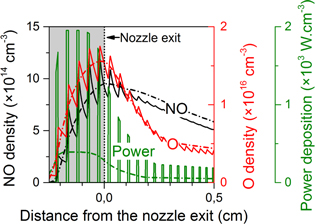
Figure 2. Power deposition profile experienced by a random volume element travelling along the effluent in the case of a 20% duty cycle (full green curve; right axis). The resulting NO and O density profiles inside the plasma jet device (grey region) and in the first few mm after the nozzle exit are also displayed (full black and red curve, respectively). Additionally, also the calculated profiles for an equivalent continuous power deposition are shown by the dash-dotted curves.
Download figure:
Standard image High-resolution image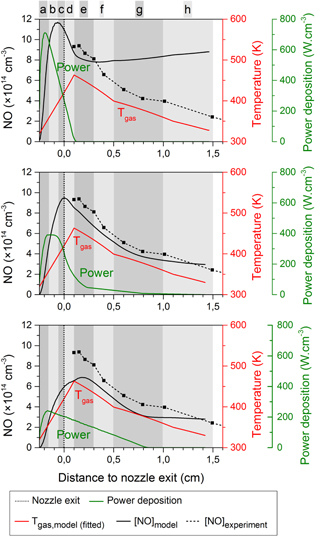
Figure 4. Calculated NO density profiles (black solid lines, left axis) for three different power deposition profiles (green curves, right axis). Also shown are the experimental NO density profile (black dashed lines), and the fitted gas temperature profile (red curves) for the ring electrode configuration.
Download figure:
Standard image High-resolution image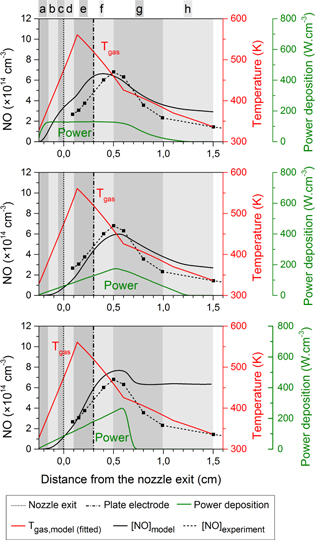
Figure 6. Calculated NO density profiles (black solid lines, left axis) for three different power deposition profiles (green curves, right axis). Also shown are the experimental NO density profile (black dashed lines), and the fitted gas temperature profile (red curves) for the plate electrode configuration. The vertical dash-dotted line at 3 mm from the nozzle exit denotes the position of this plate electrode.
Download figure:
Standard image High-resolution imageOne can see that the O and NO densities vary by a factor of 2–3 at maximum during the duty cycle, and these variations are only observable inside the plasma jet device or in the first few mm after the nozzle exit. The corresponding data for the grounded plate electrode geometry are very similar and not shown.
It turns out that, after averaging the five different power modulated profiles, we observe rather small differences in the species density profiles compared to the simulations with a five times lower, but continuous power (i.e., maximum 20% difference, dependent on the position in the effluent, see figure 2). This is because in general the chemistry for O and NO only scales up, but the relative importance of the various reactions does not change drastically. Indeed, within this power range, when delivering more energy to the electrons by increasing the power, the electron temperature does not change much. Thus, the ionization degree of the plasma must rise to maintain the same electron energy density. Therefore, the reaction rates of all electron impact reactions for the generation of the reactive species rise as the density of one of the reactants has increased (i.e., the electrons) while the rate coefficients stay the same, so the same chemical pathways continue to be favoured. The experiments of van Gessel et al [12] indeed demonstrated that the electron temperature only slightly changes when the power increases fivefold.
Note that the temperature profile is fitted to an experimentally measured profile (with the power modulation) and this profile is used for all our simulations, either with a modulated or with a continuous power profile. Indeed, it was found by [10] that the gas temperature practically does not vary during a duty cycle.
Important to mention is that our power deposition profile shown in figure 2 includes the kHz modulation but not the RF frequency used in the experiment. This should be acceptable, as we study primarily the neutral chemistry which is much slower than the RF period. Thus, it should be sufficiently accurate that the total deposited power for the calculations is equivalent to the experimentally measured plasma power deposition, as long as the bulk chemistry does not change by neglecting the RF frequency. Our previous work showed that this assumption is valid under the given conditions [6].
The main advantage of our 0D modelling approach is the possibility to implement a large chemistry set of an Ar/ /
/ /
/ O mixture to simulate the densities of the biomedical species (which are often not the main plasma components) without excessive calculation times, and at the same time to stay close to the experimental conditions.
4. Results and discussion
4.1. Time modulation of the  (A) density

As a validation of our approach concerning the power modulation (see section 3), we will first discuss the calculated densities of species that are strongly affected by this power modulation. More specifically, we will investigate the  (A) molecules, as they are very important precursors for both NO and O production. One can see that the
  (A) density exhibits a much more pronounced time modulation than the NO and O ground state densities (see figure 2 above and figure 3 below). Indeed, van Gessel et al [10] and Zhang et al [15] found that both the NO and O ground state densities are not strongly affected by the power modulation and are constant as a function of time.
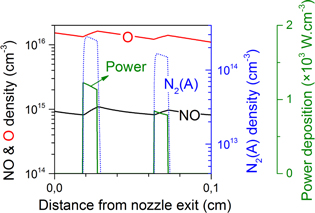
Figure 3. Densities of NO, O (black and red curve, respectively; left axis), and  (A) (blue dotted curve; first right axis) in the first mm after the nozzle exit, for a random volume element travelling along the effluent in the case of a 20% duty cycle. The power deposition resulting from these voltage pulses is also displayed (green curve; second right axis).
Download figure:
Standard image High-resolution imageIn the work of van Gessel et al [10] it was reported that, during the calibration, a lifetime of 24 ns was obtained for NO(A) in the plasma, i.e., the electronically excited state of NO. However, the authors did not observe that the density of this species was modulated by the RF cycle (period of 72 ns) although its lifetime is shorter than the RF cycle. The NO(A) is thus most likely not created by electron impact excitation. Therefore, the authors argued that excitation to the NO(A) state is most likely to occur by a collision with  (A):
(A):

Because  (A) is a metastable state, this would explain why the NO(A) density is unaffected by multiple RF cycles as well as its slow decay (about 0.7 μs) after the RF power is turned off [10].
Note, however, that the NO(A) state is not included in our model. This is justified because the NO(A) state has a low energy content and does not react much differently than the NO ground state itself. Therefore, we decided to implement the total quenching of  (A) by NO simply as follows:
More importantly, as we already demonstrated in [16], O and  O are the dominant quenchers of
  (A) and not NO.
Figure 3 illustrates the calculated species densities of NO, O and  (A) when a voltage pulse with a 20% duty cycle is applied. Although NO(A) is not included, one can easily see that in about 1 μs after the voltage pulse (power is switched on for 10 μs) the calculated
  (A) density drops by several orders of magnitude. This is very similar to the experimental 0.7 μs decay time of NO(A), which is created from
  (A) (see reaction (1)). Therefore, we can conclude that there is a good (yet indirect) correlation between the model and the experiments, concerning the voltage pulses.
In addition, in the work of van Gessel et al [10] it was shown that the NO(A) density keeps increasing during the pulse. This might seem contradicting with our calculations, because the  (A) density slightly drops in the second part of the voltage pulse. However, the ground state NO molecules, which are the other reactant in reaction (1), keep increasing during the pulse, so the overall reaction rate for NO(A) production will indeed continue to increase while the power is on. The reason for the rise in the ground state NO density can be found in the increasing O density during the pulse, as O atoms are involved in several NO production pathways (see section 4.3).
4.2. Power deposition profiles and their effect on the NO and O density profiles
In our previous studies, we assumed a triangular power deposition profile with a maximum at the electrode and a gradually decreasing slope throughout the effluent. This was done both for simplicity and due to the lack of experimental data. However, such a profile does not perfectly represent the electric field for the grounded ring electrode nor for the grounded plate electrode. Obviously, in the latter case the electric field is directed more towards the effluent, so a significant power deposition is also expected further in the effluent. For the ring electrode case we will show later in this section that almost all of the power is deposited more closely to the powered electrode needle tip.
To investigate the power deposition profile, we performed a sensitivity study on the effect of several different power deposition profiles on the calculated NO and O density profiles which are also experimentally obtained.
More specifically, we studied the case where all power is deposited very close to the powered needle electrode tip (cf ring electrode configuration), as well as the case where the power deposition gradually starts increasing at the needle tip and reaches a maximum even beyond the grounded plate electrode (cf plate electrode configuration), and several different profiles in between. The calculated NO and O density profiles can then be compared with the experimental data for the two electrode configurations, see figures 4–7. Because the chemistry of the O atoms is related to the NO formation, we will first discuss figure 4 for NO and figure 5 for O for the ring electrode configuration before analysing the results of the plate electrode in figures 6 and 7.
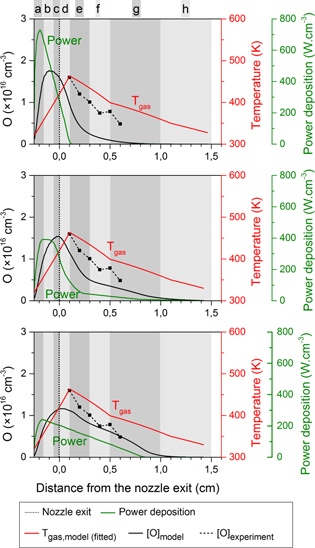
Figure 5. Calculated O density profiles (black solid lines, left axis) for three different power deposition profiles (green curves, right axis). Also shown are the experimental O density profile (black dashed lines), and the fitted gas temperature profile (red curves) for the ring electrode configuration.
Download figure:
Standard image High-resolution image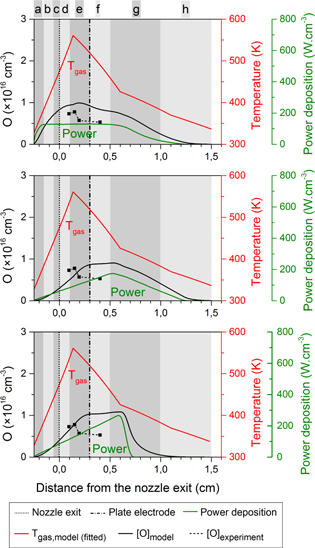
Figure 7. Calculated O density profiles (black solid lines, left axis) for three different power deposition profiles (green curves, right axis). Also shown are the experimental data points for the O density (black dashed lines), and the fitted gas temperature profile (red curves) for the plate electrode configuration. The vertical dash-dotted line at 3 mm from the nozzle exit denotes the position of this plate electrode.
Download figure:
Standard image High-resolution imageThe first power deposition profile from the top graph of figure 4, where almost no power is deposited beyond the nozzle exit, results in a narrow NO peak before the nozzle exit. This NO density profile does not agree well with the experimental density profile. This suggests a deficiency of reactive species, out of which NO is generated (such as N and  metastables, see section 4.3), already shortly after the nozzle exit. The overestimated NO density in the far effluent is more difficult to explain and requires a detailed understanding of the reaction chemistry, which will be analysed further in this paper.
In the bottom graph of figure 4 the maximum NO density is found several mm beyond the nozzle exit, hence pointing out that initially too few reactive nitrogen species, out of which NO is formed, are generated. Moreover, the maximum density is clearly lower than the experimentally measured maximum value. Further in the effluent, the NO density drop is clearly too steep. We will demonstrate later in this paper that this can be related to an over-production of O atoms in that region, see also figure 5.
The intermediate case of figure 4 matches the experimental NO profile both quantitatively and qualitatively. Here, most of the power is still deposited inside and close to the discharge tube, but it drops more gradually to low values at 0.3 cm from the nozzle exit (the power deposition becomes zero at 0.8 cm from the nozzle exit).
When consulting the calculated O density profiles for the different power deposition profiles in figure 5, it becomes clear that the power deposition of the middle graph shows once more the best agreement with the experimental data. For the top case the decrease in power deposition is too abrupt, resulting in an O density drop that is too steep. In the bottom case the power is distributed over a too large region and the maximum O density is therefore clearly too low compared to the experimental values.
The quantitative difference between simulated and experimentally measured densities is only a factor 2 at maximum, which can be expected given the assumptions of our model and the uncertainty on the input data, for example the rate coefficients and the accuracy of the density measurements.
In figure 6 the calculated NO density profiles for the plate electrode configuration are evaluated, again for three different power deposition profiles. An important feature of this type of plasma jet configuration is that the jet is longer. Recall that the electric field direction is more in line with the symmetry axis of the jet, so the power deposition is expected to be more homogeneous throughout the effluent.
The power deposition profiles from the top and middle graph of figure 6 result in quite similar NO density profiles. The calculated values correspond well with the experimental data. In the middle graph the profile shows a maximum density at exactly the same position in the effluent as in the experiment. However, experimentally it was found that the power density remained constant with increasing power as a corresponding increase in plasma size with increasing power was found [8]. This suggests that the power profile of the top graph of figure 6 corresponds better to the experiment, although the agreement of the simulated and experimentally measured NO density is not as good. Furthermore, the power deposition profile of the top graph is based on the profile of the middle graph of figure 4, but more extended in the effluent. Finally, the simulated O density profiles for the plate electrode configuration is also consistent with the power deposition profile of the middle graph in figure 7. Therefore, we will use this specific case for the chemical analysis in the next section.
The bottom graph of figures 6 and 7 clearly shows that too much power is deposited far away from the nozzle exit (even beyond the plate electrode), resulting in O and NO densities that are much too high beyond the plate electrode. It is, however, interesting to see that the maximum NO density is still located at about the same position, which demonstrates that it is not possible to get an NO peak even further in the effluent, not even by placing the majority of the power deposition profile further away from the nozzle exit.
To conclude, one can clearly see that the distinct power deposition profiles result in remarkably different O and NO density profiles. In general, the NO density is higher for the ring electrode configuration (with a maximum density of 9 × 
 ) and it peaks closely to the nozzle exit, whereas for the plate electrode configuration the NO density is generally lower (with a maximum density of about 6 ×
 ) and it peaks shortly after the jet passes through the grounded plate electrode.
The O density profile of the ring electrode configuration also exhibits a peak close to the nozzle exit, i.e., similar to the NO density. Its maximum density is more than an order of magnitude higher than the maximum NO density (i.e., 1.5 × 
 ), but the density drop is steeper as a function of distance from the nozzle exit. In the effluent of the plate electrode the O density is generally lower, but the concentration of this species fluctuates around 8-9 ×
 even up to 0.5 cm from the nozzle exit.
The validity of the chosen power deposition profiles is further confirmed by the experimental observations of the electron density profiles (and also the intensity of the light emission) for both plasma jet configurations [12]. Indeed, the experiments indicated that the plasma intensity rapidly drops in between 1 and 3 mm from the nozzle exit for the ring electrode configuration, whereas the active plasma can be found up to 8 mm from the nozzle exit for the plate electrode configuration. This corresponds well with the power deposition profiles used in our calculations which give the best fit for the O and NO density.
Although, we demonstrated good correspondence between the model and experiment we will also address here the possibility of a slightly different temperature profile within the plasma jet device. As mentioned previously, there is no experimental data available on the temperature and species densities for that area. Up to now we assumed that the ring electrode configuration is corona-like with most of the power deposited in close proximity to the needle electrode tip. However, one might argue that this configuration has some characteristics of a broader axial dielectric barrier discharge with plasma formation over the entire length of the ring electrode that surrounds the glass tube. Also, in this case it is likely that the temperature will reach its maximum value earlier than at the nozzle exit. Therefore, we performed a simulation mimicking these characteristics and the results are plotted in figure 8.
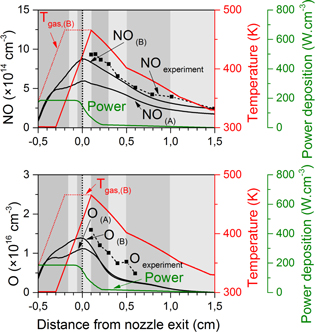
Figure 8. Calculated NO and O density profiles (black solid lines, upper and lower graph respectively) for the ring electrode configuration for a power deposition profile representing a more DBD-like discharge (A), in contrast to the corona-like profile used in figures 4– 7. The graphs also contain NO and O density profiles for the DBD-like power deposition profile and a higher gas temperature within the plasma jet device (B). This modified gas temperature profile is indicated with the dotted red curve, the DBD-like power deposition profile is indicated with the green curve (both with axes on the right).
Download figure:
Standard image High-resolution imageBy comparing figures 4 and 8, we can conclude from this simulation that the NO density profile (indicated with  ') is indeed affected by this different power deposition profile. However, when also the different temperature profile (indicated with
  ') is applied, the NO density profile (indicated with
  ') again becomes remarkably similar to the case of a corona-like power deposition profile as discussed above (see figure 4). This is because a higher temperature within the device compensates for a lower power density. Indeed, a lower power density results in a lower amount of reactive species out of which NO is created (see section 4.3) but the temperature dependent rate coefficients of these reactions increase.
Similarly, by comparing the two O density profile of figure 8 with figure 5 (middle graph) we can conclude that the generation of O atoms, which are created by electron impact reactions (see below) is affected differently because gas temperature variations have less influence on these reactions. Thus, a high power density at a lower temperature results in more O atoms nearby the needle electrode (see figure 5), even though the area of high power deposition is smaller and the total amount of power dissipation is the same.
We acknowledge that the power distribution and temperature within the jet is important, however additional (experimental) research is necessary to clarify this. However it has a limited effect on the NO and O density in the effluent and will not change the conclusions made about the effluent chemistry in this work.
The following two sections will elaborate more on the NO and O chemistry which will help to explain the specific shape of their density profiles. In the remainder of this paper, we will use the power deposition profile of the middle graph of figures 4 and 5 for the ring electrode configuration and the power deposition profile of the top graph of figures 6 and 7 for the plate electrode configuration, as they yield good agreement with experiment for the NO and O density profiles.
4.3. NO chemistry
In this section the chemical reactions for the production and loss of NO throughout the plasma jet will be analyzed for both electrode configurations. The rates of the reactions shown in figures 9 and 10 are spatial averages for a specific region in the jet. In some regions of the plasma jet the chemistry changes more rapidly than in others and therefore the averaging is performed over different spatial lengths in the axial direction (corresponding to the letters a–h in figure 1). The power deposition profiles used for the ring and plate configuration are taken from the middle graph of figure 4 and the top graph of figure 6, respectively.
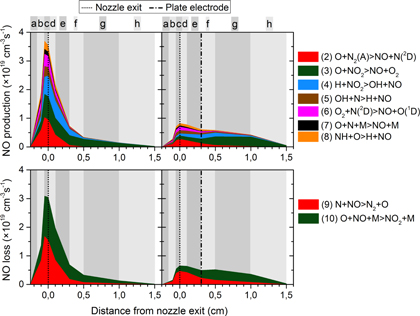
Figure 9. Most important chemical production and loss processes for NO throughout the plasma jet, for the ring electrode configuration (left) and plate electrode configuration (right).
Download figure:
Standard image High-resolution image
Figure 10. Most important chemical production and loss processes for O throughout the plasma jet, for the ring electrode configuration (left) and plate electrode configuration (right). The alphabetically numbered reactions in the legend are not explicitly stated in the text and therefore follow a separate numbering.
Download figure:
Standard image High-resolution imageFigure 9 clearly illustrates that the predominant production and loss pathways are largely the same for both electrode configurations, although the relative contributions and the total rates can be quite different depending on the region. Indeed, both the production and loss rates are more than a factor 3 higher in the ring electrode configuration than in the plate electrode configuration. In both configurations the rates are the highest close to the nozzle exit, but for the ring electrode configuration they immediately drop drastically beyond that position whereas for the plate configuration the rates only slightly decrease throughout the effluent. This is of course directly correlated to the power deposition profiles, see figures 4 and 6. Indeed, in the ring electrode configuration, the power deposition profile is more concentrated inside the device and just after the nozzle exit, whereas in the plate electrode configuration, it extends till some distance beyond the plate electrode.
4.3.1. Production of NO
Several processes contribute to the NO production both inside the device and in the effluent for both electrode configurations:


The first three processes seem to be dominant, especially for the ring electrode setup. For more details on these reactions and species, we refer to Van Gaens and Bogaerts [5].
To a lesser extent, also the reaction between  and
and  and the three-body association reaction between O and N (with any gas molecule M as third body) contribute to the NO production:


Finally, also the reaction of NH with O contributes to some minor extent to the production of NO in the effluent:

It should be noted that this reaction actually takes over the role of reaction (6) after the nozzle exit because, in the presence of water,  rather reacts with water to form NH instead of reacting with
  . Indeed, water is present in the jet as impurity but the water fraction also rapidly rises after the nozzle exit due to the mixing with humid ambient air.
Note that reaction (2) was also identified by Guerra et al as an important production channel of NO for an Ar/ /
/ surface microwave plasma [20]. Furthermore, reactions (2) and (6) are similar to the Zelʼdovich reaction mechanism, which is well studied in the combustion community [21]. Obviously, as combustion applications occur at high temperature, three-body association reactions, such as reaction (7), will not be important at these conditions, because the rate coefficients drop significantly upon higher temperature. Furthermore, due to the high temperatures, a reaction between ground state molecules or atoms is possible in combustion, whereas for cold plasmas activation to electronically excited states, such as
  (A) and
  in reactions (2) and (6), is necessary.
It is also important to mention that reactions (3) and (4) can be seen as the regeneration of NO because  is first created out of NO itself (in loss process (10)). Nevertheless, such regeneration processes are very important and they greatly affect the NO density profile; otherwise NO would be removed almost immediately when the power drops.
4.3.2. Loss of NO
As far as the loss of NO is concerned, the only two processes that play a significant role, in the entire plasma jet for both electrode configurations, are the reactions with N and O atoms:


Note that the first process is a two-body reaction, whereas the second process is a three-body reaction involving any background gas molecule (M) as the collision partner.
4.3.3. Explanation of the NO density profiles
After identifying the most important production and loss reactions, we can now compare the chemistry and also explain the NO density peak beyond the plate electrode for that setup.
We see that, for the plate electrode configuration, several of the production processes will decrease significantly beyond the nozzle exit, especially reactions (2), (6) and (7). In these reactions nitrogen species, such as  (A), N and
  , are involved. The reason that the rates of these reactions decrease is that the electronically excited
  (A) state is very efficiently quenched by
  O and that both N and
  are created mainly by a dissociation of this
  (A) state, rather than from ground state
  [5]. Obviously the
  O concentration rapidly rises in the effluent due to ambient air diffusion.
On the other hand, the rates of the NO regeneration reactions involving O and H atoms (i.e., reactions (3) and (4)) increase in the effluent of the plate electrode configuration because of increasing  and
and  O levels (again due to ambient air diffusion) while the power deposition stays constant. We want to stress once more that this is thus regeneration of
  into NO and not the creation of 'new' NO. This regeneration mechanism is clearly not very important for the ring configuration because the power deposition in the effluent is not sufficient to yield a large production of either O or H.
Additionally, the loss processes also play an important role in determining the NO density peak beyond the plate electrode. Recall that the gas temperature is significantly higher for the plate electrode configuration than for the ring electrode configuration (see figure 1). Therefore, the three-body loss reaction (10) is suppressed even far in the effluent of the plate electrode configuration, as this reaction type is typically slower at higher temperature. The lower gas temperature in the ring electrode configuration aids to the fact that the NO destruction becomes larger than the production already shortly beyond the nozzle exit. Nevertheless, even for the plate electrode configuration the loss will eventually become larger than the production (i.e., shortly after the plate electrode), although this might be difficult to see in figure 9 as the difference is so small.
Overall, it can be deduced from figure 9 that for the ring electrode configuration the absolute difference between total production and total loss rate is, depending on the region, much higher than for the plate electrode configuration (i.e., at the maximum the values are 3.6 × 

 versus 3.0 ×

 for the ring electrode configuration, and about 8.0 ×

 versus 7.0 ×

 for the plate electrode configuration). The fact that the net NO production is positive for a larger part of the effluent in the case of the plate electrode clearly cannot compensate for this because the maximum NO density is much lower for the ring electrode configuration, even though the calculations are performed for the same power in both configurations.
4.4. O chemistry
The dominant chemical processes for O formation and loss are displayed in figure 10 for both electrode configurations, in a similar way as in section 4.3.
The total O production rate for the ring electrode again abruptly drops after the nozzle exit following the power deposition profile which is only high inside the device and just after the nozzle exit, whereas the loss rates decrease more gradually. Therefore, the total O loss rate becomes significantly higher than the total O production rate beyond the nozzle exit (i.e., starting from region e).
For the plate electrode configuration, the total O production rate also drops beyond the nozzle exit, although the decrease is less steep than for the ring electrode. This is somewhat unexpected as the power deposition stays constant and the  concentration keeps rising by ambient air diffusion. The total loss of O atoms, however, does not follow the decreasing trend of O production and reaches a maximum shortly after the plate electrode which is also the position where the O density decrease becomes more steep (see figure 7).
Finally, figure 10 shows that the same reactions are dominant for both configurations, although the absolute rates and the relative contributions greatly vary throughout the plasma jet. Similar to the NO chemistry, the O production and loss rates are two to three times larger in the case of the ring electrode compared to the plate electrode configuration.
4.4.1. Production of O
The O atoms are mainly generated by the dissociation of molecular oxygen through various pathways, i.e., by electron impact dissociation and by collisions with electronically excited argon atoms (Ar*), argon excimers ( *) and nitrogen metastables (
 (A)), see first four production reactions in figures 10 ((A)–(D)).
Furthermore, the quenching of  ) upon collision with any gas molecule M (i.e., physical quenching) also contributes to a large extent to the O production (see reaction (E) in figure 10). This process is, however, not an actual production pathway because
  ) is formed out of the O atoms by excitation (see also [5]).
Finally, as was the case for NO, a non-negligible amount of the O atoms is produced in a chemical regeneration reaction:

as NO is (mainly) created from O itself (see section 4.3 above).
4.4.2. Loss of O
The predominant loss processes of the O atoms, i.e., excitation to  ) upon collision with
  (A) metastable molecules or electrons (see reactions ((F)–(G)) in figure 10), are in fact no real destruction pathways, as this excited state is physically quenched back to the ground state O atoms (reaction (E) in figure 10 and see also [5]). Near the nozzle exit, the collisions of O atoms with OH and
  , rapidly gain importance:


These processes are in fact part of a cycle in which also reaction (14) is involved:

Thus, after the generation of H from  O, the H atoms are converted into
  radicals (reaction (14)) which are subsequently reduced to OH (reaction (13)). The cycle ends with a further reduction, creating H atoms again (reaction (12)). Previously, this mechanism has been reported by Komuro et al [22] and Verreycken and Bruggeman [23]. In these three processes there is a net loss of two O atoms and a net production of one
  molecule.
The other loss processes shown in figure 10 (producing  ,
,  ,
,  and NO; reactions ((H)–(L)) all contribute to about the same extent, both inside the device and in the effluent for both electrode configurations.
4.4.3. Explanation of the O density profiles
The efficient H-cycle for the destruction of O atoms (involving loss processes (12) and (13)) can explain the observed trends in figure 5, where the density of the O atoms in the ring electrode configuration decreases quite drastically shortly beyond the nozzle exit (by a factor 3). Note that beyond 3 mm from the nozzle exit the drop in O density is less steep because there is still a low amount of power deposited up to 8 mm beyond the nozzle, as is clear from the middle graph of figures 4 and 5. Recall that sufficient O atoms are required to convert NO into  and thus to lower the NO concentration. The presence of O atoms, even far from the discharge tube, was previously reported by Waskoenig et al [24] and Reuter et al [25].
From the loss processes of the plate electrode configuration it becomes clear that, for a constant power deposition, this H-cycle for the destruction of O atoms becomes more and more efficient in the effluent due to (humid) ambient air diffusion. Of course H atoms can also be created from the initial water impurities in the gas feed and figure 10 indeed indicates that there is a considerable loss of O atoms by the H cycle even within the device.
Although it is difficult to see from figure 10, it can be deduced that the loss becomes greater than the production in region e for the ring electrode configuration (6.4 × 

 versus 3.7 ×

 ), whereas this happens only in region f for the plate electrode configuration (6.3 ×

 versus 5.6 ×

 ), thus beyond the plate electrode.
It is very clear that the H atom generation is important both inside the device and in the effluent, and plays a significant role in determining the O density profile. Recall that H was also important for NO (re-)generation (at least for the plate electrode configuration) as the H atoms reduce  (reaction (4)) after NO is oxidized to
  (reaction (10), see section 4.3).
4.5. Influence of water impurities
Finally, we discuss the effect of varying the water impurity level in the initial gas feed on our calculation results, as we showed in the previous sections that the H-containing species are very important for the NO and O concentration in the plasma jet. The importance of the feed gas humidity was recently reported by Winter et al [26]. Note that this parameter is difficult to control in an experiment, even if the setup is flushed for several minutes or even up to hours.
Figure 11 displays the effect of 1 ppm, 100 ppm and 500 ppm water impurity in the Ar + 2% air feed gas on the NO density. The model indeed predicts a considerable influence of the water impurities on the maximum NO density for both electrode configurations, although the shape of the NO density profile does not change much. In general, only the relative contributions of the different loss and production reactions change (data not shown), which still leads to a total decrease of the maximum NO density of about 38% when we increase the water impurity level from 1 ppm to 500 ppm.
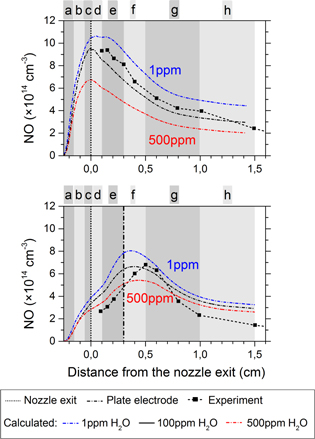
Figure 11. Influence of ppm water impurities on the calculated NO density profiles for both the ring and plate configurations (upper and lower graph, respectively).
Download figure:
Standard image High-resolution imageAlthough the rate of NO production processes (4) and (5) (with H and OH as reactants) should increase for a higher feed gas humidity, as both OH and H are generated in higher amounts when the feed gas humidity increases, we still see the opposite correlation for both electrode configurations.
First of all, this is caused by the efficient quenching of  (A) by water, lowering the production of NO through reaction (2). Recall that N radicals are also created from
  (A), as already mentioned above, and so the reactions (5), (6) and (7) are inhibited (indirectly) as well.
Secondly, the NO generation will also be influenced by reactions where O atoms are involved and this concerns both the production (reactions (2), (3), (7) and (8)) and the loss (reaction (10)) pathways for NO. Therefore, we must first take a look at the effect of the water impurity level on the O density, and this is shown in figure 12. It is very clear from these graphs that the O density increases when the feed gas is more dry for both the ring electrode and the plate electrode configuration. Nevertheless, it is not evident to quantify the net effect on the NO density because O atoms will influence both the production and the loss of NO.
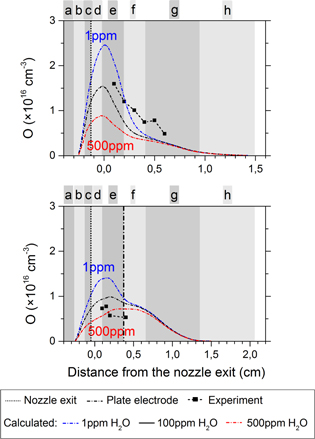
Figure 12. Influence of ppm water impurities on the calculated O density profiles for both the ring and plate configurations (upper and lower graph, respectively).
Download figure:
Standard image High-resolution image
For the ring electrode configuration the maximum O density is 70% lower for 500 ppm water in the gas feed than for 1 ppm. For the plate electrode configuration the decrease is only 45%. This is like expected because, for the ring electrode configuration, most of the O radicals are formed just after the nozzle exit where the humid air diffusion is not yet very large and where the feed gas humidity is thus absolutely crucial. After a few mm from the nozzle exit, the water concentration in the jet rises to the level of percentages, which is of course significantly higher than the amount of water that originates from water impurities in the discharge tube. This explains why the effect is less pronounced for the plate electrode configuration.
The reason for the rapidly decreasing O concentration upon increasing feed gas humidity is twofold. First, the production of O radicals is lower because  (A) (involved in reaction (D) of figure 10) is efficiently quenched by water. Second, the destruction of O atoms will be higher at increased humidity since more H-containing species that quench O atoms (see reactions (12)–(14)) are produced at higher water concentrations.
5. Conclusions
In this paper we demonstrated a good agreement between our semi-empirical 0D kinetic model and experimental observations for two distinct cold atmospheric pressure plasma jet setups. The model provides chemical information on O and NO and their reaction pathways, even for regions that are not accessible by optical diagnostics.
We observed that the power distribution in the effluent is very different in a cross field and in a linear field plasma jet (i.e., the setup with a grounded ring electrode and plate electrode, respectively). For the latter, the electric field is oriented in the same direction as the gas flow, which allows power dissipation much further from the nozzle exit causing a longer plasma plume (i.e., for the investigated plasma jet setup about 8 mm for 3.5 W). Moreover, the power dissipation seems to be more or less constant over the entire length of the visible plasma plume in the linear field jet. In the case of the cross field, the main power deposition is restricted up to a few mm from the nozzle exit (i.e., for the investigated plasma jet setup about 3 mm for 3.5 W). Hence, the power density is much higher for the ring electrode configuration as the total power deposition is equal for both setups.
As a result, the chemistry and the species concentrations in the effluent are quite different for both setups. For the ring electrode configuration the NO density profile shows a high maximum density of almost 
 close to the nozzle exit, but the NO concentration then drops abruptly.
The maximum NO density for the plate electrode configuration is, however, only 6.5 × 
 and is reached a few mm further from the nozzle. The NO density peak is now located much further from the nozzle exit because H and O atoms are being produced in large quantities in that region due to the constant power deposition and these two atoms are able to regenerate NO from
  .
.
We demonstrated for the ring electrode case that the O density rises to a maximum of 1.5 × 
 just beyond the nozzle exit. Beyond 2 mm from the nozzle exit the power drastically drops along with the O production. As a result, O is now rapidly destroyed by collisions with OH and
  . Note that H atoms act as a catalyst in this multi-step process that results in the conversion of two O atoms into one
  molecule and ends with the regeneration of the H atom.
For the plate electrode configuration, O atoms continue to be produced even beyond the plate electrode itself since the power deposition is more or less constant for that entire region. A maximum O density of only 1.0 × 
 is reached just before the plate electrode, but the maximum is much broader.
Finally, we also demonstrated that the feed gas humidity is a crucial parameter due to the importance of the hydrogen chemistry and should not be neglected, not even at ppm impurity levels. The effect was the largest for the O atoms, for which we showed a three-fold density decrease upon rising feed gas humidity, in the range between 1 and 500 ppm.
Acknowledgments
This work was partially funded by the Institute for the Promotion of Innovation by Science and Technology in Flanders (IWT Flanders). Furthermore, we thank Mark Kushner for providing the numerical code. The simulations were carried out using the Turing HPC infrastructure of the CalcUA core facility of the University of Antwerp, a division of the Flemish Supercomputer Center VSC, partially funded by the Hercules Foundation, the Flemish Government (department EWI). Also, we acknowledge the COST Action MP1101 on Bioplasma for providing the opportunity for fruitful discussion. Peter Bruggeman acknowledges the support from the University of Minnesota and the DOE Plasma Science Center for predictive control, besides also the Stichting Technische Wetenschappen (STW). Finally, all authors would like to thank Bram van Gessel, Shiqiang Zhang and Sven Hofmann. We heavily relied on their experimental work [8–12, 15] in this study.