


Abstract
Experimental realizations of two-dimensional (2D) electronic spectroscopy in the ultraviolet (UV) must so far contend with a limited bandwidth in both the excitation and particularly the probe frequency. The pump bandwidth is at best 1500 cm−1 (full width at half maximum) at a fixed wavelength of 267 nm or 400 cm−1 for tunable pulses. The use of a replica of the pump pulse as a probe limits the observation of photochemical processes to the excitation region and makes the disentanglement of overlapping signal contributions difficult. We show that 2D Fourier transform spectroscopy can be conducted in a shaper-assisted collinear setup comprising fully tunable UV pulse pairs and supercontinuum probe spanning 250–720 nm. The pump pulses are broadened up to a useable spectral coverage of 2000 cm−1 (25 nm at 316 nm) by self-phase modulation in bulk CaF2 and compressed to 18 fs. By referencing the white light probe and eliminating pump stray light contributions, high signal-to-noise ratios even for weak probe intensities are achieved. Data acquisition times as short as 4 min for a selected population time allow the rapid recording of 2D spectra for photolabile biological samples even with the employed 1 kHz laser system. The potential of the setup is demonstrated on two representative molecules: pyrene and 2,2-diphenyl-5,6-benzo(2H)chromene. Well-resolved cross-peaks are observed and the excitation energy dependence of the relaxation processes is revealed.
Export citation and abstract BibTeX RIS

Content from this work may be used under the terms of the Creative Commons Attribution 3.0 licence. Any further distribution of this work must maintain attribution to the author(s) and the title of the work, journal citation and DOI.
GENERAL SCIENTIFIC SUMMARY Introduction and background. Two-dimensional (2D) spectroscopy is a powerful tool in unravelling electronic and vibrational couplings and the associated ultrafast dynamic processes. This is afforded by spectrally resolving the pump pulse in addition to the probe pulse. In the UV, experimental realizations of two-dimensional electronic spectroscopy must so far contend with a limited bandwidth in both the excitation and particularly the probe frequency. Using spectrally identical pulses for pump and probe limits the observation of photochemical processes to the excitation region and may lead to featureless and hard-to-interpret signals.
Main results. In this paper we show that two-dimensional Fourier transform spectroscopy can be carried out in a shaper assisted collinear setup comprising fully tunable UV pulse pairs and supercontinuum probe spanning 250–720 nm. The pump pulses with a central wavelength of 310 nm are broadened up to a useable spectral coverage of 2000 cm−1 by self-phase modulation in bulk CaF2 and compressed to 18 fs. The potential of the setup is demonstrated on two representative molecules: pyrene and 2,2-diphenyl-5,6-benzo(2H)chromene. Well resolved cross peaks are observed and the excitation energy dependence of the relaxation processes is revealed.
Wider implications. We envision that the novelties of our setup allow one to address the absorption and ultrafast dynamics of aromatic amino acids in proteins and DNA bases and thus the investigation of the energy and charge transfer flow in these systems.
 Figure. (a) Scheme of the collinear 2D-UV setup used in this work comprising self-phase modulation broadened double pump pulses and a supercontinuum probe. (b) 2D spectrum of pyrene in methanol at a population time of 1 ps obtained with the UV and vis supercontinua and a pump spectrum centred at 32 258 cm−1 (310 nm).
1. Introduction
Two-dimensional (2D) spectroscopy has proven to be a powerful tool in unravelling electronic and vibrational couplings and the associated ultrafast dynamic processes [1]. This is afforded by spectrally resolving the pump pulse in addition to the probe pulse already resolved in standard femtosecond transient absorption spectroscopy. In the IR, the technique has considerably increased our understanding of protein folding [2, 3] and solvation [4, 5]. In the visible it has provided deep insights into the workings of complex chromophoric systems such as light harvesting complexes and the photosynthetic reaction centres [6–9], and vibronic and vibrational modulations in molecules [10] and molecular complexes [11]. In the ultraviolet (UV) very few results have so far been reported [12–16] as the technical development is still work in progress. Very recent first spectroscopic applications are the tryptophan-to-heme electron transfer in myoglobin [17], the ring opening of α-terpinene [18] and the excited-state dynamics of 2-aminopurine dinucleotides [19] and chiral porphyrin dimers [16]. The limited bandwidth in the pump and probe pulse requires sophisticated analyses of the experimental data in order to extract the underlying dynamics. The probe spectrum range in these investigations is more or less identical to the pump range and thereby limited to the most congested region of the spectrum where ground-state absorption (bleach), stimulated emission, excited-state absorption and even a possible product absorption overlap.
The benefits of the extension of 2D spectroscopy into the UV have been envisioned in recent perspective papers [15, 20, 21] as it allows one to address the absorption and ultrafast dynamics of aromatic amino acids in proteins and DNA bases and thus the investigation of the energy and charge transfer flow in these systems. The potential of this method is however even larger, as one can decipher spectrally overlapping bands in chromophore complexes and even in single chromophores. A prime example for this case is the mixing of the La/Lb states in arenes and polyenes [22, 23] as well as the coupling of nearly degenerate electronic states as have been reported for diphenylmethane [24, 25]. In addition, 2D-UV spectroscopy allows one to investigate the excess energy dependence of photophysical and photochemical processes in chemical reactions involving UV absorbing chromophores.
Porting 2D spectroscopy into the UV spectral range must contend with several challenges. One is phase stability due to the mechanical fluctuations of the optical components, which is an order of magnitude more critical than in the mid infrared. For this problem, the collinear shaper-assisted approach used by Shim and Zanni [26] in the IR and by Ogilvie and co-workers [27, 28] in the visible is the optimal solution as the shaper guarantees inherent phase stability. The second challenge is the generation of sufficient spectral bandwidth to cover a meaningful fraction of the absorption spectrum and achieve a good match with the molecular absorption. Over the last few years, several Fourier transform 2D-UV experiments have been reported in the literature, with a spectral bandwidth up to 1500 cm−1 at a fixed wavelength [12, 15, 18, 29] or tunable with a bandwidth just above 300 cm−1 [13]. In all cases the pump and probe spectrum were equal. The spectral width is inadequate for most UV absorbing samples, where the spectral features are often broader than 50 nm, e.g., for the nucleic acids. The third challenge is sufficiently low excitation density to avoid photoionization of the solute or/and the solvent, which has been reported for experiments involving DNA at excitation intensities from 10 GW cm−2 onward [29–31].
Here, we present a 2D-UV setup based on the shaper-assisted pump–probe geometry. The UV pump pulses tunable between 240 and 370 nm are broadened by self-phase modulation (SPM) to a Fourier limit below 16 fs [32]. In most 2D applications, a replica of the pump spectrum is used as probe. If the spectral bandwidth is large enough cross-peaks can be resolved, but the probe window is restricted to the excitation region which is often highly congested [11]. We therefore combine our pump pulses with a CaF2 supercontinuum allowing for a probe range spanning 250–720 nm. The potential of the setup is demonstrated on two representative molecules: pyrene and 2,2-diphenyl-5,6-benzo(2H)chromene.
2. Experimental setup
Figure 1 shows the setup used for 2D-UV spectroscopy. To generate UV pump pulses tunable over the whole UV spectral domain, the 6 μJ output of a single-stage visible noncollinearly phase matched optical parametric amplifier (NOPA) pumped by a 1 kHz Ti:sapphire amplifier system (CPA 2001; Clark MXR) is either frequency doubled (240–360 nm) or sum-frequency mixed with 80 μJ of the Ti:sapphire fundamental (300–370 nm) in a 56 μm thick β-barium borate crystal [33]. The pump pulses with an energy of 3 μJ are then spectrally broadened by self-phase modulation in a 1 mm thick CaF2 crystal as described in detail in [32]. The broadened pulses are compressed to nearly their Fourier limit with the combination of a UV prism compressor and an acousto-optic programmable dispersive filter (AOPDF). The residual chirp is of the fourth order and can be neglected. The AOPDF (DAZZLERTM model T-UV-250-400; Fastlite) also generates the phase-locked double pulses with a variable delay and controlled phase. Compressing the UV pulses and generating the double pulses needed for 2D in a single device is an ideal combination as it minimizes the losses compared with a multi-stage approach. The double pump pulses with typical single pulse energies of 80 nJ are focused into the sample by a slightly off-axis spherical mirror (R = −600 mm). The resulting focal diameter is about 100 μm with a negligible astigmatism (< 5%). The excitation fluence is up to 1.5 × 10¹⁵ photons cm−2 leading to a maximal excitation probability of about 5%. This corresponds to a peak intensity of up to 50 GW cm−2.
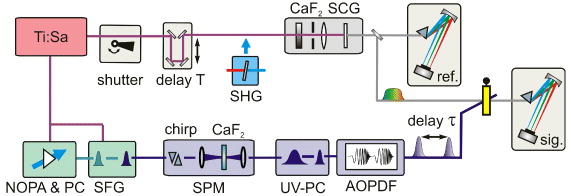
Figure 1. Scheme of the collinear 2D-UV setup. BS: beam splitter; PC: prism compressor; SFG: sum frequency generation; SPM: self-phase modulation; SHG: second harmonic generation; SCG: supercontinuum generation; and AOPDF: acousto-optic dispersive filter.
Download figure:
Standard image High-resolution imageMeasurements on methanol and acetonitrile show that no signal due to photoionization of the solvent is generated under these intensities. To achieve a clean spatial and temporal profile of the double pulses with the AOPDF, the geometric and Gaussian foci have to overlap at the sample position. This is achieved by correct collimation of the beam entering the AOPDF. Specifically, an intermediate Gaussian focus has to be generated one focal distance before the R = −600 mm spherical mirror in front of the sample. For details see [34].
For probing, either a fraction of the UV pump pulse (about 2 nJ) or a white light supercontinuum (a few pJ nm−1) is used. The delay time of the probe pulse relative to the second pump pulse is denoted as population time T in accordance with the literature. The first pump pulse precedes the second one by the coherence time τ. The white light generated in a 4 mm thick CaF2 crystal covers the spectral range of 290–720 nm when generated with the Ti:sapphire fundamental [35] and 250–360 nm when generated by the second harmonic of the Ti:sapphire fundamental [36]. The probe beam is focused into the sample by a spherical mirror (R = −600 mm) to a focal diameter of about 50 μm and subsequently spectrally dispersed in a prism-based spectrometer [35]. The spectrally resolved intensity of each laser shot is measured at the full 1 kHz repetition rate with a CCD array (S3902-512Q detector—Hamamatsu Photonics; electronics by Entwicklungsbuero Stresing). For probe referencing a fraction of the collimated probe beam is separated by a beam splitter in front of the sample and measured in a second identical prism spectrograph.
To characterize the phase stability between the two pump pulses generated by the AOPDF, their spectral interference is measured for an interpulse delay of 350 fs (see figure 2). The central frequency of the pulses is set to 32 258 cm−1 (310 nm). The phase deviation of an average of 75 laser shots is monitored over a period of half an hour (see figure 2(c)). A slight systematic drift of the phase is observed on the long timescale which is attributed to a change of the beam pointing due to temperature deviations in the laboratory. The standard deviation of the phase is found to be 33 mrad over 30 min, which is less than λ/187 of the optical cycle. This is significantly better than the values reported for 2D-UV spectroscopy in the boxcar geometry, where the phase stability is measured to be about λ/88 [13]. Even the best reported stability at 800 nm of λ/157 [37] is surpassed. Since the measurement of the spectral interference pattern can be performed in parallel to the actual measurement, an even higher effective phase stability could be obtained by online feedback.
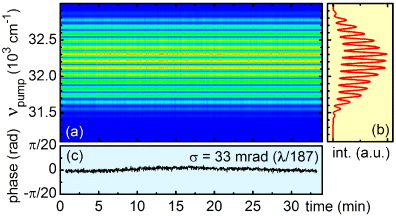
Figure 2. (a) Interpulse phase stability of the pump pulses with a central frequency of 32 258 cm−1 (310 nm) characterized by spectral interference. The interpulse delay τ is 350 fs. Panel (b) shows the typical fringe pattern averaged over 75 laser shots and (c) the evaluated phase. The phase shows a long-term standard deviation of 33 mrad over half an hour, which is less than 1/187th of the optical cycle.
Download figure:
Standard image High-resolution image3. Measurement procedure: referencing and stray light subtraction
To obtain a 2D spectrum for one population time T, i.e. the delay between the second pulse of the pump pulse pair and the probe, the probe spectral intensity is measured while the interpulse delay τ (coherence time) of the two pump pulses is scanned by the AOPDF. Both the pulse envelope and the interpulse phase of the electric field are shifted by the AOPDF, in order to ensure that the carrier envelope phase of the two pulses is identical. We measure 2.321 time points per optical cycle up to a maximum coherence time τ of about 150 fs depending on the system under investigation. The resulting step size (∼ 0.45 fs at 310 nm) is in accordance with the numbers reported in the literature for 2D spectroscopy in the visible or IR [26, 28].
To remove the transient absorption background, we use the phase cycling scheme as described in [26]. For each coherence time τ the probe spectral intensity is measured once with the identical carrier envelope phase for both pulses and once for the subsequent laser shot with the carrier envelope phase difference flipped by π for the first of the two pump pulses. The background free coherent contribution is obtained by subtraction of these two measurements.
For a 2D measurement, the phase cycling scheme is not mandatory. The transient absorption background can also be separated in the course of the data evaluation by Fourier transformation of the raw data as this contribution typically does not show modulations in the frequency range of the pump spectrum. However, phase cycling has several important advantages. The subtraction automatically corrects for long-term drifts of the CCD. The retrieved coherent contribution is doubled in size and thus the signal-to-noise ratio increases. Similar to the chopping of the pump beam in a pump–probe measurement, the phase cycling doubles the number of laser shots in the acquisition of a 2D spectrum. However, the flipping of the phase on a shot-to-shot basis makes use of the high shot-to-shot intensity correlations of the laser and thus also increases the signal-to-noise ratio [38]. In spectroscopic terms, the suppression of the transient absorption background by phase cycling avoids the futile attempt to resolve the fine structure on the excitation axis that is anyway hidden by homogeneous broadening of the dissolved molecules.
To further increase the signal-to-noise ratio without increasing the total acquisition time, we combine phase cycling with single-shot probe referencing [39]. For each laser shot, the probe spectral intensity is measured after passing through the sample (Sig) and in addition in front of the sample (Ref). Inclusion of the reference measurement eliminates the noise on the probe spectral intensity and largely increases the fidelity of the measurement.
When just using the phase cycling scheme, for each coherence time τi and probe frequency νprobe the above described signals are combined according to equation (1) on an alternating shot basis:

The superscript refers to the interpulse carrier envelope phase difference being 0 or π. In order to include single-shot referencing, the 2D raw signal is calculated according to

Refnopump is the probe spectral intensity at the reference CCD when no pump pulse is present. The reference spectrum is measured as an average of 1000 laser shots before starting the τ-scan. This factor guarantees that the referencing does not change the shape of the 2D spectrum along the probe axis but only eliminates the noise. The results of equation (2) are averaged over 800 laser shots (400 pulse pairs).
An illustrative example of the raw data obtained with the above described acquisition procedure is shown in figure 3(a). The transient absorption background free interferogram was obtained for pyrene dissolved in methanol at T = 1 ps. The central wavelength of the pump pulses was set to 310 nm (32 258 cm−1) to excite the S2(1B2u) ← S0 (1Ag) electronic transition. A fraction of the pump beam was used as a probe. To visualize the sinusoidal behaviour of the interferogram in a better manner, here the step size of the coherence time τ was chosen to be 1/6 of the 1.03 fs optical cycle of the electric field.
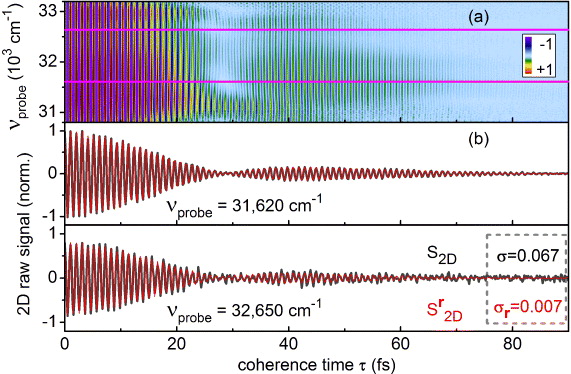
Figure 3. Measured phase-cycled 2D signal of pyrene in methanol at T = 1 ps prior to Fourier transformation. (a) 2D raw spectra measured with probe referencing. (b) Coherence time scans for νprobe = 31 620 and 32 650 cm−1 (pre-normalized intensity ratio 2:1) with (black) and without probe referencing (red). The standard deviations σ were evaluated for τ > 75 fs.
Download figure:
Standard image High-resolution imageWe observe modulations at the pump carrier frequency along the τ-axis (see figure 3(b)). These modulations originate from the polarization created by the pump pulses. The amplitude of these modulations vanishes over time due to the finite temporal width of the pulses and the electronic dephasing of the molecule. In contrast to earlier measurements aimed at determining the dephasing time, we also observe a revival of the modulations peaking around the coherence time τ = 45 fs. The revival of the coherence is associated with a π phase shift in the high-frequency component at τ = 30 fs.
To interpret this finding we look more closely at what is actually monitored in the 2D experiment. The first pulse creates a polarization in the sample. This polarization is a Hertzian coherence between the ground state and the electronically excited state. It oscillates with the main transition energy that is equal to the carrier frequency of the pump pulse if it is tuned into resonance. Since our pump pulse is shorter than the typical electronic dephasing time of some ten femtoseconds [40, 41], the second phase-locked pump pulse encounters this freely oscillating polarization prior to significant dephasing. Depending on whether the electric field of the second pulse is in phase or out of phase, the additional polarization generated by the second pulse adds or subtracts to the one from the first pulse. For a static two-level system the frequency of the polarization does not evolve in time and the decrease in 2D signal is solely due to a stochastic decay of the polarization. In this simplified picture it is hard to explain why the sample polarization recurs after a complete disappearance and changes its phase by π. We would like to suggest that this is the intrinsic signature of the molecular energy structure and the ultrafast molecular dynamics following optical excitation.
The experimental findings can be explained by two contributing transitions with distinct central frequencies and broad spectral bands. The nature of these transitions is not a priori known but they could be two vibronic side bands of the S2 ← S0 electronic transition. In this picture, the broadband pulse creates two polarizations with different oscillatory frequencies. These two polarizations can then beat and lead to the observed experimental behaviour, including the phase shift between the oscillations before and after the revival shown in figure 3(b).
An alternative explanation builds on the concept of a τ-dependent modulation of the electronic polarization due to structural motion. The first laser pulse induces a nuclear motion that can be associated with the time evolution of a vibronic wavepacket created in the excited state and also the ground state. This motion is the consequence of the differing equilibrium geometry in the excited state as compared with the ground state, also seen in the Franck–Condon structure of the absorption band. The wavepacket propagates with time and the second pump pulse encounters a changed molecular configuration. We do not claim that we observe vibrational modulation along τ directly, but rather the effect of structural motion on electronic polarization.
Assuming two harmonic potentials for the electronic states that have the same curvature and are displaced to each other, the wavepacket motion induces a change in the S2–S0 potential energy spacing ΔE which is linear in the nuclear displacement. In the time domain, the nuclear displacement oscillates periodically with the cosine of the frequency Ω of an effective mode associated with the wavepacket [42]. As a consequence ΔE also oscillates periodically, as previously reported for a molecular dimer [11, 43]. Thus, the polarization created by the first laser pulse changes its frequency due to the nuclear motion. The second laser pulse subsequently interacts with a polarization that is detuned from the pulse carrier frequency. As the detection averages over the length of the second pump pulse corresponding to about 25 cycles of the electric field, already a change of the polarization frequency of a few per cent can lead to a vanishing average. A typical vibrational frequency and energy spacing of 1400 cm−1 is just equal to 4.3% of the transition frequency of 32 258cm−1.
With the above ingredients the time-dependent modulation of the electronic polarization frequency can be described according to

where ν0 is the initial frequency of the polarization, δE is the relevant vibrational energy and Ω is its frequency. δE is of the order of the fundamental vibrational energy due to the displacement and curvature of the harmonic potentials. The frequency change of the polarization causes the electric field of the second pump pulse to get out of phase with the polarization which leads in turn to the vanishing amplitude at τ = 30 fs. As the nuclear geometry returns into the vicinity of the Franck–Condon geometry after one vibrational period t = 2π/Ω, the frequency of the polarization returns to that of the pulse electric field and a revival of the coherence signal results. Owing to electronic dephasing, the amplitude of the revival is lower than the initial signal at τ = 0. Similar observations have been made in pump–probe experiments on the iodine molecule [44] and cesium [45].
Formally, the two pictures, i.e. the τ-dependent modulation of the electronic polarization due to structural motion and the polarization beating are closely related and can both explain the experimental observations. An intensity-dependent study should be able to elucidate and differentiate the suggested mechanisms in greater detail.
3.1. Performance of single-shot referencing
The intensity fluctuations of the probe pulses are the main source of noise in pump–probe experiments, as discussed in detail in [38]. These fluctuations can be effectively eliminated by probe referencing [39]. The results are shown in figure 3(b) where the interferograms for the selected probe frequencies of 31 620 and 32 650 cm−1 are compared with (red trace) and without (black trace) referencing. To calculate the increase in the signal-to-noise ratio, the standard deviation of the baseline for coherence times τ larger than 75 fs was calculated. The signal-to-noise ratio shows an increase by a factor of 10. This allows us to use shorter averaging times for each τ-delay and is the major factor that reduces our acquisition time down to 4 min.
To obtain 2D spectra from the interferogram displayed in figure 3(a), the τ-axis is Fourier transformed for each probe frequency. This yields the pump frequency axis. Since in collinear 2D spectroscopy the probe pulse both generates the 2D signal field and also serves as the local oscillator for heterodyne detection, the phase of the 2D signal is inherently correct. Unlike in the boxcar approach, phasing of the obtained amplitude spectra [46] is not required. The real part of the transformation obtained from the data in figure 3 is shown in figures 4(a) and (b) for the population times of 0.5 and 1 ps. It corresponds to the absorptive 2D spectrum. The sign of the obtained signals is opposite to that in the pump–probe spectra (ΔOD) in accordance with common practice in 2D spectroscopy [8, 11, 46]. Ground-state bleach and stimulated emission signals give rise to positive contributions while excited-state absorption signals have negative contributions.

Figure 4. Absorptive 2D spectra of pyrene in methanol for the population times of (a) 0.5 ps and (b) 1 ps. The spectral intensity of the pulses (blue line) and the absorption spectrum of pyrene (black line) are shown in the right (c) and lower side panel (d).
Download figure:
Standard image High-resolution imageAll signals in the 2D spectra in figure 4 are positive and can be assigned to the ground-state bleach contributions of pyrene. The π phase shift observed in the interferogram of figure 3 leads to a dip in the real part of the Fourier transformation resulting in a double-peak structure along the pump axis. The two diagonal peaks are reminiscent of the two vibronic bands in the absorption spectrum. As discussed below, this idea needs a closer consideration. In addition, due to the large spectral bandwidth of the pump pulses, off-diagonal peaks providing information on the correlation between vibronic bands are clearly resolved. The spacing of the off-diagonal peaks matches with the revival time of the electronic coherence observed in the interferogram in figure 3. When going from the population time of 0.5 to a time of 1 ps we observe a decrease in intensity for the upper diagonal and the lower off-diagonal peak. As pyrene undergoes an ultrafast internal conversion from the S2 1B2u to the optically dark S1 state within the first 100 fs after excitation, this change cannot be attributed to population transfer from the upper to the lower vibronic level of the S2 1B2u state but rather has to be understood as a change in the excited-state absorption of the S1 state overlying with the ground-state bleach region.
3.2. Performance of the dynamic pump stray light subtraction
The use of a replica of the pump pulse for probing limits the probe spectral window to the excitation region. As has been demonstrated in the case of pyrene, this region is often congested by additional contributions from stimulated emission and excited-state absorption. The often used way to cope with this situation is a complicated modelling of the 2D spectrograms and the underlying molecular response. An experimental alternative is to vary the probe spectrum independently from the pump spectrum and to use a much broader spectral range [28]. For the non-collinear boxcar geometry this is not readily possible as the broadband probe will be spatially dispersed when scattered by the transient grating in the sample. However, the partially collinear geometry implemented here allows for probe pulses that are generated independently from the pump pulses.
The broadest probe spectra are obtained by supercontinuum generation. They have been successfully implemented in transient pump–probe setups [35, 36] and 2D-Vis spectroscopy [28]. As white light probes have relatively low intensities (few pJ nm−1) compared with the pump pulses [47], even weak contributions of pump stray light can distort the 2D spectra in the spectral region of the pump pulse spectrum (see figure 5(a)). Various procedures to minimize the influence of stray light have been proposed in the literature [46, 48]. Using well chosen polarization between the incident pulses has shown good results but needs precise adjustment and additional optical components [27]. It also changes the molecular response due to the differing polarization of electronic transitions [49]. Using an additional phase cycling scheme where the carrier envelope phase of both pump pulses is systematically changed was used successfully in the UV [12]. However, this technique needs phase stability between the pump and the probe pulses, which is not necessarily the case when the two are generated by differing nonlinear processes. To achieve applicability for all pump and probe combinations, we have implemented the following technique. The pump stray light is measured when the probe beam is blocked with a computer controlled shutter. In this configuration, only the pump stray light impinges on the signal spectrometer. This background is subtracted from the probe signal when the shutter is opened again after typically 200 laser shots. The procedure has to be repeated for each coherence time, as the pump spectral intensities of the double pulses change slightly for each τ-delay.
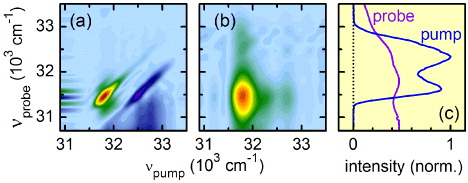
Figure 5. Demonstration of the benefit of pump stray light subtraction for weak probe pulses. The 775 nm pumped supercontinuum white light was used as probe. (a) 2D spectrum of pyrene in methanol without pump stray light subtraction for a population time of 1 ps; severe distortions in the excitation region are observed. (b) 2D spectrum with pump stray light subtraction; diagonal and cross-peaks in the excitation region are now clearly resolved. (c) Pump and probe spectrum.
Download figure:
Standard image High-resolution imageAs illustrated in figure 5(b), our stray light subtraction procedure eliminates the distortions in the spectral region of the pump. Again, well separated diagonal and cross-peaks are obtained as in the case where a replica of the pump was used as a probe (see figure 4).
4. Measurement of the two-dimensional spectrum of pyrene and chromene
Figure 6(a) shows the 2D spectrum of pyrene in methanol at a population time T = 1 ps obtained with the two supercontinua implemented in our setup. Note that in this figure, for illustrative purposes, the pump and probe axes have been turned around, i.e. the probe axis is the horizontal axis, while the pump axis is vertical. To eliminate the amplitude modulations of the probe spectrum from the 2D spectrum, the measurement values calculated via equation (2) have to be divided by the probe signal intensity recorded on the signal CCD when the pump is blocked (Signopump) according to


Figure 6. 2D spectrum (T = 1 ps) of pyrene in methanol obtained with the UV and Vis supercontinua. The pump spectrum is centred at 32 258 cm−1 (310 nm). (a) Concatenated 2D spectrum probing the whole UV–Vis spectral domain. (b) Comparison between projected 2D spectrum (inverted) and pump–probe spectra at T = 1 ps (red hashed line) and at T = 75 fs (filled violet line). (c) Spectral intensity of the probe pulses and absorption spectrum of pyrene in methanol.
Download figure:
Standard image High-resolution imageAs the white light detection ranges overlap between 300 and 340 nm (see figure 6(c)), the two measurements can be concatenated and scrutinized and together allow us to probe more than one and a half octaves.
The UV supercontinuum visualizes not only the ground-state bleach around the excitation region but also the ground-state bleach corresponding to the S3 ← S0 absorption at 36 200 cm−1 (276 nm). With the UV–Vis supercontinuum a strong excited-state absorption to the red of the ground-state bleach is visualized which extends over a very large range and is well structured. These features correspond to the excited-state absorption of the S1 state reached after the sub-100 fs internal conversion. They are distinct from the S2 excited state absorption (ESA) determined in an auxiliary transient absorption measurement at 70 fs pump–probe delay. Integration of the 2D spectrum over the pump frequency yields a spectrum that nearly perfectly matches the pump–probe spectrum obtained for the same population time (see figure 6(b)). The amplitudes of the S1 ESA bands in the visible spectral range show a clear excitation energy dependence. This suggests that the vibrational relaxation in the S1 state is strongly dependent on the vibrational excess energy supplied to the initially excited S2 state. A detailed interpretation of these observations is the subject of a forthcoming publication.
In figure 7, the ground-state bleach (excitation) region obtained when using the UV supercontinuum as a probe (see figure 7(a)) is compared with that obtained when a replica of the pump is used as a probe. We observe distinct differences in the spacing between the diagonal and cross-peaks. When the SPM broadened UV pulses are used for both pump and probe the spacing between the bands is 700 cm−1, which corresponds to the 45 fs revival in figure 3. With the supercontinuum, a diagonal–off diagonal spacing of 1380 cm−1 is obtained. This corresponds to the energy spacing of the vibronic progression of the S2 state. As has been demonstrated in the case of perylene diimides, the purely resolved absorption bands of these systems in solution are composed of several vibronic transitions each that can be resolved in a supersonic molecular beam [50]. The bandwidth of the SPM broadened UV pulses is still not large enough to cover the vibronic bands completely and thus excites a subensemble of these transitions.
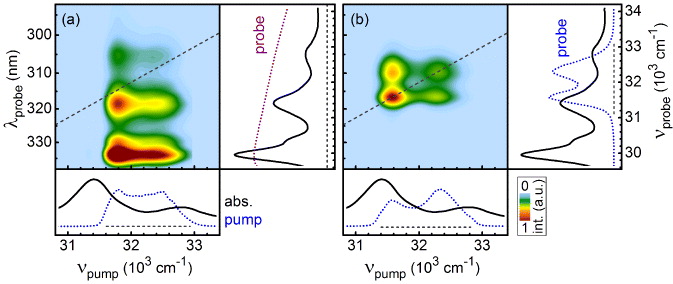
Figure 7. Comparison of the excitation region probed with the UV–white light (a) and the replica of the pump pulse (b). The 2D spectrum in (b) is retrieved according to equation (2) while for (a) the spectral amplitude modulations of the UV–white light have been eliminated by using equation (3) prior to Fourier transformation.
Download figure:
Standard image High-resolution imageAs mentioned in the previous section, the dynamics of the ground-state bleach diagonal and cross-peaks in the 2D spectra of figure 4 is not due to population transfer from the upper to the lower vibronic level of the S2 1B2u state but due to excited-state absorption of the S1 state overlying the ground-state bleach region. With the supercontinuum probe this excited-state absorption can be visualized directly and completely. Now, a disentanglement between ground-state bleach and excited-state absorption is easily possible, e.g., by subtraction of an appropriately scaled steady-state absorption spectrum. There is no need for complicated temporal and spectral analyses, which are common in 2D applications, where the probe window is confined to the excitation region [18].
The time evolution of diagonal and cross-peaks contains valuable information on the population and coherence transfer in multichromophoric systems or the vibrational excess energy dependence of photophysical and photochemical processes. The capability to measure 2D spectra at several different population times in order to unambiguously resolve the dynamics is therefore of crucial importance. As an illustrative example, we have chosen the photochromic reaction of 2,2-diphenyl-5,6-benzo(2H)chromene (5,6-DPBC), which has been extensively investigated with fluorescence [51, 52] and time-resolved techniques [53–55].
When irradiated with UV light, 5,6-DPBC undergoes a pericyclic ring opening which is accompanied by the rise of a broad spectral feature centred at 23 529 cm−1 (425 nm). This absorption is attributed to the ring-opened form [56]. The rise of this band is clearly visible in the 2D spectra shown in figure 8(a), which have been obtained by excitation into the S2 band of 5,6-DPBC with pump pulses centred at 32 415 cm−1 (308.5 nm). The pump pulses were broadened by SPM to cover two vibronic bands of the S2 absorption. This affords the double-band structure of the product absorption along the pump frequency axis. To obtain the temporal evolution of the product band, 2D spectra of 5,6-DPBC were recorded for 13 population times. With an acquisition time of 4 min per spectrum, the total measurement was completed in less than 1 h. The high quality of the measurements becomes visible when the time traces of the product band (see figure 8(b)) are obtained by integration over just 120 cm−1 around the band maximum along the probe axis (22 920 cm−1) and 65 cm−1 around the band maxima along the pump axis (32 165 and 32 870 cm−1; marked by white boxes in figure 8(a)). The high signal-to-noise ratio of the traces is afforded by the short acquisition time which avoids long-term drifts of the setup.

Figure 8. (a) 2D-UV measurements of 5,6 DPBC in acetonitrile for selected population times T measured with visible white light probing. The 2D intensity was normalized to the maximum of the T = 50 ps spectrum. The spectra show the formation of the absorption of the ring-opened photoproduct. (b) Time evolution of the product band at the pump frequency maxima of 32 165 and 32 870 cm−1, for the probe frequency of 22 920 cm−1. The integration region is marked by white boxes in (a).
Download figure:
Standard image High-resolution image
Owing to the high signal-to-noise ratio in the time traces, we can precisely monitor the dynamics of the product formation as a function of excitation energy. We observe an excitation dependent rise of the product band. The rise time steadily increases from 1.7 ps at 32 000 cm−1 to 2.4 ps at 33 240 cm−1. The earlier pump–probe measurements identified three time constants in the ring opening of 5,6-DPBC, a 400 fs time, a few ps time and a 10 ps time [54, 55]. However, the pump–probe investigations did not yield sufficient information for a univocal assignment, as to which time constant can be associated with the ring-opening process. Owing to the excess energy dependence observed in the 2D measurements, the few ps time constants can now be assigned to the ring opening, i.e. the product formation with certainty. Intuitively, an increase in supplied vibrational excess energy should lead to a speed up in the product formation. Here, however, we observe the opposite behaviour. This indicates that with increasing excess vibrational energy, the vibronic wavepacket needs more time to pass through the conical intersection responsible for product formation. This is similar to recent reports on carotenoids [57, 58].
The results obtained on 5,6-DPBC show the power of 2D-UV spectroscopy. Owing to its inherent excitation energy resolution it allows us to systematically investigate the dependence of photophysical and photochemical processes on vibrational excess energy, thus giving insights in the vibronic wavepacket dynamics.
5. Discussion and conclusions
We have presented a shaper-assisted 2D-UV setup comprising UV pump pulses tunable between 240 and 370 nm and probe supercontinua spanning in the range 250–720 nm. The UV AOPDF that generates the double pump pulses affords a phase stability that is measured to λ/187 for 30 min. The incorporated single-shot referencing of the probe increases the signal-to-noise ratio by a factor of 10 for equal acquisition time and affords an acquisition time of just 4 min for a 2D spectrum at a selected population time even for the 1 kHz repetition rate laser system.
The bandwidth of our pump pulses is roughly equal to the best value reported for just a fixed wavelength generated by frequency tripling in a gas filled capillary [15, 18]. It is more than three times as large as that achieved for tunable pulses [13]. The pump pulses broadened by self-phase modulation up to a spectral width of 25 nm at 310 nm allow us to cover more than one vibronic feature of UV absorbing chromophores leading to clearly resolved diagonal and cross-peaks in the 2D spectra. These pulses are compressed to nearly their Fourier limit of sub-20 fs and allow for a temporal resolution better than 30 fs in combination with the supercontinuum probe. At present, the chirp of the supercontinuum puts a lower limit to the shortest population times we can observe. If we consider the full spectral width of the probe, only times slightly below 1 ps are accessible. However, a limited range of 1500 cm−1 that is at best available in other 2D-UV setups only amounts to a 75 fs group delay between the half-height frequencies. This is about the same time range that is lost to observation in one-colour transient grating geometry 2D experiments as it is obscured by the coherent artefact [15, 18]. We can expect a much smaller group velocity dispersion when parts of the continuum spectrum are amplified in a broadband NOPA and transferred to the UV by frequency upconversion with a tunable near-infrared pulse. In the earlier work, we already compressed a 5000 cm−1 bandwidth to 5.7 fs [59]. Even the direct compression of the supercontinuum is within sight [60].
Owing to the ultrabroad supercontinuum probe we are not confined to investigating photochemical and photophysical processes within the excitation region [16, 18], where it is often necessary to disentangle overlapping signal contributions in order to understand the dynamics. The complicated temporal and spectral analyses for the separation of overlapping contributions coming from different states or chromophores can be circumvented by exploiting the fact that different states or chromophores have distinct excited-state absorption signals well outside the absorption region [36]. As the excited-state absorption is typically to the red of the UV absorption, it is often conveniently located in the readily accessible visible region. This situation is exemplarily demonstrated with the 2D spectra of pyrene, once obtained with a probe that is a replica of the pump pulse and once with the supercontinua.
With the example of 2,2-diphenyl-5,6-benzo(2H)chromene we show that white light probing is essential for the investigation of the photochromic ring-opening reaction. The ground-state bleach is relatively weak with a molar absorption coefficient of around 5000 M−1 cm−1 and only shows broad spectral features. The absorption band of the ring-opened form around 425 nm lies well outside the excitation region and is about ten times stronger. Even if the ground-state bleach would be resolved with further increased sensitivity, it would not report on the photochemical reaction as the bleach is not recovered upon the ring opening. Only the stimulated emission signal would decay, but it is typically hard to identify in polar solvents as it is strongly influenced by solvation in the ultrafast time regime. The product absorption on the other hand is an unambiguous signature of the product formation.
The excitation energy resolved measurements that helped unravel the complex reaction dynamics of the photoswitch will be essential in the investigation of the target systems envisioned for 2D-UV, such as DNA and proteins [61]. For the measurement of 2D spectra of DNA model systems in aqueous solutions, the intensity might have to be limited to a few GW cm−2 to avoid contributions from ionization of the solute or the solvent [31]. In the measurements presented here, the solvents methanol and acetonitrile do not produce any lasting signal even at the used peak intensities of 50 GW cm−2. The amplitude of the coherent artefact is in all cases less than the molecular signal, in strong contrast to the results obtained in the transient grating geometry setups [13, 15, 18]. Such intensities have been reported to generate solvated electrons in buffered aqueous solutions. However, it is not clear whether the solvated electrons have been generated via multiphoton processes in the solvent as discussed in [31] or due to single photon-induced formation of a πσ* state in the solute [62–64]. The implicit need for systematic intensity variations in 2D-UV spectroscopy can be conducted with our setup by purely electronic means. We believe that the sensitivity at largely reduced excitation intensities will still be sufficient due to the referencing scheme integral to our setup and the intrinsic smoothing of the Fourier transform.
Acknowledgments
We thank Niklas Christensson and Harald Kauffmann for valuable discussions and suggestions. This work was supported by the Austrian Science Fund within the framework of the Special Research Program F16 (Advanced Light Sources), by the SFB749 and by the DFG-Cluster of Excellence: Munich-Centre for Advanced Photonics. JH acknowledges funding by the Austrian Science Fund (FWF): START project Y 631-N27.