


Abstract
Dirac particles, massless relativistic entities, obey linear energy dispersions and hold important implications in particle physics. The recent discovery of Dirac fermions in condensed matter systems including graphene and topological insulators has generated a great deal of interest in exploring the relativistic properties associated with Dirac physics in solid-state materials. In addition, there are stimulating research activities to engineer Dirac particles, elucidating their exotic physical properties in a controllable setting. One of the successful platforms is the ultracold atom–optical lattice system, whose dynamics can be manipulated and probed in a clean environment. A microcavity exciton–polariton–lattice system offers the advantage of forming high-orbital condensation in non-equilibrium conditions, which enables one to explore novel quantum orbital order in two dimensions. In this paper, we experimentally construct the band structures near Dirac points, the vertices of the first hexagonal Brillouin zone with exciton–polariton condensates trapped in a triangular lattice. Due to the finite spectral linewidth, the direct map of band structures at Dirac points is elusive; however, we identify the linear part above Dirac points and its associated velocity value is ∼0.9–2 × 108 cm s−1, consistent with the theoretical estimate 1 × 108 cm s−1 with a 2 μm lattice constant. We envision that the exciton–polariton condensates in lattices would be a promising solid-state platform, where the system order parameter can be accessed in both real and momentum spaces.
Export citation and abstract BibTeX RIS

Content from this work may be used under the terms of the Creative Commons Attribution-NonCommercial-ShareAlike 3.0 licence. Any further distribution of this work must maintain attribution to the author(s) and the title of the work, journal citation and DOI.
1. Introduction
In 1928, a brilliant equation dawned on Paul Dirac, who had searched for a theory to describe the relativistic motion of electrons combining relativity and quantum mechanics. He arrived at a massless linear dispersion relation purely from mathematical conjecture, where the space–time symmetry is preserved in the form of the first-order derivatives. The Dirac equation indeed successfully describes the hydrogen atomic spectrum and predicts a new form of matter such as positron [1] in particle physics. The linear massless dispersion of relativistic Dirac particle is often expressed in a Dirac–Weyl Hamiltonian form as  , where ℏ is the normalized Planck's constant by 2π, v is the Dirac particle velocity,
  is the set of the Pauli matrices and
  is the momentum wavevector. The linear Dirac dispersions also appear in the band structure of a single particle confined in certain two-dimensional (2D) lattices. The famous example is the honeycomb lattice, where two atoms in a unit cell act as pseudo-spins represented by the 2 × 2 Pauli spin matrices. However, the honeycomb geometry is not unique and Dirac particles can emerge in other fundamental 2D lattices such as line-centered square or kagome geometries as long as two degenerate Bloch bands of the periodic potentials are crossing to form a gapless conical singularity known as a Dirac point. Calculations showed that the band structures of the triangular photonic lattices form Dirac points by two excited bands at the vertices of the first hexagonal Brillouin zone [2, 3].
This relativistic quantum mechanical equation provides great insight into the emergence of Dirac fermions in recently discovered 2D condensed matter materials including graphene [4], carbon nanotubes [5, 6] and topological insulators [7, 8], which exhibit linear electronic band structures in the vicinity of the Dirac points. These materials have already shown exotic transport properties, for example, the anomalous quantum Hall effect [9], Klein tunneling [10] and Zitterbewegung [11]. Although the aforementioned properties would be attributed to Dirac fermions, it is rather indirect to verify the existence of Dirac fermions. The only direct evidence of Dirac fermions in these systems comes from angle-resolved photoemission spectroscopy, which can map the linear energy–momentum relation and, furthermore, capture the unique kink structure in the spectra potentially induced by interactions among particles [12]. Despite the excitement and success in observing the exotic phenomena associated with relativistic Dirac particles in condensed matter materials, disorder, imperfectness and complicated long-range Coulomb interactions may challenge us to investigate Dirac physics.
In order to overcome challenges and complications in real materials, there have been myriads of theoretical proposals to engineer artificial Dirac particles using both fermions and bosons, and to address practical methods for accessing their unique signatures in 2D electronic and photonic platforms: electrons in 2D electron gas systems [13, 14], metal nanoparticles in plasmonic lattices [15], photons in triangular or honeycomb photonic crystals [16–22], two trapped ions [23], atomic condensates in honeycomb optical lattices [24, 25], fermionic atoms in  optical lattice [26, 27] and fermionic and bosonic atoms in line-centered square optical lattices [28, 29] which would have the capability to construct the rich phase diagram governed by Dirac physics. In particular, the superfluidity of Bose–Einstein condensates at Dirac points in the honeycomb optical lattice would be predicted to leave a marked fingerprint near Dirac points [30]. Such a permanent signature would be robust for atoms with non-zero interactions trapped in any lattices holding a triangular symmetry. This prediction provides an exciting insight that the altered Dirac band structure may be a unique feature of Dirac bosons arising from the interplay of superfluidity of interacting condensates and massless relativistic Dirac motion. As an experimental progress, the one-dimensional Dirac equation has been simulated in a single trapped ion [31], and Dirac-point engineering has been also demonstrated in a tunable honeycomb optical lattice [32], in a manipulated carbon-atom hexagonal array on the copper-oxide surface [33] and in a hexagonal photonic lattice [34]. However, the direct detection of the band structure in various engineered Dirac systems remains elusive or technically complicated. Here we prepare exciton–polariton condensates in a 2D triangular lattice, where the linear dispersion zones are formed by two degenerate p-like orbitals. We construct the band structures via the standard angle-resolved spectroscopy measurements in momentum space.
2. Microcavity exciton–polaritons in a triangular lattice
2.1. Microcavity exciton–polariton condensation
Microcavity exciton–polaritons possess light–matter duality inherited from the strongly coupled cavity photons and quantum-well (QW) excitons. In the low density limit, (spinless) exciton–polaritons are indistinguishable quantum Bose particles and undergo a phase transition to condensation, a spontaneous build-up of massive macroscopic population in a single ground state via stimulated scattering among weakly interacting particles. Phase transition occurs around 4 K in inorganic semiconductors such as CdTe [35] and GaAs [36–39] and around room temperature in organic materials [40] and large-band gap GaN semiconductors [41]. Such elevated critical temperatures in exciton–polariton condensation, around 107–109 times higher than those of atomic Bose–Einstein condensates, result from extremely light effective mass of exciton–polaritons primarily due to photonic fraction. A non-zero photonic component is also a primary source of the finite lifetime of exciton–polaritons, which naturally leak through the cavity. Capturing leaked photons whose energy and in-plane momentum information reveal those of polaritons (one-to-one correspondence), extensive evidence of exciton–polariton condensates in the ground state has been found: an exponential increase in the ground state occupancy, narrower distribution in momentum space, the peak energy blue-shift, increased spontaneous long-range spatial coherence and bunched second-order correlation above the quantum degeneracy threshold [35–47].
The spontaneous decay of exciton–polaritons is compensated for by continuous injection of particles externally, making exciton–polariton condensates stabilized in non-equilibrium conditions distinct from atomic counterparts. This open-dissipative nature of exciton–polariton condensates is advantageous in giving rise to coherent states with high-orbital symmetry beyond the ground state (meta-stable condensates) as a consequence of the competition between the relaxation scattering time to the ground state and the short lifetime of the states. When we introduce one-dimensional and 2D periodic potentials in exciton–polariton devices, well-defined meta-stable coherent states are accessed in high-symmetry points of given lattice potentials. In this manner, coherent p- and d-wave symmetries of exciton–polariton condensates have been observed in one-dimensional array [38] and 2D square lattice potentials [48], respectively. This work focuses on exciton–polariton condensates in 2D triangular lattice potentials.
2.2. Two-dimensional triangular lattice band structure calculation
As the simplest example of a 2D hexagonal lattice group, the triangular lattice is generated by two non-orthogonal unit vectors in real space denoted as  and
and  , where a is the distance between nearest-neighbor sites (figure 1(a)). The corresponding reciprocal lattice vector bases,
  and
and  , construct hexagonal Brillouin zones (BZs). The triangular lattice holds three high-symmetry points Γ, M and K, one rotation center of order 6 (Γ), three of order 2 (M) and two of order 3 (K), respectively (figure 1(b)). In particular, two inequivalent K and K' points in the zone boundary of the first hexagonal BZ are related under the inversion symmetry. This structure shares common rotational symmetry with that of the honeycomb lattice. The general reciprocal lattice vectors
  are spanned by
  and
and  as
as  with integers m and n.

Figure 1. (a) A photograph of the 2D triangular pattern in a thin metal film on top of the wafer. Brighter regions are where the metal film is deposited and the darker ones are the bare semiconductor surface. The theoretical (b) and experimental (c) first three hexagonal Brillouin zones of the 2D triangular lattice with three high-symmetry points Γ, M and K. (b) The three K and the three K' points are labeled with subscripts 1, 2 and 3. Color triangles along Γ, M and K for band structures are indicated in blue (the first band), red (the second band) and green (the third band). (d) Calculated single-particle band structures normalized by the characteristic kinetic energy E0 along three high-symmetry points Γ, K and M. The Dirac point is specified where two degenerate p-orbital bands meet.
Download figure:
Standard imageThe single-particle band structure is computed by solving the Schrödinger equation with an effective lower polariton (LP) mass m*,  in the plane-wave basis
  within the first BZ. The triangular periodic potential
  is assumed to have a form,
  ,
,  , where
  is the location of the lattice site center,
  is the potential of circular wells with radius, r0 , and the potential strength, V0 . The Hamiltonian operator,
  , is expressed in a matrix form by computing
  and is diagonalized. The single-particle plane-wave basis method is justified to model our system since the generated potential strength V0 induced by a thin metal film, around 200 μeV, is much weaker than the characteristic kinetic energy,
  , with effective mass m* ∼ 8.3 × 10⁻⁵m0 (m0 is the electron mass) and a = 2 μm.
Figure 1(d) plots a representative band structure in the reduced-zone scheme along the high-symmetry triangular loops in the order of Γ, K, M to Γ. The periodic potential lifts energy degeneracy at high-symmetry points. At K points, three degenerate energy states are split into the degenerate doublet and lowest non-degenerate singlet. The second and third bands form six Dirac cones at the vertices of the first BZ, and the conical singularity per vertex, a Dirac point, emerges where degenerate doublets meet.
2.3. Dirac dispersion
Near Dirac points at K and K' ( , the magnitude of the wavenumber at K and K'), we can establish the effective Hamiltonian matrix Heff expressed as a 2 × 2 matrix in terms of degenerate doublet wavefunctions and Pauli matrices, σx and σz ,
  , where 1 is a 2 × 2 identity matrix and v is the relativistic velocity defined as v = h/3m*a . The corresponding energy eigenvalues of Heff at
  are described by
  , for a small non-zero momentum deviation
  away from K points and the kinetic energy,
  . It is the equation of massless linear Dirac dispersions. For a given structure (a = 2 μm, m* ∼ 8.3 × 10⁻⁵m0), the velocity is estimated as 1.5 × 108 cm s−1 ∼ 0.003c, where c is the speed of light in vacuum.
3. Experiment and discussion
3.1. Device and experimental setup
Our microcavity consists of the 16(20) GaAs/AlGaAs mirror pairs in the top (bottom) distributed Bragg reflector and three stacks of four GaAs QWs, which are placed at the central antinodes of the intrinsic AlAs λ/2 cavity. The wafer is grown to shape a tapered cavity structure for adjusting the detuning between the cavity photon energy and the QW exciton energy. The measured quality factor (Q) of LP emission spectra below the quantum degeneracy threshold is ∼1800 at detuning value Δ ∼ − 3 meV, where Δ is defined to be the cavity photon energy offset with respect to the QW exciton energy (∼1.617 eV) at zero in-plane momentum. The QW–microcavity structure exhibits ∼13.8 meV vacuum Rabi splitting near zero detuning. We have patterned a 2D triangular lattice, whose lattice constant a is 2 μm, by a thin-metal film deposition method (23 nm/7 nm Au/Ti film) similar to our previous samples [38, 44, 49] (figure 1(a)). The device under study here is located at Δ ∼ − 5 meV.
A compact cryo-optical setup for micro-photoluminescence experiments has been constructed in both real (near-field) and momentum (far-field) spaces utilizing a straightforward Fourier optics technique. This setup has been proved to be powerful in accessing spatially (near-field) and angularly (far-field) resolved spectroscopy and imaging. The QW–microcavity device is held at ∼4 K and excited at ∼60° by a 3 ps pulsed laser at 767.7 nm with a repetition rate of 76 MHz. The excited laser wavenumber is  , and its energy is 6 meV higher than the LP state energy. The LP emission is collected through a microscope objective lens (numerical aperture 0.55) and the signals are fed either a 750 mm grating spectrometer whose angular resolution is ∼0.3° and spectral resolution is ∼0.02 nm with a nitrogen-cooled CCD for spectroscopy or into a CCD camera for imaging.
3.2. Experimental results
3.2.1. Lower polariton condensates near Dirac points
Figure 2 shows the time-integrated LP population distributions in momentum space at different pump power values normalized by the threshold power value Pth. The bright triangular peaks come from the scattered laser signal at 60°, with which we set the momentum space unit vector amplitude  drawn in the white bar in figure 2(a). Below the threshold (figure 2(a)), the emission pattern of LPs is broad, isotropic donut-shaped, which indicates the bottleneck effect arising from a negative detuning area (Δ ∼ − 5 meV). Elaborately, LPs decay through the cavity from high-energy large momentum bands before relaxing to lower-energy small momentum states. This is because stimulated scattering induced by repulsive particle–particle interaction is insufficient to reach lower momentum states (Γ point) below the threshold. However, as soon as the LP density is above the quantum degeneracy threshold (figure 2(b)), the first BZ is clearly seen with developed sharp peaks at K and K' points as well as the edges of the first BZ. In stark contrast to the boarder isotropic circle-shaped momentum distribution in figure 2(a), a narrower momentum linewidth along the first BZ implies coherence among condensed exciton–polaritons. The more LPs are created at higher pump power values, the LP population inside the first BZ grows (figure 2(g)). Note that these time-integrated images record the emission patterns from LPs in all energy values, and the energy-resolved LP population distribution in momentum space is measured with the spectrometer.
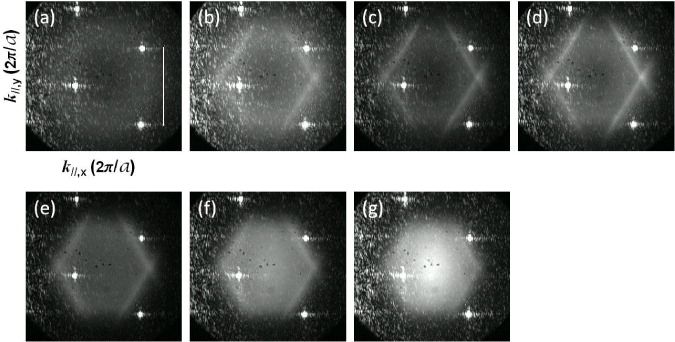
Figure 2. LP population distributions in the momentum (k∥ ,x ,k∥ ,y ) space as a function of the laser power values P/Pth ∼ 0.5, 1, 1.5, 2.1, 6.3, 14 and 25 corresponding to panels (a)–(g). The power is normalized by the threshold power value Pth ∼ 4 mW.
Download figure:
Standard imageWe collect the signatures of condensates at all K and K' points from pump-power-dependent spectroscopic measurements. We examine primarily three physical quantities from the time-integrated spectroscopic data: (i) the maximal photoluminescence signal intensity, which is proportional to the LP population, (ii) the energy of LP state and (iii) the spectral linewidth of the LP signal defined as a full-width at half-maximum. The log–log plots of the LP intensities at all K and K' points in figure 3(a) are presented against the normalized laser pump power values P/Pth, where Pth ∼ 4 mW. The nonlinearly increased LP intensity trend above P/Pth ∼ 1 is captured at all K and K' points, indicating the emergence of a massive population at these meta-stable points. The intensity saturates and falls far above pump power values (P/Pth > 7) since polaritons are finally scattered into the global ground state at the zone-center Γ point (k∥ = 0 ). Figures 3(b) and (c) present the power-dependent peak energy and spectral linewidth change. The peak energy at all K and K' points is gradually blue-shifted by 0.2–0.4 meV below threshold, which would be induced by the interaction between LPs and the exciton reservoir. At threshold, the peak energy jumps by 0.5–0.9 meV arising from the polariton–polariton interaction among LP condensates. Note that the relatively bigger energy shift near threshold in our device is consistent with the sharp increase in the LP condensate density seen in figure 3(a). It is clearly observed in figure 3(c) that there are spectral linewidth reduction near threshold and its broadening associated with the repulsive polariton interaction above threshold near K and K' points. All these experimental characteristics near K and K' points, which share the same features of conventional exciton–polariton condensation in the system ground state, verify the non-zero momentum condensation near these Dirac points. Here we emphasize that the strong coupling of LPs near K and K' points is preserved in all pump power values. Figures 3(d) and (e) draw the momentum–energy dispersions at P/Pth ∼ 2 and ∼1.3 with the uncoupled cavity photon dispersion (green; effective cavity mass ∼5.6 × 10⁻⁵m0) and the QW exciton dispersion (blue) at Δ ∼ − 5 meV. At K and K' points ( , white line), the LP energy values both below and above threshold are much lower, by 4–5 meV, than the cavity photon energy 1.615 eV. Unlike the reduction in the spectral linewidth in the weak coupling regime, the broadened spectral linewidth above threshold is clear evidence for polariton condensation in the strong coupling regime.
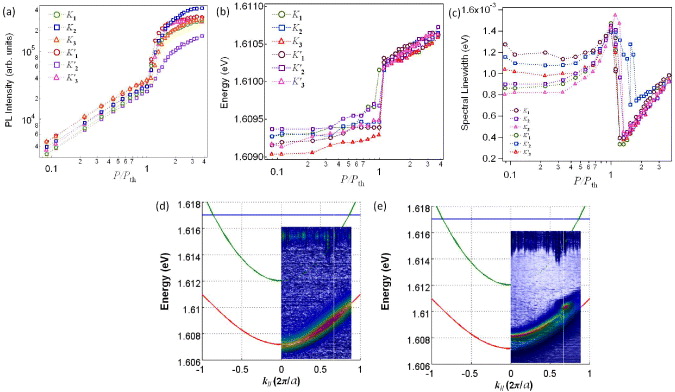
Figure 3. Exciton–polariton condensates at Dirac points. (a) The input–output characteristic in the log–log scale at all three K and three K' points. The unequivocal nonlinear intensity increase appears above P/Pth > 1. Condensate peak energy (b) and spectral linewidth are plotted against P/Pth. The momentum–energy dispersion relation along the Γ–K–M (horizontal arrow in figure 1(c)) is drawn at P/Pth ∼ 0.2 (d) and ∼1.3 (e) together with the uncoupled QW excition (blue), the cavity photon (green) and the resulting LP energy dispersion (red) at detuning value −5 meV.
Download figure:
Standard image3.2.2. Experimentally constructed band structures
The tomography of time-integrated energy-resolved momentum space spectroscopy allows us to construct the energy band structures of LPs in weak triangular lattice potentials. Figures 4(a)–(d) show the evolution of the constructed band structures in the reduced zone scheme as a function of the laser pump power values P/Pth ∼ 0.2, 0.9, 1.3 and 5. Specifically, the second and the third bands in the red and green arrows in figure 1(b) are overlapped on top of the first bands along the high-symmetry points Γ–K–M–Γ. Below threshold (P/Pth < 1), the band structures are simply the parabolic dispersions of thermal LPs, from which the effective mass of LPs (m* ∼ 8.3 × 10⁻⁵m0) is estimated from the curvature fitting. Lack of coherence among thermal LPs and their large spectral linewidth mask any visible effect of the weak triangular potential in the band structure. As the LP density reaches near the quantum degeneracy point at P/Pth ∼ 0.9 (figure 4(b)), the dispersions become broader arising from the increased polariton–polariton scatterings, and LPs start getting accumulated around local meta-stable K and M points of the band structures. This feature matches with the formation of the first hexagonal BZ in the LP momentum distribution (figure 2(b)), where the sharp Bragg peaks near K and K' points are developed. When LPs are further injected above threshold, the bands become sharper (i.e. the reduced spectral linewidth in figure 3(c)), the first energy bands at Γ point exhibit a blue energy shift by ∼1.4 meV, and the gapped higher bands at K and M points become visible (figure 4(c)). The estimated energy gap between the first and second/third bands at K points is ∼86 μeV, which is compatible with the value of the potential strength (∼200 μeV). At P/Pth ∼ 5, the band structures at K points smear due to the scatterings into Γ point, and the intensity of LPs grows at Γ point.

Figure 4. Experimentally constructed band structures of LPs at P/Pth ∼ 0.2 (a), 0.9 (b), 1.3 (c) and 5 (d) along the three high-symmetry points Γ, M, K defined in figure 1(b). The higher (lower) intensity is presented in red (blue).
Download figure:
Standard imageExciton–polariton condensates nearK points in the range of 1 < P/Pth < 5 would be stabilized by the bottleneck effect as the competition of finite lifetime and relaxation time. The finite 250 μeV linewidth of LPs makes it harder to resolve the second and third bands in the reduced zone in the Γ–K region, whose energy difference would be expected to be less than 100 μeV from the single-particle band structure calculation; however, we clearly identify the first and third bands with the gap in the Γ–K zone, the second and third bands in the K–M zone and the first and second bands in the M–Γ zone. We also capture the signatures of accumulated LPs and the linear dispersions near K points, consistent with theoretical single-particle band structures. More closely, our experimental data are fitted with the computed band structures introducing the only fitting parameter, the characteristic energy E0. The periodic potential strength V0 is fixed at 0.05E0. Figure 5(a) is a zoomed-in view of our attempt on the data along the horizontal arrow in figure 1(c) at P/Pth ∼ 1.3 with E0 = 4.5 meV, which is given by the measured effective mass (m* ∼ 8.3 × 10⁻⁵m0) below threshold and the lithographic lattice constant a = 2 μm. LPs reside inside the third BZ and the peak energy follow fairly well the third band of the calculation result. Unfortunately, we are unable to access Dirac points exactly due to the finite spectral linewidth. The full fitting results at different pump values are given along the horizontal direction through K1 point in figure 6 and along the vertical direction through K1 point in figure 7. LPs are accumulated near K and K' points from the higher bands through several paths. For example, LPs at Γ point of the third band will fall into K directly from Γ to K (Γ–K path, green arrow in figure 1(b)) or from Γ via M to K (Γ–M–K path, green arrows in figure 1(b)) inside the third bands.
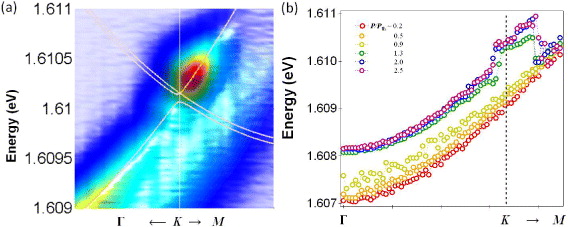
Figure 5. (a) Energy dispersions at P/Pth ∼ 1.3 along the horizontal arrow at K1 denoted in figure 1(c). The white lines are the first three Bloch bands computed in a single-particle plane-wave basis with the parameters, E0 = 4.5 meV, V0 = 0.05E0, and the energy offset 1.4 meV at Γ for the energy blue-shift due to the polariton–polariton interaction. (b) The extracted energy values at the maximum LP emission intensity are plotted against the loop of Γ, M and K. We have calculated the Dirac polariton velocity from the linear regression analysis from the K–M section.
Download figure:
Standard image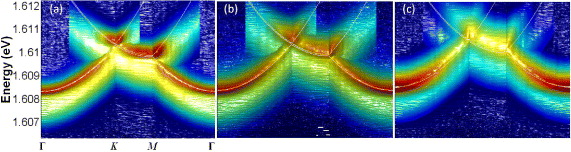
Figure 6. Experimentally constructed band structures fitted with the first three theoretical band structures (white lines) along the whole loop of high-symmetry points at P/Pth ∼ 1.3 (a), 2 (b) and 5 (c). The only fitting parameter is the characteristic energy E0 ∼ 4.5 meV, and the energy blue-shift at Γ point has been taken into account as a linear shift by 1.05, 1.1 and 1.25 meV at P/Pth ∼ 1.3, 2 and 5, respectively.
Download figure:
Standard image
Figure 7. Experimentally constructed band structures fitted with theoretically computed band structures (black dashed lines) along the vertical direction through K1 (figure 1(c)) at P/Pth ∼ 0.9 (a), 1.3 (b), 2 (c) and 5 (d). Two fitting parameters, the characteristic energy E0 and the energy blue-shift have the same values as those used for the fitting in figure 6.
Download figure:
Standard imageQuantifying the slope of the linear Dirac dispersion, we perform the linear regression analysis. Figure 5(b) is the maximum intensity plot of the cross-sectional cut in the horizontal direction from Γ through K1 to M at varying pump power values, P/Pth ∼ 0.2, 0.5, 0.9, 1.3, 2.0 and 2.5. The extracted velocity value is 1.0 × 108 cm s−1 for P/Pth ∼ 1.3, whereas it is 2.1 × 108 cm s−1, almost two times faster, for a higher pumping rate P/Pth ∼ 2. Both values are in the same order with the predicted velocity value, 1.5 × 108 cm s−1, for a given LP effective mass m* and the lattice constant a values. We conjecture that a steeper slope at higher pump rates would be associated with increased repulsive interactions among particles. The quantitative study of the interaction effect deserves deeper attention; this is left for a future investigation. At values high above threshold, the reliable linear regression analysis fails, where the relaxation to the Γ point become dominant as seen in figure 4(d).
Lastly, the position-resolved spectroscopy measurements are made for obtaining the LP population distribution in real space, which would be related with the LP population distribution in momentum space via Fourier transformation. The top panel in figure 8 displays the equi-energy map at different energy values in momentum space taken at P/Pth ∼ 1.3, and the associated near-field LP intensities are plotted in the bottom panel. Both the top and bottom figures in figure 8(a) are from the scattered pump laser light, where the positions of the lithographically patterned traps are indicated with crosses in the bottom panel since the laser lights are scattered from the metal film of the traps. The distance between the nearest-neighbor crosses is (2 ± 0.27) μm, which is the device lattice constant. First of all, these equi-energy maps in momentum space enable us to trace how LPs are relaxed from higher to lower energy states. For the states near Dirac points, the clear triangular patterns of the strong intensity peaks in real space appear outside and not at the trap positions. This observation means that the orbital symmetry of a macroscopic order parameter at this energy state is a p-like wave, responsible for the second and third bands around Dirac points. It is consistent with the single-particle band structure theoretical results.
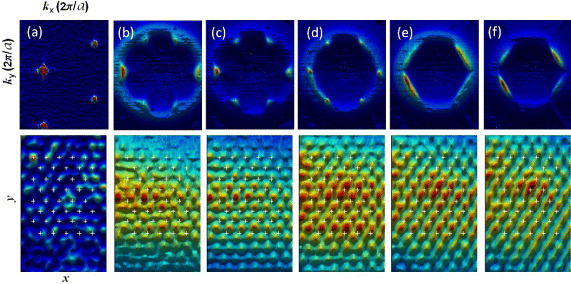
Figure 8. Equi-energy maps in momentum space (k∥ ,x ,k∥ ,y ) (top panel) and in the real space (x, y) (bottom panel). The distributions in (a) are at the pump laser energy value 1.6161 eV, and the distributions in (d) are at the Dirac point energy, 1.6102 eV. The maps in (b) and (c) are the states whose energy values are 532 and 353 μeV, respectively, above the Dirac point energy (d). The plots in (e) and (f) are the state below −175 and −353 μeV from the Dirac point energy (d), respectively. The crosses in the bottom panel are located at the position of the patterned apertures. In both panels, red color represents high intensity and blue represents low intensity.
Download figure:
Standard imageIn order to explain the position-resolved equi-energy map in real space (figure 8, bottom panel), we look at individual wavefunction intensity patterns of degenerate doublet states at K and K' points obtained from the band structure calculation. The individual p-like wavefunctions do not form the triangular pattern observed in experiments (figure 8(d), bottom). Two possible candidates for such triangular peak patterns are plotted in figure 9, consisting of two degenerate p-like wavefunctions p1, p2: (a) the coherent superposition, |p1 + ip2|2, resembling the vortex states and (b) the statistical mixture, |p1|2 + |p2|2. Since the intensity of p-like wavefunctions is zero at the core, the minimum (blue) appear at the center of traps. Although the triangular patterns appear in both cases, the coherent superposition yields the peak-array triangular pattern, whereas the statistical mixture does the valley-array triangular pattern. Our observed wavefunction in real space (figure 8(d), bottom) may resemble figure 9(a), which implies that the states at K and K' points would form vortex states. However, the unequivocal evidence for the vortex state formation at Dirac points should be acquired carefully via interferometers, where essential phase information in real space leads to a decisive conclusion to distinguish coherent vortex states from the statistical mixtures of two degenerate p-like states.
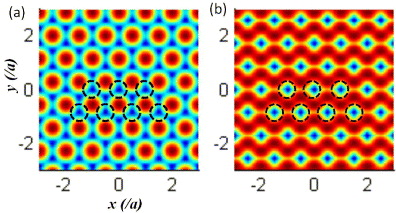
Figure 9. Intensity plots of coherently superposed two degenerate p-like states (a) and a statistical mixture of two degenerate p-like states (b) both at K and K' points. Black circles are at the trap positions. Red and blue colors in the color images represent high and low intensity values.
Download figure:
Standard image4. Conclusion
We have observed exciton–polariton condensates near the Dirac points formed at high-symmetry K and K' points of a 2D triangular lattice, originating from the two degenerate p-like orbitals. Our photoluminescence spectroscopy and images in momentum and real spaces allow us to directly measure the band structures and their corresponding orbital symmetries together. Due to the dynamical nature of exciton–polariton condensates, we are able to access the states near Dirac points, which would often be harder to approach because of complexities in condensed matter systems. The states near Dirac points would possess physical implications in future. When the degenerate states are lifted and the time-reversal symmetry is broken, these states are predicted to propagate unidirectionally, which would be interpreted to be the analogue of the electron's chiral edge states in the quantum Hall regime [16–18]. In this regime, interesting quantum order states, for example, appearing in graphene and topological insulators, would be explored in the polariton–lattice system both in real and reciprocal spaces.
Acknowledgments
This work was supported by Navy/SPAWAR through grant no. N66001-09-1-2024, the Japan Society for the Promotion of Science through its 'Funding Program for World-Leading Innovative R&D on Science and Technology (FIRST Program)' and the State of Bavaria. NYK thanks C Wu, Z Cai, K Fang, and P Kim for insightful discussion.