


Abstract
Intense, femtosecond laser interactions with blazed grating targets are studied through experiment and particle-in-cell (PIC) simulations. The high harmonic spectrum produced by the laser is angularly dispersed by the grating leading to near-monochromatic spectra emitted at different angles, each dominated by a single harmonic and its integer-multiples. The spectrum emitted in the direction of the third-harmonic diffraction order is measured to contain distinct peaks at the 9th and 12th harmonics which agree well with two-dimensional PIC simulations using the same grating geometry. This confirms that surface smoothing effects do not dominate the far-field distributions for surface features with sizes on the order of the grating grooves whilst also showing this to be a viable method of producing near-monochromatic, short-pulsed extreme-ultraviolet radiation.
Export citation and abstract BibTeX RIS

Content from this work may be used under the terms of the Creative Commons Attribution-NonCommercial-ShareAlike 3.0 licence. Any further distribution of this work must maintain attribution to the author(s) and the title of the work, journal citation and DOI.
1. Introduction
High harmonic generation (HHG) from intense relativistic laser interactions with steep plasma-density gradients is a promising route to the generation of bright attosecond-scale pulses of extreme-ultraviolet (XUV) radiation. To date, there are two main mechanisms known to contribute to this harmonic emission, coherent wake emission (CWE) [1] and the relativistically oscillating mirror (ROM) [2].
CWE involves the coupling between electromagnetic (harmonic frequency) waves and electrostatic plasma oscillations driven by bunches of electrons pulled out and subsequently driven back into the plasma density gradient via the process of Brunel heating [3]. The process is driven by plasma oscillations and, as such, the harmonic emission is limited to frequencies below the peak plasma frequency in the density gradient. The ROM mechanism is a result of the relativistic motion of the critical density surface that occurs when the driving laser has a normalized vector potential a20 = Iλ2/(1.38 × 1018 W cm−2 μm2) > 1 for the laser intensity I and the laser wavelength λ. The spectra produced by the ROM mechanism are predicted to follow a power decay law with harmonic order (In∝n−8/3) up to a rollover order nRO∝γ3 (γ is the peak Lorentz factor of the critical surface) when a0 ≫ 1 or when the interaction intensity approaches the ultra-relativistic regime [4].
The typical high harmonic spectra produced from both of these mechanisms contain a very broad range of frequencies and are generally dominated by the fundamental laser frequency. The option to select out one particular harmonic frequency would benefit applications where a narrowband XUV pulse is required, for example, in compact XUV diffractive imaging [5] or in studying XUV ionization of molecules [6]. One possible route to achieve this is the usage of high-efficiency multi-grating monochromators [7]. However, they require many grazing incidence reflections and conically mounted diffraction gratings to achieve high efficiencies leading to a complex and costly setup particularly considering the large evacuated volume require to house such an instrument which may not be possible in many laboratories.
Another scheme, recently studied through the use of particle-in-cell (PIC) simulations [8], involves generating the harmonic spectrum directly on the surface of a diffraction grating. Using an ultra-short high-contrast laser pulse can delay plasma formation damage until near the peak of the pulse where a highly reflective plasma is generated whilst preserving the initial grating surface structure. The phase structure of the grating would be imposed upon the spatial phase for each harmonic which should then disperse into its respective diffraction orders. If the grating parameters are selected such that the chosen harmonic is diffracted away from its nearby orders and, in particular, away from the fundamental laser wavelength, then a near-monochromatic beam of XUV radiation can be produced. Generating the beam in this way is compact and, due to the small numbers of grooves involved, also minimizes the pulse stretching associated with single grating monochromators.
Furthermore, using a grating with an appropriate groove shape can maximize the diffraction efficiency thus minimizing any losses due to the harmonic energy being spread amongst its diffraction orders. The real efficiency characteristics of reflective diffraction gratings are complex and depend sensitively on the groove shape. Modern numerical techniques based on an electromagnetic treatment of gratings are required to accurately predict diffraction efficiencies [9]. However, a simple rule of thumb that is particularly valid in the scalar regime (wavelength much less than the groove spacing) is that maximum efficiency into a diffraction order is achieved when the blaze condition is met, i.e. when the diffracted beam corresponds to specular reflection off the groove surface. A simple schematic of this configuration is shown in figure 1.
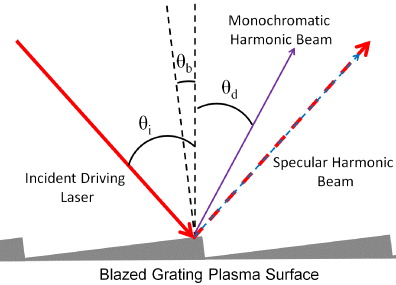
Figure 1. Schematic of harmonic generation from blazed grating surfaces. The high intensity laser pulse ionizes the grating surface and subsequently generates a harmonic spectrum which is spectrally dispersed due to the grating structure. Matching the blaze condition (θi − θd = 2θb or when the diffraction order corresponds to a specular reflection from the groove surface) allows efficient diffraction into a particular diffraction order yielding a near-monochromatic beam consisting of a single harmonic.
Download figure:
Standard imageSuch a scheme could lead to a compact source of near-monochromatic, short-pulsed XUV radiation. The term 'near-monochromatic' is used to refer to a spectrum consisting predominantly of a single harmonic which will have a bandwidth on the order of the laser bandwidth. Note that whilst high-harmonic sources are renowned for their ability to support ultra-short attosecond duration light pulses, in this scenario short-pulsed refers to pulse durations on the order of the driving laser (typically tens of femtoseconds). Nonetheless, this radiation could be used as a probe for other intense laser–plasma interactions or as a femtosecond XUV pump such as in the scheme proposed by Hu and Collins [10]. An additional benefit is that this beam will be synchronized with the reflected laser pulse which will be predominantly contained in the zero order beam opening the possibility of non-collinear time-resolved pump–probe studies between the laser and XUV pulse.
We note here that intense laser interactions with gratings have also been studied from the view of achieving extremely high fractional absorptions via excitation of surface plasma waves [11, 12] as well as improving laser coupling into fast ions [13]. Additionally, Lavocat–Dubuis and Matte have performed two-dimensional (2D) PIC simulations of a novel method to generate intense XUV light from a laminar grating target for harmonics which have a diffraction order directed along the surface of the grating [14, 15]. This emission is linked to the electron trajectories between the grooves which preferentially emit along the surface where constructive interference requires phase-matching both for emission from subsequent grooves (diffraction order condition) and between laser cycles (must be a harmonic frequency). Simulations show that this emission can surpass the efficiencies attainable from ROM for flat targets and is an exciting prospect for future experiments.
This paper will expand on previous work exploring the blazed grating scheme [8] and additionally will report on experimental observations of this effect. First it will cover a theoretical study of the relevant parameters and some of the limitations of the scheme. Next, new results from computer simulations of a high-intensity interaction with such a grating are shown followed by experimental observations of the effect in an interaction with similar parameters.
2. Theory
2.1. Fundamental diffraction grating theory
In this short section some of the key background grating theory is covered with a particular view of how this applies to the current scheme. Much of this information is familiar with regards to applications to spectroscopy, however, here some important results are derived which are of relevance to the dispersion of harmonic spectra.
Radiation of wavelength λ incident at an angle of θi on a grating with groove spacing d will be diffracted into certain angles θd called the diffraction orders. The angles at which these orders occur can be found using the well known grating equation:

where m is an integer number defined as the diffraction order. In this notation, θd is positive when the diffracted ray lies on the same side of the grating normal as the incident ray. The special case of the zero order, m = 0, corresponds to θd = −θi which is simply specular reflection.
A key consequence of equation (1) is the overlapping of higher diffraction orders for integer multiples of a particular frequency (θd will be the same for all diffraction orders am for wavelength λ/a where a = 1,2,3,...). Clearly for a harmonic spectrum this will be unavoidable and any orientation designed to extract one harmonic in its first diffraction order will also extract integer multiples of this harmonic (for example, the spectrum in the direction of the 5th harmonic's diffraction order would be expected to also contain peaks at 10th harmonic, 15th harmonic and so on). These extra orders should be significantly reduced compared to the base harmonic because they spread their total pulse energy over more diffraction orders and, if they are ROM harmonics, the generation efficiency will be lower for the higher frequencies.
Apart from this direct overlapping of integer multiple harmonics, overlapping of adjacent harmonic orders can also be an issue due to small numbers of grooves covered by the small focal spots typically required to reach relativistic intensities. Additionally, adjacent harmonic orders will generally be of comparable intensity. The resolving power of a grating is defined as

where λ is the average of two wavelengths that are Δλ apart and are just distinguishable according to the Rayleigh criterion [16].
For the case of a harmonic spectrum, where a harmonic order, n, needs to be resolved from the subsequent harmonic, the wavelength λ can be defined as

whilst Δλ is given by

where λ0 is the fundamental wavelength.
It can also be shown that the resolving power depends linearly on the number of illuminated grooves as R = |m|N [16]. Substituting these results into equation (2) yields an expression indicating the minimum number of grooves required to resolve subsequent harmonic orders (starting at n):

Note that this expression is independent of both the grating parameters and the fundamental wavelength (however the grating must be such that the diffraction order m exists). Clearly higher harmonics need more contributing grooves to be resolved unless they are used in higher diffraction orders where order overlap can be an issue. Also, this derivation is valid for plane waves (single effective angle of incidence). Therefore, the actual highest resolvable harmonic will be reduced in the case of curved harmonic wavefronts which can occur due to a number of factors dependent on the generation mechanism and interaction conditions. For example, target denting by the ponderomotive pressure of the driving laser is an issue for both the CWE and ROM mechanisms for a0 > 1 [17] whilst CWE harmonics are subject to an additional intrinsic phase that is a result of the intensity dependent return time of the electron bunches [18, 19]. This deviation from the perfect plane wave case means that the actual number of grooves needed will be higher than that given in equation (5) but the degree to which this is the case depends on the particular interaction conditions.
Another requirement is that the diffraction order is out of the cone angle of the specularly reflect laser beam. Using higher groove density gratings can disperse the higher order harmonics more to achieve this but the problem of relativistic plasma surface smoothing (discussed later) limits how far this can be taken.
2.2. Pulse stretching
Another effect that needs to be considered, and that is intrinsically linked to the number of illuminated grooves, is the pulse stretch that is inevitably introduced to a beam in a single grating monochromator. The cause of this effect is the angular chirp, Ca, introduced by the dispersive grating that can be calculated by differentiating the grating equation (equation (1)) for constant θi to yield

This angular chirp manifests itself as pulse front tilt [20] which, when focused down, will cause the temporal pulse profile to be stretched in time by a factor given by [20]

for a Gaussian shaped pulse where τnew and τp are the stretched and original full width half maximum (FWHM) pulse durations respectively, ΔλFWHM and λ0 are the FWHM linewidth and central wavelength of the pulse respectively and sFWHM is the FWHM beam size.
This equation is valid regardless of the origin of the angular chirp, however inputting the derived equation for diffraction from a single grating from equation (6) yields the stretched pulse duration

where D is the total width of the grating that is illuminated (D = Nd).
Whilst the pulse stretch for constant wavelength is clearly larger when more grooves are illuminated, equation (5) tells us that the shortest resolvable wavelength of the diffracted light will be linearly smaller. Thus always using the shortest wavelength possible (or conversely always illuminating the minimum number of grooves for a particular harmonic) should compensate any additional stretching. This behaviour is plotted in figure 2 where the pulse stretch for an increasing number of grooves is plotted for a harmonic order that is only half of that theoretically resolvable to account for additional beam spreading due to non-plane waves that would lower the resolution. Clearly the pulse stretch is only significant for very short few-cycle pulses and can be minimized by only using the minimum number of grooves required to resolve the selected harmonic.

Figure 2. (left axis) Pulse stretch factor (τnew/τp) for an initial pulse duration of 7 fs (black circles) and 30 fs (blue diamonds) for an increasing number of grooves. The first diffraction order is used and the wavelength used is the harmonic of 800 nm that is half of the maximum resolvable order for the number of illuminated grooves. The apparent oscillations are due to jumps in the wavelength caused by rounding down of the harmonic order. (right axis) The maximum resolvable order assuming a plane wave is shown by the red dotted line.
Download figure:
Standard imageAdditionally, illuminating more grooves on the same grating but always at high enough intensities to generate a high harmonic spectrum can quickly lead to unattainable laser pulse energies. Using a higher groove frequency grating would allow the use of a smaller laser spot to illuminate the same number of grooves, however, as previously mentioned, smoothing of the plasma surface during the interaction can start to become an issue.
2.3. Plasma surface smoothing
Dromey et al [17] found that surface roughness of a solid target that was on the scale of the harmonic frequency did not have any detrimental effect on the spatial quality of the generated harmonic beam. This is contrary to what would be expected for a typical reflection off a rough mirror as phase modulations on the scale of the beam wavelength will cause a breakdown in the reflected beam quality. The explanation for this effect was an apparent smoothing of the target surface prior to the interaction of the peak of the laser pulse which then interacts with a surface which is flat relative to the harmonic wavelength.
The magnitude of this effect can be estimated from the dimensionless parameter
as discussed by Rykovanov et al [21]. In equation (9), hx and hy correspond to the characteristic roughness size in the longitudinal (along normal to plane of target) and transverse directions respectively.
This parameter is based on determining the ratio between the transverse electron motion amplitude and the surface roughness size. It follows that when the transverse motion is large and ξ ≫ 1 then the surface roughness (or structured modulations) will be more smoothed out.
It was shown through PIC code simulations that even for values of ξ down to a few per cent of unity, significant smoothing still occurred, whilst values <10−3 were required for the far field distribution of the harmonics to be significantly affected by the surface structure. Clearly for the grating scheme this smoothing effect should be minimized.
For a grating surface, hy and hx correspond respectively to the groove spacing and the height of the triangular facets (which can easily be calculated as hx = hy sin θb cos θb). To get a quantitative measure of how the grating parameters will affect the degree of smoothing that will occur, figure 3 shows a map of ξ values on a plot of groove frequency against blaze angle. As discussed, ξ values less than 10−3 are required in order for the initial target structure to significantly alter the farfield distribution of the harmonics so this value of ξ is plotted as a black contour. By observing the grating parameters that satisfy this condition it can be seen that only for the very smallest blaze angles or the smallest groove spacings (realistically, typical gratings have ≈300–4000 lines per mm) will this smoothing effect be significant. These plots were produced for a single a0 value of 10, however the smoothing effect varies very weakly with a0 for larger values while it is reduced for lower ones [21].

Figure 3. Relativistic smoothing parameter for different groove spacings and blaze angles as given by equation (9) taken from [21]. The parameters chosen were a0 = 10, ωp/ωL = 20 and λ0 = 800 nm. The black line indicates a smoothing parameter of 10−3 to be used as a guide for a maximum acceptable degree of smoothing. The black arrow indicates the region where less smoothing will occur (smaller ξ value).
Download figure:
Standard image3. Experiment
Experimental shots on a diffraction grating were taken using the 'JETI-40' titanium sapphire laser system which produces pulses with a FWHM of 30 fs at 800 nm wavelength. The pulse contrast is improved before the target interaction by means of a plasma mirror system [22]. The pulse energy after contrast enhancement is ≈500 mJ. The laser pulse is then focused into the target with an off-axis parabola to a FWHM spot size of 3 μm and a peak intensity of approximately 6.5 × 10¹⁹ W cm−2 corresponding to a0 ≈ 5.5.
The main target was an inexpensive, commercially available 1200 lines per mm, aluminium coated grating with a blaze angle of 13.9°. To match the blaze condition for the third harmonic the grating was shot at an angle of incidence of 62° and the radiation emitted at an angle of 34° to the grating normal was collected by an unprotected gold mirror at grazing incidence. This mirror steered the emitted beam to a curved gold mirror to focus the beam through a 1000 lines per mm transmission grating consisting of free standing gold wires supported by a triangular shaped mesh. A microchannel plate detector was able to record the dispersed spectrum from harmonics 7 to 18.
For comparison, a fused silica glass target was shot at an angle of 48° so that the specular beam entered the spectrometer. The target and spectrometer configurations are shown in figure 4 along with a detected harmonic spectrum from a glass target as it appears on the microchannel plate detector.
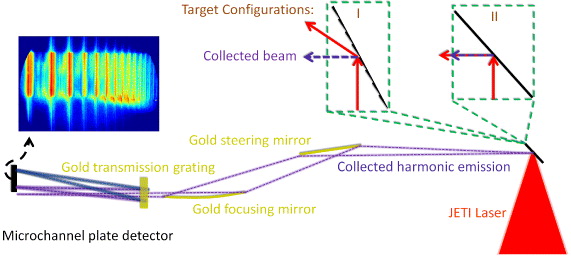
Figure 4. Experimental setup. The laser is incident on one of the target configurations shown: (I) blazed grating target with third harmonic's first diffraction order directed to the spectrometer. (II) Specular beam off a flat fused silica target directed to the spectrometer. The radiation emitted into the same angular range (≈96 ± 0.5° from the incident beam) is collected at grazing incidence by a gold mirror which steers the beam onto a curved gold mirror which is used to improve the signal to noise ratio. The collected light is dispersed using a 1000 lines per mm grating and recorded on a microchannel plate detector, imaged onto a CCD. An example of a raw harmonic spectrum obtained from a glass target is shown.
Download figure:
Standard imageA series of shots were taken for each configuration, the results of which are presented in figure 5. The data has been plotted as a set of ratios relative to the ninth harmonic signal since this is the order we expect to see strongest for these parameters. In terms of absolute signal the average grating shot gave a lower overall harmonic signal than the flat target, however the selected optimum shot had a ninth harmonic signal almost equivalent to the same order for the flat target. Whilst the drop in signal levels could be partially attributed to the introduction of the grating structure we also note that the aluminium coated grating target has a plasma formation threshold that is an order of magnitude less than that of the glass flat target [23, 24]. This lower threshold means the preplasma generated at the target surface by the rising edge of the laser pulse will have more time to expand thus impacted the harmonic generation efficiency which is well known to depend strongly on the preplasma scale length [25]. Thus it is likely that better results could be achieved with uncoated, higher damage threshold gratings.
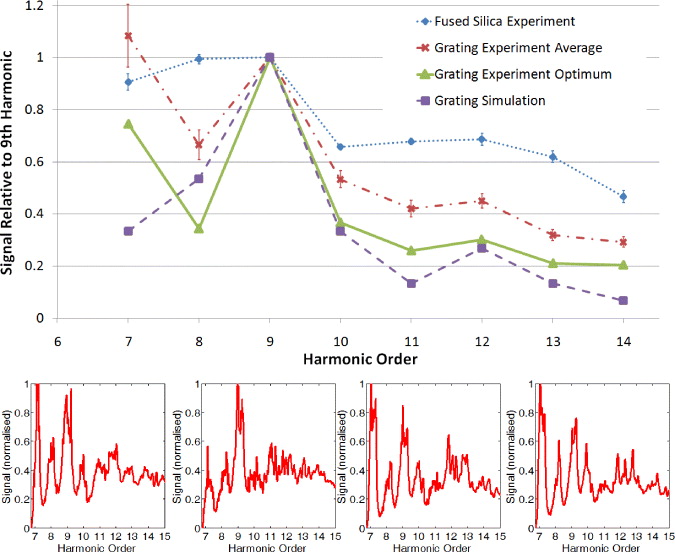
Figure 5. Experimentally-obtained spectra for the two target configurations from figure 4. Each point is calculated by taking the background subtracted signal summed over the harmonic order and then taking the ratio this makes with the ninth harmonic signal for that shot. The error bars represent the standard error for data taken from 10 and 50 shots for configuration I (red crosses) and II (blue diamonds) respectively. The green triangles show the data points for the optimum (best match with simulation) shot for the grating target. The purple squares show values obtained from 2D PIC simulations (see text). The simulation data has been normalized to the ninth harmonic so it also effectively represents relative ratios of signal. Also displayed are several typical spectra for the grating target.
Download figure:
Standard imageWhilst the spectrometer was unable to detect the spectrum in the region of the third harmonic, due to the overlapping of orders, peaks in the spectrum would be expected at 9th and 12th order. The number of grooves illuminated by the laser FWHM was approximately seven whilst equation (5) suggests four grooves are the minimum required to resolve the ninth harmonic in third order with the plane wave assumption. Despite being close to the limit of having the required resolving power, the data shows that the harmonics adjacent to the 9th order are suppressed whilst there is also a minor signal peak at the 12th harmonic, entirely consistent with our expectations of the emission in this direction. Data from PIC simulations is discussed in more detail in the next section but is also plotted here as explained in the figure for direct comparison with the experimental data. Comparing the mean data points with the simulation reveals a lower contrast between the ninth order and adjacent harmonics in the experimental results, however, the mean data is brought down by some shots that do not exhibit the grating dispersion effect as strongly. A sample of several shots for the grating target is given in figure 5 to illustrate the shot-to-shot variation of the signal. Small movements of the target surface along the laser axis during a sequence of shots can alter the spotsize and intensity on target which alters the number of grooves that the harmonic source covers. In this scenario, where the grating just barely resolves the specified harmonics, it is not at all surprising that the degree of spectral modulation fluctuates, however there is always a peak at the ninth harmonic.
For a reliable comparison with simulation one particular shot, which showed a strong effect, is plotted separately. As shown by figure 5, the best case shot (shown by green triangles) shows a much stronger suppression of orders adjacent to the ninth than the average of the shots and matches the simulation data much more closely. As mentioned earlier, the optimum shot gives ninth harmonic emission with comparable signal strength to that obtained from a flat fused silica target. As a guide, previous measurements of glass target efficiencies using a calibrated spectrometer for similar interaction conditions (intensity and angle of incidence) yielded efficiencies of between 10−4 and 10−5 for the 17th harmonic depending on the exact scale length conditions [26]. The arrangement in this setup looked at lower order harmonics where the efficiencies are typically higher so these values form a lower estimate for the glass target values in figure 5.
The seventh harmonic signal variation is much larger as can be clearly seen in the individual shot spectra. A possible explanation could be that different intensity shots interact with differently shaped density ramps due to variation in the plasma formation time. As shown by Dromey et al [27] this can lead to significant modification of the harmonic spectrum for sub plasma frequency CWE orders. That this does not occur for the glass target could be a result of the higher damage threshold placing the plasma formation time at a more stable point in the pulse. We stress that this is only a possibility and that the exact reasoning behind the seventh harmonic fluctuation is not fully understood at present.
Improvements to the signal stability could be obtained from the use of higher damage threshold grating targets, stabilization of the laser parameters and the use of larger spotsizes to illuminate more grooves keeping in mind that this will also increase the pulse duration.
We note that modulations of similar periodicity were observed by Watts et al [28] from interactions of picosecond duration pulses with flat solid surfaces at similar intensities to those studied here, albeit with longer pulses. These modulations were attributed to higher order mode oscillations in the nonlinearly driven critical surface. The scale length of the plasma gradient in that experiment was <10 μm or several times the laser wavelength whereas is it is known that for femtosecond scale lasers that the harmonic efficiency drops rapidly for scale lengths longer than a wavelength [25]. The explanation is that in the experiment of Watts et al [28] the longer pulse duration of the laser is able to ponderomotively steepen this long scale length up to the critical density surface where the main interaction can take place [29]. For the high-contrast femtosecond-scale laser system used in the current experiment we have a sub-wavelength scale-length plasma that is short enough to allow steepening up to nearly the peak initial plasma density [27]. As such, the base modulation frequency of the interaction surface will be many times higher than the laser frequency (up to 20 times for this target)—an effect also supported by one-dimensional PIC simulations performed by Boyd and Ondarza–Rovira [30]. Furthermore, the modulations seen here are much deeper than those reported by Watts et al and are not present in the flat glass spectra (see the individual shots shown in figure 5). Finally we note that the current effect is consistently at the same harmonic orders and occurs where it is expected for this particular grating whereas those observed in [28] are reported to occur at different harmonic orders for different shots thus the positions of the peaks in the modulations are dependent on the exact interaction conditions rather than the target structure as in the current case.
4. Particle-in-cell simulation
By extrapolation of the experimental data one would expect further distinct peaks at sixth and third harmonic, a spectral range not covered by the diagnostic in this case. For this reason and to confirm the origin of the current data, simulations of the interaction between an intense laser pulse (a0 = 5, pulse duration of 20 fs and FWHM spotsize of 2 μm) and a grating surface were performed using the three-dimensional PIC code ILLUMINATION [31] in 2D operation. The grating parameters were identical to that used in the experiment—1200 lines per mm and 13.9° blaze angle shot at an angle of incidence of 62°.
The computed data was interpreted in a similar manner to that of [8] where the intensity and phase for each harmonic along a cross-section of the diffracted beam is obtained by frequency filtering of the field versus time values at each point. As a further step, farfield angular distributions for each harmonic have been obtained by Fourier transforming of the field amplitude and phase data obtained this way. The resulting distributions are displayed in figure 6 along with solutions for the diffracted angle from equation (1). Comparing the positions of these solutions with the peaks in the distributions it is clear that, apart from some minor deviations, the grating effectively disperses the harmonic spectrum according to the angles given by the grating equation. That the efficiency is less than that suggested by the experimental data, ≈10−6 as opposed to ≈10−4,5 discussed in the previous section, can be explained by the step density ramp in front of the target in the simulation which is known to reduce harmonic efficiencies as compared to a small finite initial density ramp.
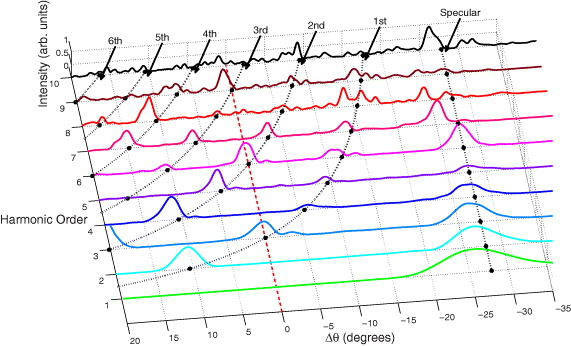
Figure 6. Simulation results showing angular divergences of different harmonic orders generated from a diffraction grating target. The 800 nm wavelength laser had an a0 = 5, pulse duration of 20 fs and a FWHM spotsize of 2 μm and the target density was 100 times greater than the critical density. The grating was a 1200 lines per mm, 13.9° blaze angle and the angle of incidence was 62°. The divergences are obtained from Fourier analysis of field amplitude and phase values obtained along a line set transverse to the diffracted beam. The Δθ = 0 point corresponds to the third harmonic diffraction order itself (also indicated by the dotted red line). The values for each harmonics are normalized to their own individual distributions in order to have all their features visible on the same scale. The black dots indicate the locations of the diffraction orders according to equation (1) whilst the labelled dotted lines indicate which diffraction order they correspond to.
Download figure:
Standard imageAlso, along the direction of interest for the experiment (Δθ = 0 and indicated by the dotted red line) the third, sixth and ninth harmonics all exhibit strong diffraction orders. Also notable is that the diffractions orders that are closer to the zero order tend to be much weaker which suggests the blaze of the grating is dominating the diffraction efficiencies.
To extract a spectrum that is comparable to the experimental data, the signal over a 1° cone angle centred on the Δθ = 0 point is integrated for each harmonic order. The complete spectrum from 1st to 15th harmonic (where the field data falls below the level of numerical noise) is given in figure 7 whilst normalized data for harmonics 7–13 is also plotted in figure 5 along with the experimental results in this spectral region.
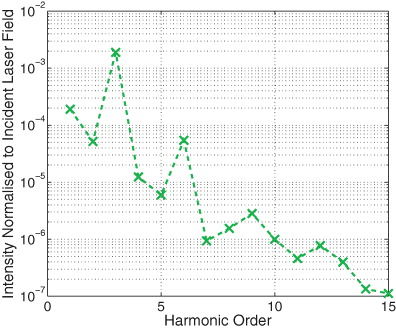
Figure 7. Far-field spectrum from PIC simulation calculated by integrating each harmonic's angular distribution over a 1° cone centred on the third harmonic's first diffraction order. Angular distributions are the same as those calculated for figure 6. The plot values have been normalized to that of the incident laser field.
Download figure:
Standard imageThe simulated data fits quite well with the experimental results suggesting the observed trend is indeed due to the grating dispersion into the expected diffraction orders. Furthermore, figure 7 shows much better contrast with the signal from adjacent harmonics for the third and sixth harmonics suggesting the scheme works better in lower diffraction orders as expected. Selecting higher harmonics will require the use of gratings with a higher groove density and/or a larger focal spot.
5. Conclusions
In summary, experimental results have been presented which demonstrate the use of a grating as a target for HHG from a relativistic laser–plasma interaction leading to the separation of a selected harmonic and, to a lesser extent, integer-multiple harmonics. The results showed that a grating, blazed for the 3rd harmonic directed to the spectrometer, consistently produced spectra with strong signal at 9th harmonic relative to adjacent orders and a lesser signal peak at the 12th harmonic. PIC simulations showed the same effect in this spectral region as well as much more pronounced peaks at third and sixth harmonics thus the experimental data is evidence of effective monochromatization of the third harmonic. These results suggest that harmonic generation directly from a grating surface is a potential route to near-monochromatic, short-pulsed XUV radiation.
These results also show that significant smoothing of the grating surface does not occur over the timescale of the laser pulse in this case for feature sizes on the scale of the grating grooves (≈200 nm height and ≈830 nm width) which is a critical requirement for the scheme to work. Future work will attempt to test this effect at higher harmonic orders and higher groove density gratings.
Acknowledgments
We thank M Geissler for the use of the ILLUMINATION code and F Ronneberger and B Beleites for operating the JETI laser. This work was funded by Laserlab Europe, EPSRC and DFG TR18. CR acknowledges support from the Carl Zeiss Stiftung.