


Abstract
A feature common to various solids, including single-alkali (SA) and mixed-alkali (MA) glasses, is a frequency-dependent ionic conductivity that shows the power law and the linear behavior with frequency. In spite of the advances made, the origin of this behavior continues to be controversial. We report our measurements of the conductivity of a series of MA borate glasses (Li1−xAx)2B4O7 (A = Na, K, Rb, Cs; 0 ⩽ x ⩽ 1.0) in the frequency range of 100 Hz–15 MHz and in the temperature range from 300 K to less than the glass transition temperature Tg . Using a self-similar spatial structure model, we show that the real process of ionic transport in the SA and the MA glass systems can be described by the fractional kinetic equations containing non-integer integration/differentiation operators. In the procedure of a systematic deduction of the ionic transport in glass systems, we obtained two important insights. Firstly, the time-dependent conductivity σ(t) ∼ exp (t/τc)α reproduces the empirical expression of mean square displacement of the mobile ions 〈r2 (t)〉 ∼tα as a first approximation of ions moving through the fractal pathway and leads to the universal power-law behavior at frequency scales. Secondly, the modified fractional Rayleigh equation with a repulsive interaction provides a quantitative explanation for experimental findings on the SA and the MA glasses. Investigations on the power-law exponent β in the SA and the MA borate glasses indicate that the ions move through the different branches of the fractal structured conduction pathways due to the structural character, associated with a site mismatch effect, and Coulomb blockade by the randomly distributed ions.
Export citation and abstract BibTeX RIS

Content from this work may be used under the terms of the Creative Commons Attribution-NonCommercial-ShareAlike 3.0 licence. Any further distribution of this work must maintain attribution to the author(s) and the title of the work, journal citation and DOI.
GENERAL SCIENTIFIC SUMMARY Introduction and background. It is known empirically that the macroscopic behavior of the real part of conductivity for ion conducting materials, including single and mixed alkali glasses, can be well described by a power law. The dynamical origin of ionic conductivity in a glass state has been an unsolved problem for decays since Jonscher's power law was published in Nature in 1977.
Main results. Based on the modified fractional Rayleigh equation we show that the ionic transport in both the single and mixed alkali glasses can be described including a repulsive interaction caused by a site mismatch effect and Coulomb blockade by the randomly distributed ions. From the power law exponent, we have found that the ions of the single and mixed alkali glasses are moving through the first and second branches of the fractal pathways, respectively. With the Arrhenius relation of hopping frequency and a mass dependent characteristic time, we verify that the local potential energy of the mixed alkali glasses is quite a lot deeper than one of the single alkali glasses.
Wider implications. The understanding of ionic migration mechanisms in glasses is of fundamental importance and may be applicable to the design of new glasses.
 Figure. The conductivity (a) and the power law exponent (b), for the single and mixed alkali glasses.
1. Introduction
The high ionic conductivity of glasses has an important role in potential applications of glasses as the solid electrolytes in electrochemical devices such as batteries, memory devices, chemical sensors and smart windows [1]. The understanding of transport mechanisms of ionic migration in glasses is of fundamental importance in many branches of material science, and may be applied for the designing of new glasses with optimized properties for various different applications. Although a number of experimental and theoretical efforts have led to some general rules and empirical relations for ionic conductivity in glasses, ion transport in disordered materials remains one of the unsolved problems of glass science.
It was known empirically that the macroscopic behavior of the real part of conductivity, Re σ (ω ) , for a variety of ion-conducting materials, including single-alkali (SA) and mixed-alkali (MA) glasses, could be well described by an equation of the form Re σ (ω ) = σdc [1 + (ω /ωh )β ] + Bω , where σdc is the conductivity at the frequency ω = 0 , B is a constant, ωh is the hopping frequency defined by Re σ (ωh ) = 2σdc and 0 < β < 1 is the Jonscher fractional exponent [2]. The ionic conductivity can be decreased drastically by adding a fraction of the mobile ions with another type of mobile ion to an SA glass. This pronounced decrease in conductivity with a nonlinear relationship is referred to as the mixed-alkali effect (MAE) [3].
Throughout the years, several important structural properties of the SA and MA glasses have been identified through experimental measurements and computer simulations. These are the following: (i) the cations retain the same specific coordination environment as in the SA glasses [4, 5]; (ii) the different alkali cations are intimately mixed on the microscopic scale [6, 7] and have distinctly different conduction pathways of low dimensionality [8]; (iii) an MA slowdown is observed in the longer residence time as well as from the increased likelihood of back-jumps [9]; (iv) Coulomb interaction has to be taken into account for explaining the differing behavior of activation energies in the single modified and the mixed ion glasses [10]. It has also been shown in experiment that the power-law exponent β of the MA oxide glasses in many other systems is lower than that of the SA glasses [11].
To the best of our knowledge, however, neither the models nor the simulations appear to address the process of transport dynamics for reflecting the structural energy landscapes in the glass systems, and no attempts have so far been made to explain why the power-law exponent β of the MA oxide glasses is lower than that of the SA glasses.
In this paper, using a self-similar spatial structure model, we obtain the time-dependent conductivity expression that leads to the universal power law and the linear behavior at frequency scales. We present evidence that the real process of ionic transport in both the SA glass and the MA glass systems can be described by the fractional kinetic equations containing non-integer integration/differentiation operators. To do this, we report the ac conductivity, in addition to the previous measurements of the dc conductivity [12–14], in a series of MA borate glass systems (Li1−xAx)2B4O7 (A = Na, K, Rb, Cs) at various temperatures, where x = 0, 0.2, 0.3, 0.5, 0.7, 0.9 and 1.0. The power-law exponent β in the SA and the MA borate glasses is analyzed in detail.
2. Materials and experimental methods
For brevity, we simplify the notations according to the Li/A atomic ratio, where A is four different alkalis (e.g. Na, K, Rb, Cs). They are (Li1−xNax)2B4O7 ≡ LNBO, (Li1−xKx)2B4O7 ≡ LKBO, (Li1−xRbx)2B4O7 ≡ LRBO, (Li1−xCsx)2B4O7 ≡ LCBO, (Li1−xAx)2B4O7 ≡ LABO, Li2B4O7 ≡ LBO, Na2B4O7 ≡ NBO and K2B4O7 ≡ KBO. The samples of LBO, NBO and KBO are the SA glasses. The SA glass is the sample with composition x = 0 and 1 in LABO system. The samples of LNBO, LKBO, LRBO and LCBO with x = 0.2, 0.3, 0.5, 0.7 and 0.9 are the binary MA glasses having two types of cations.
Samples were prepared by mixing stoichiometric amounts of Li2B4O7, Na2B4O7, K2CO3, Rb2CO3, Cs2CO3 and B2O3. The powders were ground with a mortar for an hour to obtain uniformly distributed mixtures. The powder samples were melted in a Pt crucible in an electric furnace at 1073–1273 K for 15 min. The melts were quenched onto either a copper plate or the twin rollers. The twin roller quenching method allows reaching a quenching speed of about 106 K s−1 and thus this technique is useful in providing the homogeneous glass phase samples. Using the copper plate we obtained glass samples of LNBO and LKBO about 1 mm in thickness, while we obtained LRBO and LCBO glass samples about 0.1 mm in thickness by using the twin roller.
Figure 1 shows the x-ray diffraction (Rigaku, Japan) pattern of the LNBO (x = 0.5) sample under the glass transition temperature that has no characteristic peaks related to the crystalline phase. Therefore, the quenched sample is amorphous. The inset of figure 1 shows a differential scanning calorimeter (DSC) curve for LNBO (x = 0.5) glass, measured at a heating rate of 2 K min−1. The glass transition temperature, Tg, of the LNBO (x = 0.5) sample is determined to be 704 K and the supercooled liquid region extends up to 763 K just before the start of crystallization, Tc, which appears as an exothermic peak. Tg was determined from the expansion curve using the intercept method.
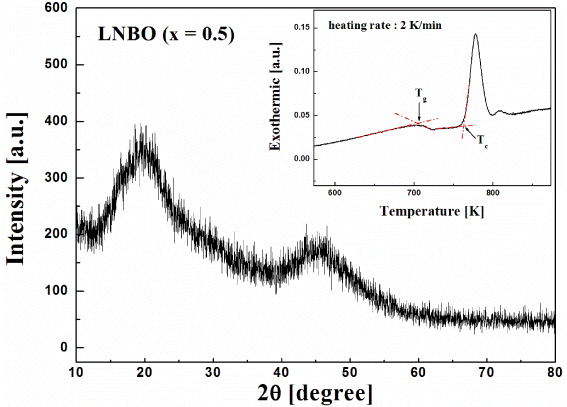
Figure 1. X-ray diffraction pattern of the MA LNBO (x = 0.5) glass. Inset: a DSC curve for LNBO (x = 0.5) glass, measured at a heating rate of 2 K min−1. The glass transition temperature is denoted as Tg and the crystallization temperature as Tc.
Download figure:
Standard imageThe frequency-dependent conductivity spectra at various temperatures were determined by using the impedance/gain-phase analyzer (Hewlett-Packard LF4194A, USA). Gold electrodes with a radius of 1.5 and 2.0 mm were deposited directly on both the surfaces of the samples of LA1BO (A1 = Na, K, Rb) and LCBO, respectively, by using vacuum evaporation, and gold leads were attached to them with silver paste. The frequency range was 100 Hz –15 MHz and the heating rate was 2 K min−1. The sample was clear enough to deposit the electrodes directly without polishing the surface of it.
3. Theoretical details
3.1. Time-dependent conductivity
Empirically, the ac part of the conductivity Kωβ with a constant K being real was obtained by assuming that the time-dependent mean square displacement of mobile charge carriers was described by 〈r2 (t)〉 ∼tα , where β = 1 − α [15, 16]. In this section we attempt to develop a general relationship that exists between the measured function Reσ (ω ) = σdc + Kωβ and the time-dependent mean square displacement, 〈r2 (t)〉 ∼tα , of mobile charge carriers.
Swenson and Adams [8] suggested that the two types of alkali ions were randomly mixed and have distinctively different conduction pathways of low dimensionality by applying the bond-valance technique to reverse Monte Carlo (RMC)-produced structural models for a system of MA phosphate glasses. In addition, it was shown that the experimental ionic conductivity and activation energy could be determined directly from the volume fraction of the percolating pathway cluster, F, of the bond-valence RMC method [17, 18]:

where A1 and B1 are constants, σexp is the experimentally determined conductivity, T is the temperature, M is the mass of a cation, EA is the activation energy and kB is the Boltzmann constant. The correlation between the free pathway volume, F, and the electrical conductivity was also tested for binary sodium silicate glasses [19].
In reality, conduction takes place on some complex subset of the three-dimensional percolation clusters and the aggregation of microscopic particles diffusing in a fluid medium represents a common process leading to fractal structures. In the general frame of site percolation, Mustarelli et al [20] successfully explained that in AgI-based fast ion conducting glasses, the ion transport takes place along nanochannel pathways with fractal structure. In addition, Sanson et al [21] found a general correlation between the Ag–I distance and ionic conductivity in AgI fast ion conducting glasses by extended x-ray absorption fine structure spectroscopy (EXAFS) measurements. Thereby they suggested a connection between the ionic conduction pathway volume defined by Adams and Swenson and the mean volume of the Ag–I coordination sphere. Therefore we can assume that the percolation object, which has a fractal structure, consists of the effective volume occupied by the aggregation of the conducting monomers. We shall derive the time evolution expression for the conductivity in such a conducting pathway of low dimensionality.
Now we consider the irreversible aggregation and clustering phenomena that are modeled by the Smoluchowski coagulation equation of the form [22]

The Smoluchowski equation describes the time evolution of the cluster-size distribution {ck (t)} and the coagulation kernel K(i,j) in equation (2) represents the rate coefficient for a specific coalescence between clusters of sizes i and j. In irreversible aggregation processes, the cluster-size distribution approaches a scaling form, in general

where f is a scaling function which depends on certain characteristics of the coagulation coefficients, f(x) ≪ 1 for x ≫ 1 and f(x) ∼ exp (−xΔ) with Δ some negative constant for x ≪ 1 [22, 23]. Using Smoluchowski's coagulation equation, it may be possible to determine that the exponents in the mean cluster size k(t) ∼ tz when  , resulting in the small- and large-x behavior of the scaling function f(x). The dynamic scaling in equation (3) is expected to describe the evolution of the process in the limit when the particle density is small (ρm ≪ 1 ). In addition, k ≫ 1 and t ≫ 1 are required in order to be in the scaling region. There is an upper bound for the time variable t < τc . This upper bound is defined as the time of complete formation of the aggregates in a finite system for the aggregation process and, similarly, as the time of gel appearance in the gelation process. The cluster-size distribution can be measured by the first cumulant, K1, of the autocorrelation function of the quasielastic light scattering experiments [24]. For the cluster-size distribution, ck, the first cumulant is given by

where q is the scattering vector, Dk and A are, respectively, the translational and rotational distribution constants of mass k, Sk(q) is the scattering factor of a k-cluster and I(q,0) is the time-averaged total scattered intensity [23, 25].
By using the scaling assumption in equation (3), we can determine the effective volume, V(t) , occupied by the cluster as follows [23]:

where Vk = kd/Df is the effective volume occupied by a k-site cluster and the prefactor is chosen so that V(1) = ρm , since V(1) is equal to the volume fraction of the diffusing particles at the first time step. Here, ρm is the density of particles, d is the spatial dimension and Df is the fractal dimension of the aggregates.
As a consequence of mass conservation in the diffusion-limited cluster–cluster aggregation (DLCA) model, conservation of the total number of particles enforces a particular value on exponent θ = 2 and Df = 1.75 in equations (3) and (5) [23, 26]. The fractal dimension Df can be determined by using light scattering and small angle x-ray scattering measurements. In the context of conservation of the total number of particles in the system, the DLCA model is more appropriate for the ionic conduction system. However, it should be noted that it is characterized by different scaling exponents θ and z for many different aggregation phenomena, especially with the non-conserved polymer systems [27].
A time-dependent conductivity relation yields from equations (1) and (5) the following:

where σ is the ac conductivity, T is the temperature, ρm is the mass density of mobile particles and M is the mass of a cation. This equation reveals that the percolation cluster of mobile ions in the materials has formed with the fractal pathway structure. The supporting evidence for this is the fact that the increase of characteristic cluster size with time is reasonably well described by exp (c't) for an extremely slow aggregation of colloidal particles, as well as for the conducting mobile ions of the alkali–metal glass systems, where c' depends on the experimental conditions [18, 24]. Consequently, our model represents that the percolation takes place along the low-dimensional conduction pathways with fractal structure. It is noteworthy that the ions are moving through the constructed structural pathways in geometry and, correspondingly, the fractal dimension of the pathways is the same for all ionic elements for a given system.
The exponent z is equal to 1 in equations (5) and (6) in the case of the DLCA and therefore we may rewrite the expression of the ac conductivity, σ(t) , in three dimensions in equation (6):

where  , constant C, and a characteristic time
 ![$\tau _{\rm{c}} = [\rho _{\rm{m}} \sqrt M ]^{-1/3\alpha }$](https://content.cld.iop.org/journals/1367-2630/15/2/023005/revision1/nj441160ieqn3.gif) . The obtained time-dependent conductivity in equation (7) exhibits the implicit contributions from all significant interactions with anions and the effects of local structure in the glass systems, since the structural correlations for various types of mobile ions are combined to a unified empirical relationship by the cation mass as a scaling factor in glass systems [18]. The different structural energy landscapes can be taken into account for explaining the various contributions from all significant interactions such as site relaxation, a selective hopping mechanism and static disorder in the network. Therefore, equation (7) may permit an empirical description of the interplay between glass structure and ionic conductivity for various systems, such as the SA and MA alkali glasses. It is interesting to note that the exponent α of ac conductivity in equation (7) depends on the fractal structure in geometry. As mentioned above, we reiterate here that the ac conductivity in equation (7) is due to the movement of conducting ions in the percolation cluster with the fractal structure pathway.
. The obtained time-dependent conductivity in equation (7) exhibits the implicit contributions from all significant interactions with anions and the effects of local structure in the glass systems, since the structural correlations for various types of mobile ions are combined to a unified empirical relationship by the cation mass as a scaling factor in glass systems [18]. The different structural energy landscapes can be taken into account for explaining the various contributions from all significant interactions such as site relaxation, a selective hopping mechanism and static disorder in the network. Therefore, equation (7) may permit an empirical description of the interplay between glass structure and ionic conductivity for various systems, such as the SA and MA alkali glasses. It is interesting to note that the exponent α of ac conductivity in equation (7) depends on the fractal structure in geometry. As mentioned above, we reiterate here that the ac conductivity in equation (7) is due to the movement of conducting ions in the percolation cluster with the fractal structure pathway.
With the expansion of ![${\rm exp}[x] = 1+x+\frac{{x^2 }}{{2!}}+\frac{{x^3 }}{{3!}}+ \cdot \cdot \cdot $](https://content.cld.iop.org/journals/1367-2630/15/2/023005/revision1/nj441160ieqn4.gif) , equation (7) can be rewritten as
, equation (7) can be rewritten as

where Γ (n) refers to the Euler gamma function and C is a constant. The first term with n = 0 in equation (8) corresponds to the conductivity independent of time. We note that the second term of the series expansion with n = 1 in equation (8) is identical to the mean square displacement of the mobile ions in the linear response theory, 〈r2 (t)〉 ∼tα , which is empirically given in [15, 16]. The term with n = 1 and 2 in equation (8) leads to the expression for the conductivity of SA and MA ions, respectively. We will show it later in an explicit manner.
In the linear response theory, the characteristic time τc is related to the activation energy as follows [16]:  . From a fit to the bond-valance RMC, the activation energy of ionic conducting glasses is given by
  in equation (1). That is, the conductivity obeys the Arrhenius relation. Thus, we may obtain the corresponding activation energy of alkali glass, EA = −kB
T
in equation (1). That is, the conductivity obeys the Arrhenius relation. Thus, we may obtain the corresponding activation energy of alkali glass, EA = −kB
T
 , by adopting the characteristic time
 ![$\tau _{\rm{c}} = [\rho _{\rm{m}} \sqrt M ]^{-1/3\alpha }$](https://content.cld.iop.org/journals/1367-2630/15/2/023005/revision1/nj441160ieqn8.gif) in equation (7).
in equation (7).
3.2. Anomalous transport and hopping
We shall develop the processes of transport events by a simplified model, as illustrated in figure 2, of the mobile ions that undergo an anomalously slow transport through a self-similar conducting pathway within an intra-cluster and then hop to an adjacent inter-cluster. After undergoing sub-transport in a cluster, the mobile ions hop from one percolation cluster to an adjacent cluster due to an external driving force. It is presumably considered, for example, that the potential energy at branch i of a cluster in figure 2 is the same as that at branch i of an adjacent cluster. This type of equipotential branches can exist either in the inter-clusters or in an intra-cluster. Thus, the hopping process may be possible both in the inter-cluster and in an intra-cluster, since it is easy to hop where the potential energy is the same. We note that the exponent n in equation (8) represents successive fractal branches in the percolation object. The dc conduction may arise from ions moving through the many inter-cluster pathways and the ionic conducting character in n = 0 pathway necessarily requires ion displacements that are uncorrelated and non-fractal.
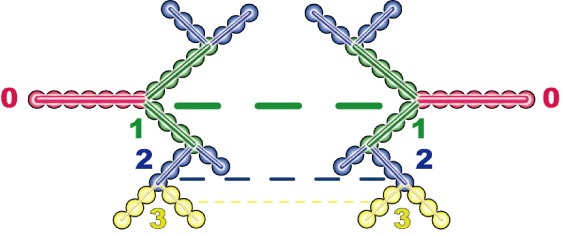
Figure 2. Diagram of the ionic transport through the objects with a fractal structured pathway. The number indicates the branch of the pathway in a cluster. The solid line represents the movement of mobile ions inside the intra-cluster. The dashed line represents the hopping ions moving through the inter-cluster from a cluster to an adjacent cluster. The hopping for ac conductivity may also be possible for the ions from the ith branch to another ith branch in an intra-cluster. dc conduction may arise from ions moving through the transport of a long chain of inter-cluster pathways.
Download figure:
Standard imageWe shall now derive the microscopic foundation of dispersive transport close to thermal equilibrium starting with the explanation by Metzler and Klafter [28]. That is, from the continuous time version of the Champman–Kolmogorov equation combined with the Markovian Langevin equation of a damped particle in an external force field, a fractional Klein–Kramers equation is derived whose velocity averaged high-friction limit reproduces the fractional Fokker–Planck equation, and explains the occurrence of the generalized transport coefficient η * . Based on the continuous time version of the Chapman–Kolmogorov equation in the long-time limit t ≫ max{ τ ,τ *} , one obtains the fractional Klein–Kramers equation [28, 29]

where v* ≡ vτ
*/τα is the velocity with ![$[v^{*}] = {\rm{cm}}\,{\mathop{\rm s}\nolimits} ^{-\alpha }$](https://content.cld.iop.org/journals/1367-2630/15/2/023005/revision1/nj441160ieqn9.gif) , η
* ≡ η
τ
*/τα denotes the friction constant with
, η
* ≡ η
τ
*/τα denotes the friction constant with ![$[\eta ^{*}] = {\mathop{\rm s}\nolimits} ^{-\alpha }$](https://content.cld.iop.org/journals/1367-2630/15/2/023005/revision1/nj441160ieqn10.gif) , F*(x) ≡F(x)τ
*/τα is an external force field in phase (position–velocity) space with
, F*(x) ≡F(x)τ
*/τα is an external force field in phase (position–velocity) space with ![$[F^{*}] = {\rm{cm}}\,{\rm{g}}\,{\mathop{\rm s}\nolimits} ^{-1-\alpha }$](https://content.cld.iop.org/journals/1367-2630/15/2/023005/revision1/nj441160ieqn11.gif) , τ
* is the inter-trapping time scale, and τ is the internal waiting time scale. They obtained equation (9) by means of a non-Markovian generalization of the Chapman–Kolmogorov equation. The relation between the Klein–Kramers equation and the Langevin equation is given in [29, 30]. On the right-hand side of equation (9) in brackets, the first term describes the spatial drift due to the velocity, the second term accounts for the friction and external force feedback to the velocity as expressed through the corresponding Langevin equation, and the third term represents the entropy-based velocity diffusion. The Langevin picture rules the Markov motion parts in between successive trapping states, indicating that the result gives some insight into the fractional Fokker–Planck equation for multiple trapping systems [29]. The integration of the fractional Klein–Kramers equation (9) over the position coordinate leads in the force-free limit to the fractional Rayleigh equation [28, 29]
, τ
* is the inter-trapping time scale, and τ is the internal waiting time scale. They obtained equation (9) by means of a non-Markovian generalization of the Chapman–Kolmogorov equation. The relation between the Klein–Kramers equation and the Langevin equation is given in [29, 30]. On the right-hand side of equation (9) in brackets, the first term describes the spatial drift due to the velocity, the second term accounts for the friction and external force feedback to the velocity as expressed through the corresponding Langevin equation, and the third term represents the entropy-based velocity diffusion. The Langevin picture rules the Markov motion parts in between successive trapping states, indicating that the result gives some insight into the fractional Fokker–Planck equation for multiple trapping systems [29]. The integration of the fractional Klein–Kramers equation (9) over the position coordinate leads in the force-free limit to the fractional Rayleigh equation [28, 29]

The fractional Rayleigh equation is equivalent to the fractional Fokker–Planck equation with a linear force and therefore corresponds to the sub-diffusive Ornstein–Uhlenbeck process [31]. Here, the Riemann–Liouville fractional operator, 0 Dtp , is defined by the convolution [28]

for n ⩾ Re(p) >n − 1 . In the case of the fractional Rayleigh equation (10), the mean velocity obeys

with η
* ≡ η
τ
*/τα , as is readily verified by  , followed by an integration by parts of the right-hand side in equation (10). We note that the solution of the fractional relaxation equation in equation (12) is given in terms of the Mittag–Leffler function,
  [28, 29]. The right-hand side of dynamic equation (12) is negative and therefore the acting force in the system is attractive.
Based on the experimental studies from EXAFS [32, 33], NMR [34] and infrared spectroscopy [35, 36], x-ray and neutron scattering measurements [5], it is commonly accepted that the origin of MAE has structural character, associated with a mismatch effect [37, 38]. A mismatch arises when one type of cation tries to enter a site created earlier by another in the glassy network. The mismatch effect in hopping systems can be modeled by site energies that are different for different types of ions [38]. Swenson et al [5] showed that the two different kinds of alkali ions are randomly mixed and are located in essentially one-dimensional pathways and the presence of B ions in the pathways of the A ions must result in an effective blocking of many of the energetically most favorable pathways for the A ions, and vice versa. Again, the blocking of migration pathways is caused by the site mismatch effect, and correspondingly the gradient of site energies drives the ions to move along pathways with a low-energy site for one type of ion and a high-energy site for the other type. Therefore, the momentum of ions can be changed because of the blocking of migration pathways. It is emphasized that there is neither a crucial role of repulsive Coulomb blockage nor a site mismatch for the SA glass and the various modified alkali–metal ion conducting glasses. Maass also suggested that Coulomb interaction between mobile ions with strength q2 /av = 20 have to be taken into account for explaining the differing behavior of activation energies in single modified and mixed ion glasses, where q is the effective charge of the mobile ions, a is the distance between the ions and the parameter v in the energy functions defines an energy scale [10]. The Coulomb interactions cause a significant spread in the potential energies of the ions [38]. Similar to Maass' suggestions [10, 37], the external potential  in equation (9) can be adopted to consider the repulsive effects due to such a Coulomb blockage and a site mismatch effect, so the result being with a type of potential
  leads to the modified fractional Rayleigh equation

Consequently, in the case of percolation governed by the modified fractional Rayleigh equation, the evolution of the mean velocity of moving ions through the fractal-structured pathway obeys the equation

with a positive constant ηαb ≡ η bτ*/τα . The right-hand side of dynamic equation (14) is positive and therefore the acting force in the system is repulsive.
The conductivity of cations moving through the fractal structured pathway may be explicitly calculated by j(t) = σ (t)E , where the current density is j(t) = Nq〈v(t)〉 . Here N is the number of mobile ions, q is the charge of the ions and E is the electric field. Therefore, the solution to equation (14) can give us the dynamics of the conducting ions with a repulsive interaction in the fractal structured pathway medium of glasses.
Since  and
and  , we have

where ![$a = \tau _{\rm{c}}^{-\alpha } = [\rho _{\rm{m}} \sqrt M ]^{1/3}$](https://content.cld.iop.org/journals/1367-2630/15/2/023005/revision1/nj441160ieqn18.gif) .
.
From equations (14) and (15), we thus obtain the average velocity of the conducting ions undergoing anomalously slow transport in a fractal structured cluster with a repulsive interaction

If the density of particles is small and, correspondingly, parameter a in equation (15) is less than 1, then very few ions move through the successive fractal branches of the pathway in the cluster. This indicates that the number density of particles rapidly decreases if the mobile ions are proceeding into the deeper branches of the cluster. Consequently, the characteristic time will be longer at deeper branches in the percolation object. This implies that the mobile ions are trapped for a very long time in a deep branch of the pathway. The result is consistent with the fact that an MA slowdown is observed in the longer residence time [9]. The corresponding conductivity decreases rapidly. We will discuss it later.
We now consider that the mobile ions are propagating from the cluster at  to the adjacent cluster at
  in the absence of interactions [39] by the hopping process after transport through the fractal structured pathway in the percolation object. Fourier transform of the σ (t) at (t − t0 ) > 0 allows one to obtain the frequency-dependent conductivity in equation (16) via
where δ is the Dirac delta function,  is the external driving force due to applying an electric field and M is the mass of mobile ions. The time-dependent hopping conductivity σhops (t) is proportional to Nq〈v(t)〉 at the position
  and the average velocity is given by equation (16). Using this we obtain the real part of σhops (ω ) at t < τc , followed by integration by parts [40]:
Here,  is the undetermined diverging value but the time t has an upper limit of the characteristic time
 ![$\tau _{\rm{c}} = [\rho _{\rm{m}} \sqrt M ]^{-1/3\alpha }$](https://content.cld.iop.org/journals/1367-2630/15/2/023005/revision1/nj441160ieqn24.gif) , and the integration in equation (18) is valid for nα < 1 .
, and the integration in equation (18) is valid for nα < 1 .
Recently, the possibility of existence of fractional kinetic equations containing non-integer power-law exponents has followed from the general theory of dielectric relaxation that has been suggested by the work of Nigmatullin et al [41] on the polymerization reaction of polyvinylpyrrolidone and by the work of Coffey et al [42] on the non-inertial rotational diffusion. Equation (12) for the mean drift velocity is similar to the kinetic equation for the relaxation process based on the decoupling of a memory function on a self-similar structure [41]. In this paper, however, the physical situation is explicitly featured by the dynamic process, including the empirical contributions from all significant interactions, on the spatial picture of a self-similar structured pathway. The slow transport in an intra-cluster is basically due to the trapping ions in the fractal structure and the fractal time process.
Finally, we show that the modified fractional Rayleigh equation in the fractal structured pathway can be used to reproduce the expression of universal macroscopic conductivity in glass systems. That is,

where σdc = constant , ![$K\sim\frac{{Nq}}{{\sqrt {2\pi } }}\sum\nolimits_{n = 1}^\infty {\frac{{b\eta _\alpha a^{n-1} \Gamma [1+(n-1)\alpha ]}}{{\Gamma (n)}}} \sin \left( {\frac{{n\alpha }}{2}\pi } \right)$](https://content.cld.iop.org/journals/1367-2630/15/2/023005/revision1/nj441160ieqn25.gif) , and β = 1 − nα . The value of exponent
, and β = 1 − nα . The value of exponent  is 0.24 for a cluster model of DLCA with Df = 1.75 and thereby β = 1 − α = 0.76 for n = 1. The exponent 0.5 < β < 0.9 is observed for a wide variety of structurally different ion-conducting glasses. It confirms the demonstration of Sidebottom [11] that for ionic materials the power-law exponent decreases with decreasing dimensionality of the ion conduction pathway. It is worth noting that the transport phenomena in systems exhibiting sub-diffusive should have a condition with nα < 1 and the integer number n represents the pathway branch having fractal structure in the percolation cluster. For many SA glass materials, it turns out that the ions can move only in the first branch (n = 1) of the pathway. However, the ions may possibly move through the multiple branches of the trapping pathway if there is an additional repulsive interaction such as a Coulomb blockade in the case of MA glasses. We reasoned this since the Coulomb interactions cause a significant spread in the potential energies of the ions [38].
If we take a long time scale of t (t < τc ) with (2m − 1)π < ω t < 2mπ for integer m, then the Bω term in equation (18) may correspond to the nearly constant loss (NCL) [43, 44]. In other words, the mobile ions, which remain in their respective sites for a long time but less than τc , seem to be responsible for the NCL. The characteristic time will be very long if the density of mobile particles is very low in the percolation cluster since ![$\tau _{\rm c} = [\rho _{\rm m} \sqrt M ]^{-1/3\alpha}$](https://content.cld.iop.org/journals/1367-2630/15/2/023005/revision1/nj441160ieqn27.gif) .
.
Two different viewpoints for NCL behavior have been proposed in the literature. One is that NCL and Jonscher behaviors originate from clearly distinct dynamic processes as described by the local vibrational relaxation [44, 45]. The other is that all the conductivity spectra are caused by hopping motions of the mobile ions as described by the random barrier model or by the concept of mismatch and relaxation [46, 47]. There is another report on a new MAE that the non-hopping contributions to the ac conductivity involve both the mobile ions and the glassy network [48]. Our result for the NCL regime exhibits a viewpoint that the mobile ions remain in their respective sites for a long time in the multiple trapping systems. Therefore, the long time duration is basically due to the trapping ions in the fractal structure and the fractal time process. However, the trapping effects can take place in the presence of asymmetric potential wells in the percolation cluster.
4. Results and discussion
We shall apply the result of the modified fractional Rayleigh equation to provide a quantitative explanation for experimental findings on the observed variation of the power-law exponent β in the SA and the MA glasses.
The frequency spectra of the real conductivity Re σ (ω ) for the SA glasses of LBO, NBO and KBO at 453 K and MA glass systems (Li1−xAx)2B4O7 (A = Na, K, Rb, Cs; x = 0.5) at 593 K are shown in figures 3(a) and (b), respectively. At lower frequencies, the conductivity is almost independent of frequency, approaching the dc conductivity in the plateau region. At higher frequencies, the conductivity shows dispersion, which shifts to higher frequencies with increasing the temperature. However, the NCL behavior is not observed in our measurement.
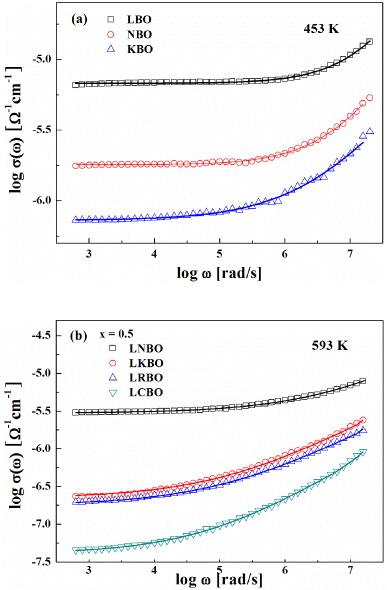
Figure 3. (a) Frequency spectra of the real conductivity Re σ (ω ) for LBO, NBO and KBO SA glasses at 453 K. (b) Frequency spectra of the real conductivity Re σ (ω ) for a typical composition of the MA glass systems (Li1−xAx)2B4O7 (A = Na, K, Rb, Cs; x = 0.5) at 595 K. Points are data and the solid lines are fits using Jonscher's power law in equation (19).
Download figure:
Standard imageA typical MAE can be seen with the manifestation of a negative deviation. The drop in dc conductivity for LABO with x = 0.5 is about 2–4 orders of magnitude at various temperatures, compared with the corresponding SA glass LBO, NBO and KBO (see figure 4). The drop in dc conductivity results from a drastic increase in activation energy Edc in the MA glasses compared to the SA glasses (x = 0 and 1). The temperature dependence of the MAE on dc conductivity shows that the MAE is slightly diminished as the temperature increases in figure 4. The degree of asymmetry in dc conductivity increases with increasing mismatch of the element size between the two types of alkali ions. The qualitative descriptions on the temperature dependence and the asymmetric characteristics of dc conductivity for LCBO were discussed in detail in the previous works [13, 14].
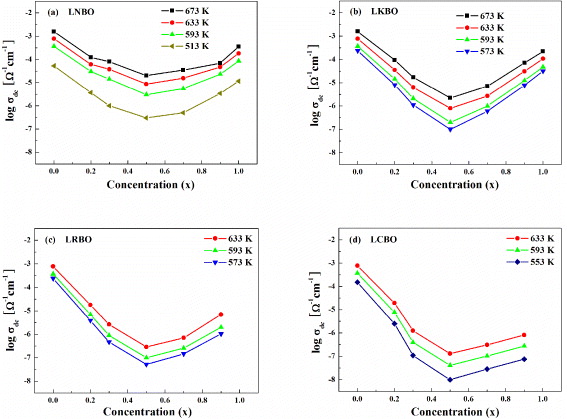
Figure 4. dc conductivity versus composition for (Li1−xAx)2B4O7 (A = Na, K, Rb, Cs; 0 ⩽ x ⩽ 1.0) at various temperatures: (a) LNBO, (b) LKBO, (c) LRBO and (d) LCBO, respectively. Points are obtained from the power law and the lines are a guide to the eyes.
Download figure:
Standard imageThe values of power-law exponent β fitted from equation (19) are shown in figures 5(a) and (b) for LNBO (x = 0, 0.2, 0.3, 0.5, 0.7, 0.9 and 1) and LABO (x = 0, 0.5 and 1) glasses, respectively. In figures 5(a) and (b), the filled indents represent the value of β in the SA (x = 0 and 1) glasses and the empty indents represent the value of β in LNBO (x = 0.2, 0.3, 0.5, 0.7 and 0.9) and LABO (x = 0.5) glasses, respectively. The average values of β are 0.57–0.83 in the SA glasses of LBO, NBO and KBO, and they are 0.45–0.58 in the MA glasses of LABO with x = 0.5 , respectively (see table 1). As shown in figures 5(a) and (b), the power-law exponent β increases with increasing temperature at relatively lower ranges of temperature in the SA glass but it shows a nearly independent trend with temperature in the MA with x = 0.5 glasses, even though the temperature range is much higher than the case of the SA glasses. Another important observation is that the exponent β of the MA glasses is smaller than that of the SA glasses. Moreover, the value of β in LNBO glasses with intermediate compositions (e.g. x = 0.2, 0.3, 0.7 and 0.9) can be expressed as the average one of the sum of the SA glass and the LNBO with x = 0.5 glass. It is a surprising result that the power-law exponent shows such a dependent composition for all LABO systems. It has been shown from the literature data [11] that the power-law exponents of the MA oxide glasses in many other systems are lower than those of the SA glasses. Also, a decrease in power-law exponent has been observed with decreasing dimensionality of the conduction pathways in the MA glasses [11]. Using the new microscopic model proposed above we are able to utilize the dynamical characteristics of ac conductivity to address the observed variation of the power-law exponent β in the SA and the MA glasses. The quantification of the β value raises interesting questions as to its physical origin of the ionic conductors.
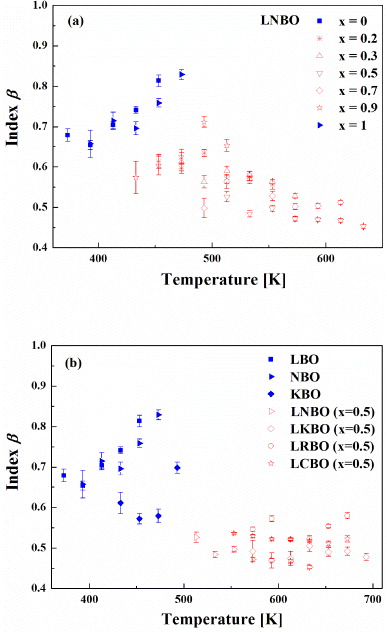
Figure 5. (a) Temperature dependence of a frequency exponent parameter β for different compositions of LNBO glasses (shown) obtained from a fit to equation (19). The points marked with filled/empty symbols represent the value of β in the SA LBO and KBO glasses, the MA LNBO (x = 0.2, 0.3, 0.7 and 0.9) glasses and the MA LNBO (x = 0.5) glasses, respectively. (b) The values of the power-law exponent β measured at various temperatures for LABO (x = 0, 0.5 and 1) glasses. The points marked with filled symbols represent the value of β in the SA LBO, NBO and KBO glasses, and empty symbols correspond to the MA LNBO (x = 0.5), LKBO (x = 0.5), LRBO (x = 0.5) and LCBO (x = 0.5) glasses, respectively.
Download figure:
Standard imageTable 1. Typical values of the dc conductivity σdc , the hopping frequency of the charge carriers ωh , the power-law exponent β , dc activation energy Edc and ac activation energy Eac , for LABO glasses, where 7.7 × 10⁻⁹ < σdc <1.6 × 10⁻³ (cm−1 Ω −1 ) , 1.3 × 10⁴ < ωh < 2.0 × 10⁷ (Hz) and 0.45 < β < 0.83. The last column indicates the temperature range examined for Edc and Eac . The means ± SEM are shown in the fifth column. The experimental conductivity data for the SA glasses and the MA glasses have been fitted to equation (18), which is a Jonscher fit of ac conductivities. The hopping rates are obtained from the conductivity spectrum in equation (19) by the substitution (σ (ωh ) = 2σdc ), and the other parameters, σdc , K and β, are determined by linear least-squares fitting procedures. Eac(1) is equal to Eac (x = 0) or Eac (x = 1), and Eac(2) is the same as Eac (x = 0.5).
| Sample | σdc (cm−1 Ω−1) | ωh (Hz) | β (average) |  |
T (K) |
|---|---|---|---|---|---|
| (Li1−xNax)2B4O7 | |||||
| x=0 | 2.0×10⁻⁷–1.6×10⁻³ | 7.1×10⁵–2.0×10⁷ | 0.65–0.81 | 0.67±0.01 | 373–673 |
| 0.62±0.02 | 373–453 | ||||
| x=0.2 | 5.0×10⁻⁷–1.2×10⁻⁴ | 1.6×10⁶–1.4×10⁷ | 0.57–0.63 | 0.72±0.02 | 453–673 |
| 0.59±0.04 | 453–533 | ||||
| x=0.3 | 4.0×10⁻⁷–8.1×10⁻⁵ | 1.1×10⁶–1.3×10⁷ | 0.53–0.61 | 0.79±0.04 | 473–673 |
| 0.67±0.07 | 473–573 | ||||
| x=0.5 | 3.0×10⁻⁷–2.0×10⁻⁵ | 8.7×10⁵–1.6×10⁷ | 0.45–0.53 | 0.85±0.02 | 513–673 |
| 0.68±0.04 | 513–633 | ||||
| x=0.7 | 1.0×10⁻⁷–3.5×10⁻⁵ | 4.0×10⁵–1.5×10⁷ | 0.50–0.57 | 0.86±0.01 | 493–673 |
| 0.88±0.07 | 493–593 | ||||
| x=0.9 | 2.0×10⁻⁷–7.0×10⁻⁵ | 6.4×10⁵–1.4×10⁷ | 0.57–0.71 | 0.69±0.03 | 433–673 |
| 0.75±0.03 | 433–513 | ||||
| x=1 | 1.0×10⁻⁷–3.5×10⁻⁴ | 6.9×10⁵–1.5×10⁷ | 0.66–0.83 | 0.66±0.01 | 393–673 |
| 0.61±0.01 | 393–473 | ||||
| (Li1−xKx)2B4O7 | |||||
| x=0.2 | 6.0×10⁻⁷–9.4×10⁻⁵ | 1.6×10⁶–1.8×10⁷ | 0.63–0.75 | 0.86±0.02 | 493–673 |
| 0.71±0.04 | 493–573 | ||||
| x=0.3 | 3.0×10⁻⁷–1.7×10⁻⁵ | 1.1×10⁶–1.2×10⁷ | 0.61–0.69 | 0.97±0.02 | 533–673 |
| 0.85±0.05 | 533–613 | ||||
| x=0.5 | 1.0×10⁻⁷–3.3×10⁻⁶ | 9.8×10⁴–3.0×10⁶ | 0.46–0.51 | 1.01±0.03 | 573–693 |
| 1.03±0.05 | 573–693 | ||||
| x=0.7 | 2.0×10⁻⁷–7.2×10⁻⁶ | 8.2×10⁵–1.5×10⁷ | 0.57–0.62 | 0.88±0.01 | 533–673 |
| 0.76±0.04 | 533–653 | ||||
| x=0.9 | 1.0×10⁻⁷–7.1×10⁻⁵ | 9.3×10⁵–1.8×10⁷ | 0.64–0.81 | 0.81±0.01 | 453–673 |
| 0.64±0.03 | 453–553 | ||||
| x=1 | 4.0×10⁻⁷–2.2×10⁻⁴ | 1.7×10⁶–1.8×10⁷ | 0.57–0.70 | 0.68±0.03 | 433–673 |
| 0.72±0.06 | 433–493 | ||||
| (Li1−xRbx)2B4O7 | |||||
| x=0.2 | 1.3×10⁻⁸–4.2×10⁻⁵ | 6.2×10⁴–2.2×10⁷ | 0.59–0.66 | 0.90±0.01 | 433–673 |
| 0.90±0.15 | 433–573 | ||||
| x=0.3 | 8.7×10⁻⁹–7.0×10⁻⁶ | 7.1×10⁴–2.7×10⁷ | 0.58–0.68 | 0.98±0.01 | 473–673 |
| 0.91±0.02 | 473–653 | ||||
| x=0.5 | 5.2×10⁻⁸–9.8×10⁻⁷ | 8.4×10⁴–2.8×10⁶ | 0.52–0.58 | 1.01±0.03 | 573–673 |
| 1.13±0.05 | 573–673 | ||||
| x=0.7 | 7.7×10⁻⁹–1.2×10⁻⁶ | 6.5×10⁴–1.3×10⁷ | 0.55–0.72 | 0.91±0.01 | 493–653 |
| 0.94±0.01 | 493–653 | ||||
| x=0.9 | 5.3×10⁻⁷–6.9×10⁻⁶ | 1.4×10⁶–4.1×10⁷ | 0.45–0.67 | 0.88±0.02 | 473–653 |
| 1.60±0.07 | 553–613 | ||||
| (Li1−xCsx)2B4O7 | |||||
| x=0.2 | 2.2×10⁻⁸–4.6×10⁻⁵ | 1.0×10⁵–1.8×10⁷ | 0.57–0.74 | 0.86±0.01 | 433–673 |
| 0.81±0.03 | 433–573 | ||||
| x=0.3 | 1.0×10⁻⁸–3.1×10⁻⁶ | 7.9×10⁴–1.6×10⁷ | 0.60–0.72 | 0.96±0.01 | 493–673 |
| 0.94±0.01 | 493–653 | ||||
| x=0.5 | 1.0×10⁻⁸–4.1×10⁻⁷ | 1.3×10⁴–7.9×10⁵ | 0.51–0.54 | 1.03±0.01 | 553–673 |
| 1.06±0.03 | 553–673 | ||||
| x=0.7 | 1.2×10⁻⁸–5.4×10⁻⁷ | 1.1×10⁵–6.4×10⁶ | 0.53–0.64 | 0.98±0.02 | 533–653 |
| 0.98±0.03 | 533–653 | ||||
| x=0.9 | 1.6×10⁻⁸–8.1×10⁻⁷ | 1.1×10⁵–1.3×10⁷ | 0.46–0.65 | 0.96±0.01 | 513–633 |
| 1.33±0.04 | 513–613 |
If the mobile ions in the DLCA percolation cluster hop to an adjacent cluster after moving through the first branch of the fractal structured pathway, then we may obtain the power-law exponent β = 0.76 in equation (19). This is because the fractal dimension of DLCA is Df = 1.75 and  for the ions in the first branch in the pathway. If the mobile ions hop after moving through the second branch of the pathway, we then have β = 1 − 2α = 0.52 in equation (19). The calculated values of β are in good agreement with the experimental results, as shown in table 1. We thus confirmed the facts that (i) the power-law exponent of the MA oxide glasses is lower than that of the SA glasses and (ii) the power-law exponent decreases with decreasing dimensionality of the conduction pathways in the MA glasses. Moreover, for the intermediate compositions of the MA glass, the values of the exponent are found to have the mean value of the SA glass and the MA glass with x = 0.5. That is, the calculated values for the first and second branches of the pathway having DLCA fractal structure are in good agreement with the measured values of the SA glass and the MA glass in LABO systems, again. Therefore, this piece of evidence does indicate that the ions of the SA glass are moving through the first branch of the pathway and the ions of the MA glass with x = 0.5 are moving through the second branch of the pathway in the DLCA object. We reasoned this since two kinds of alkali ions are moving in distinctly different conduction pathways due to a site mismatch effect [37, 38] and Coulomb blockade by the randomly distributed ions [8, 49].
In order to enhance ionic conductivity, previous studies have examined the structural change of lithium–alkali borate glasses with respect to the existence of phase separation [50], the dependence of glass transition temperature [51, 52] and the density related to atomic arrangements [53]. Accordingly, more extended studies are required to establish links between the exponent β of the SA and MA borate glasses and the structural analyses above in [50–53].
In figure 6(a), we present the dc conductivity obtained from an analysis of Jonscher's power law as a function of 1000 T−1. The dc conductivity, or rather the product of the dc conductivity and temperature, often follows an Arrhenius relation σdc = C exp (−Edc /kB T) , where Edc is the activation energy from the Jonscher's power-law fits and kB is the Boltzmann constant. The slopes of least-squares straight-line fits represent the values of the activation energy for different compositions of LABO glasses. The upper three lines are for the group of SA glasses and the lower four lines are for the group of MA with x = 0.5 glasses. In figure 6(b), the dc activation energies are shown as a function of the Li–Na, Li–K, Li–Rb and Li–Cs concentrations, respectively. The activation energy has its maximum near x = 0.5 and the concentration-dependent energy clearly represents the MAE. We also present some typical values of Edc obtained from LABO samples in table 1.
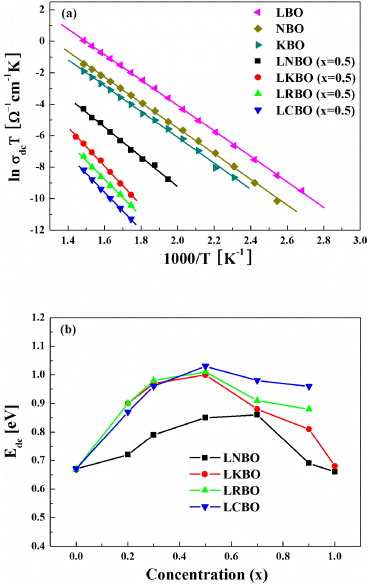
Figure 6. (a) Arrhenius plot of the dc conductivity for (Li1−xAx)2B4O7 with x = 0 and 0.5 glass systems as a function of 1000 T−1. The straight lines are fits to the data. (b) dc activation energies for different compositions of LNBO, LKBO, LRBO and LCBO glasses. The lines are a guide to the eyes.
Download figure:
Standard imageThe reciprocal temperature dependence of hopping frequency, ωh , is shown in figure 7(a), which indicates that ωh obeys the Arrhenius relation, ωh = ω0 exp (−Eac /kB
T) . We note that the hopping rates are obtained from the conductivity spectrum in equation (19) by substitution (σ (ωh ) = 2σdc ), and the other parameters, K and β , are determined by a linear least-squares fitting procedure. With the Arrhenius relation of ωh and a characteristic time ![$\tau _{\rm{c}} = [\rho _{\rm{m}} \sqrt M ]^{-1/3\alpha }$](https://content.cld.iop.org/journals/1367-2630/15/2/023005/revision1/nj441160ieqn30.gif) , we may calculate the density of particles in the SA and MA glasses from the relation that satisfies ωh
τc = 1 with ω0
τ0 = 1 as follows:
, we may calculate the density of particles in the SA and MA glasses from the relation that satisfies ωh
τc = 1 with ω0
τ0 = 1 as follows:


Figure 7. (a) Reciprocal temperature dependence of hopping frequency for different compositions of LABO with x = 0 and 0.5 glasses (shown) obtained from a fit to σ (ωh ) = 2σdc . The solid lines indicate that ωh obeys the Arrhenius relation. With the dot line data and the values of ac activation energy in table 1, we may estimate the densities of particles in the first branch of the pathways, which are ρm (LBO) ≅ 11 000 per mole , ρm (NBO) ≅ 5155 per mole and ρm (KBO) ≅ 2524 per mole at T = 445 K using the atomic mass of LBO, NBO and KBO glasses per mole, where 169.12, 201.22 and 233.44 g, respectively, and the exponent α = 0.24 in the DLCA model. Similarly, the estimated values of the density of particles in the second branch of the pathways are ρm (LNBO) ≅ 8861 per mole , ρm (LKBO) ≅ 819 per mole , ρm (LRBO) ≅ 884 per mole and ρm (LCBO) ≅ 353 per mole at T = 625 K , respectively. The atomic masses of LNBO, LKBO, LRBO and LCBO glasses per mole are 185.17, 201.28 and 247.65 g, respectively. (b) ac activation energies for different compositions of LNBO, LKBO, LRBO and LCBO glasses. The lines are a guide to the eyes.
Download figure:
Standard imageThe hopping frequency ωh can be determined experimentally at a given temperature, as shown in figure 7(a). Therefore the hopping frequency should provide a measure of density of cations in the conducting system. The estimation of the density of particles in the second branch of the pathway indicates that the LNBO system has a much higher concentration of conducting cations moving through the second branch of the conduction pathway compared to the LKBO, LRBO and LCBO systems (see the caption in figure 7). Thus, the MAE in the LNBO system is relatively small compared to the LKBO, LRBO and LCBO systems.
The slopes of least-squares straight-line fits in figure 7(a) represent the values of the ac activation energy for different compositions of LABO glasses. We present some typical values of Eac obtained from LABO samples in figure 7(b) and table 1. For the LKBO, LRBO and LCBO systems, the ion hopping rates would be expected to increase with increasing temperature since the dc- and ac-activation energies are almost the same in these ionic conductors. In figure 7(b), the ac activation energy in LRBO and LCBO glasses with x = 0.9 increases anomalously. The reason for this may be the large size difference between Li and Rb or Cs ions. The large size difference between Li and Rb or Cs implies a large energy mismatch between different sites. The ac activation energies of LKBO, LRBO and LCBO glasses indicate that the asymmetric potential wells of these glasses are much deeper than those of LNBO glasses. In terms of the energy landscape, the random but asymmetric potential wells may be due to the size difference of cations and inhomogeneous surrounding matrix.
The activation energies of LBO and NBO systems are almost the same, but dc conductivity of LBO is higher than that of NBO, as shown in figure 6(b). This result suggests that there are more mobile ions or more sites to which an Li ion can jump in LBO glass compared with NBO glass [49]. Almond et al [54] argued that the carrier concentration increases in the system if the dc activation energy of the system is higher than the ac activation energy over a range of temperatures, and the ion hopping rates increase for increasing conductivity if the dc- and ac-activation energies are the same in an ionic conductor. This implies that there are more mobile ions rather than more sites to which an Li ion can jump in the SA glasses. Therefore our estimation of the cation density based on the ac conductivity strongly supports the dc conductivity results.
In addition to this, Nascimento [19] has recently described that tens of binary silicate, borate and germinate glasses follow a 'universal' conductivity expression, as described in equation (1). With respect to the Anderson–Stuart (A–S) model [55] applied to alkali silicate glasses, the parameters of the elastic modulus, G, and the 'Madelung' constant, β, of A–S theory could be modified to predict the effects of glass composition on activation energy EA in equation (1) [19]. However, a careful investigation is required for applying the A–S model to explain the conductivity of LABO glasses in detail.
We are also able to predict the value of the energy barrier for each branch of the pathway directly from our theoretical model and the experimental results. From our theory, we show that the ions of the SA glass and the MA glass with x = 0.5 are moving through the first and second branches of the pathway in the DLCA object, respectively. It is also shown in figures 6(a) and 7(a) that dc and ac conductivity obeys the Arrehrnius relation σdc = C exp (−Edc /kB T) and ωh = ω0 exp (−Eac /kB T) , respectively. The dc conduction arises from ions moving through the transport of the long chain of inter-cluster pathways. Consequently, the dc activation energy difference between the SA glass and the MA glass with x = 0.5 would be taken into account for the energy gap between the first and second branches. Denoting the energy gap ΔU in figure 8, we have ΔU = Edc (1) − Edc (2) ≅ 0.2-0.3 eV , where Edc(1) and Edc(2) are the dc activation energies in the first and second branches, respectively. Therefore, we may conclude that the drop in conductivity results from the energy gap between the first and second branches.

Figure 8. Schematic illustration of the double random landscape of energy barriers in the SA and MA glasses. The potential energy difference between the first and second branches of the pathway is denoted by ΔU = Edc (1) − Edc (2) . The ac activation energies of the SA and MA with x = 0.5 glasses correspond to the local energy barrier of the first and second branches of the pathway, respectively.
Download figure:
Standard imageMeanwhile, the ac activation energies of the SA and the MA (x = 0.5 ) glass correspond to the local energy barrier of the first and second branches of the pathway, respectively. Eac(1) represents the local energy barrier of the SA glass, which is the local energy of the first branch of the pathway, and Eac(2) represents the local energy barrier of the MA glass, which is the local energy of the second branch of the pathway. The activation energy Eac(2) in the MA glass is higher than that of Eac(1) in the SA glass, as shown in table 1. This indicates that the potential energy of the MA glasses is fairly deeper than that of the SA glasses. This is also the reason why the power-law exponent in the MA oxide glasses with x = 0.5 is nearly independent of the temperature and a slowdown of ions in the MA system is observed in the longer residence time. The characteristic time, ![$\tau _{\rm{c}} = [\rho _{\rm{m}} \sqrt M ]^{-1/3\alpha }$](https://content.cld.iop.org/journals/1367-2630/15/2/023005/revision1/nj441160ieqn31.gif) , is long in the MA glasses compared to that in the SA glasses, because the density of mobile particles is relatively low in the percolation cluster.
, is long in the MA glasses compared to that in the SA glasses, because the density of mobile particles is relatively low in the percolation cluster.
5. Conclusions
Based on the measurements of a whole series of MA borate glass systems (Li1−xAx)2B4O7 (A = Na, K, Rb, Cs; 0 ⩽ x ⩽ 1.0) at various temperatures, we developed a new theory to understand the origin of the MAE and reproduced the expression of universal macroscopic conductivity.
Approaching with a DLCA spatial structure model, for the first time, we obtained evidence that the real process of ionic transport in both the SA glass and the MA glass systems can be described explicitly by the modified fractional Rayleigh equation with a repulsive interaction due to a site mismatch effect and Coulomb blockade by the randomly distributed ions. We show that the empirical expression of mean square displacement of the mobile ions 〈r2 (t)〉 ∼tα can be obtained as a first approximation of ions moving through the first branch of the fractal pathways. From the quantification of the power-law exponent β , we found the physical origin in ionic conductors such that the ions of the SA and MA glasses are moving through the first and second branches of the fractal structured pathways, respectively.
This research thus establishes an explanation that the ac universality or Jonscher's behavior of power law in many ionic glass systems is the consequence of the sub-transport and hopping processes of ions moving through the multiple trapping percolation objects with the low-dimensional conduction pathways.
Acknowledgments
This work was supported by the Basic Science Research Program through the National Research Foundation of Korea (NRF) funded by the Ministry of Education, Science and Technology (20120007732 and 20120007937), and the Energy Resource R&D program (20104010100020) under the Ministry of Knowledge Economy, Republic of Korea.