


Abstract
We developed a classical potential to model phase-change materials based on the binary chalcogenide alloy of GeTe that are currently exploited for memory applications. Our potential is based on the recently proposed extension of the Tersoff potential plus additional terms to better reproduce the structure of the amorphous and the crystalline phases of GeTe. The parameters defining the potential reported in this work were fitted to reproduce the energies and forces of a database of reference structures obtained via density-functional theory molecular-dynamics simulations. This paper reports on the method used to construct the potential and on its validation against first-principles calculations either available in literature or part of this work. We found that the structural properties of amorphous GeTe were well reproduced. The advantage of the current implementation toward more flexible neural network-based methods is that most of the parameters can be reconnected to physical properties. Moreover, the relatively small number of parameters results in a simple implementation and facilitates the introductions of further interactions among additional species.
Export citation and abstract BibTeX RIS

Content from this work may be used under the terms of the Creative Commons Attribution 3.0 licence. Any further distribution of this work must maintain attribution to the author(s) and the title of the work, journal citation and DOI.
1. Introduction
Phase-change materials (PCM) based on chalcogenide alloys are considered very promising candidates for memory storage applications as an alternative to flash. The main characteristic of these materials is their capability to undergo fast and reversible interconversion between the crystalline and the amorphous phase upon heating and cooling. These materials are typically alloys of Ge, Sb and Te atoms. The different electric and optical properties of the crystalline and the amorphous phase can be used to store data. Several optical devices, such as CDs, DVDs just to name two, use the difference in optical contrast of these two phases to store information [1]. In PCM memories, the bit is stored using the difference in electric resistance between the crystalline and the amorphous state. At standard conditions, the crystalline phase is thermodynamically stable and has an about three–four orders of magnitude higher conductivity than the amorphous one, which is metastable [2]. Among the broad range of compositions explored so far, the ternary alloy Ge2Sb2Te5 (GST) and the binary GeTe have attracted the largest interest of the scientific community. The former is the most used alloy in non-volatile memories and the latter has one of the highest crystallization temperature, which results in a kinetically more stable amorphous phase.
To make PCM-based devices competitive against flash memories the amount of data that can be stored per unit of volume must be increased. Currently, the possibility to store more than one bit in the same cell is exploited by setting more than two values of resistance. To create such a multi-bit cell, precise control of the conductance over time is essential. Currently, the main limitation is data corruption due to a change in electrical resistance over time of the amorphous phase, also known as resistivity drift, which is described by the following empirical power-law equation:

where R(t) and R0 are the electric resistivity at times t and t0, respectively, with t > t0 and ν is a number.
Understanding the cause of the resistivity drift is a key step forward in planning solutions to increase the storage density; in particular, we would like to investigate whether changes in resistivity are associated to a reorganization of the bond network in the amorphous phase or to the evolutions of specific defects formed during the relatively fast quenching from the melt in the writing cycle.
In this work, we are interested in PCM made of GeTe. The main problem we face in modeling systems via first-principles (FP) methods is that we can simulate only relatively short time scales, limited at most to a few hundred picoseconds, and small systems, usually consisting of a few hundred atoms. We also know that the creation of a proper model of an amorphous system, in this case of a-GeTe, requires long molecular-dynamics (MD) simulations running over tens nanoseconds to quench liquid GeTe from 1000 K to room temperature. Moreover, large systems, typically consisting of ∼1000 atoms depending on the case, may be needed to reduce size effects produced by the periodic boundary conditions. For this reason we think that deeper understanding of mechanism responsible of the drift in PCM requires the use of classical MD simulations that can model the system sizes and time scales mentioned above, provided that the empirical potential can properly describe the system. A neural network potential for GeTe has been recently developed and successfully validated against FP calculations [3].
Driven by the motivation that we believe it important to model a-GeTe via a classical potential, we explore that possibility to use a relatively simple bond–bond order potential to model amorphous GeTe. We show that such a potential, defined by a few tens of parameters, exists and can reproduce some of the structural properties obtained via FP calculations. The main advantage of our approach is that a few tens of parameters define the functional form and can be easily implemented in every MD code, therefore, it can be readily used by a large number of people.
This work focuses solely on the methodology used to develop the classical potential for a-GeTe and its validation. The paper is organized as follows: the functional form of the Tersoff-based potential and the method used for its construction are described in section 2. The validation of the potential toward density-functional theory (DFT) results computed in this work and pre-existing data is described in section 3. We compare our results with the classical results of the neural network potential of [3]. Conclusions are given in section 4.
2. Methods
In this section we describe the methodology used to build the potential for GeTe. We exploited the possibility to use a potential defined by a relatively small (a few tens) number of parameters to capture most of the physics responsible for structural changes in GeTe. Tersoff proposed a three-body potential for covalent systems made of C, Si and Ge atoms [4, 5]. As the bonds in the a-GeTe network are of significantly covalent character, we decided to explore the possibility to model this material via a Tersoff-based potential. We used the augmented formulation proposed by Billeter et al [6], which was successfully used to model systems of Si, N, O and H atoms. Here we propose a modification of the three-body term, described in the first part of this section, which proved effective in improving the angle distribution of a-GeTe. In the second part of this section, we describe the fitting procedure, which involved an optimization of the parameters defining the potential, which were modified to reproduce the forces and energies of reference structures. Most of the reference structures were generated via FP MD simulations; the remaining configurations were artificially created by the introduction of defects in the crystalline phase. During the construction of the potential, the FP energies and forces of structures obtained with the classical potential were computed and added to the database. Computational details of the FP calculations are described in the last part of this section.
2.1. Functional form of Tersoff-based potential
Tersoff [4, 5] proposed a three-body short-range potential in which the total energy E is computed as the sum of terms Vij, whose strength is controlled by the local coordination

in which Vij is defined as follows:


The indices i and j define the pair of atoms, I and J the atomic species, rij is the distance between the atoms i and j, fc(rij) is a continuous function of rij, such that fc(rij) = 1 for rij ⩽ RIJ, fc(rij) = 0 for rij ⩾ SIJ and ![$f_{\mathrm { c}}(r_{ij})=\frac {1}{2} [1+\cos (\pi \frac {r_{ij}-R_{IJ}}{S_{IJ}-R_{IJ}})]$](https://content.cld.iop.org/journals/1367-2630/15/12/123006/revision1/nj483917ieqn1.gif) for values of rij between RIJ and SIJ, with RIJ < SIJ. The parameters AIJ, BIJ, λIJ and μIJ determine the shape of the Morse potential Vij and depend on both species types. The function bIJij controls the attractive term, which is reduced as the atomic coordination increases. Different variants of the Tersoff potential have been proposed; here for the term eIJKijk we used the following definition, in which
for values of rij between RIJ and SIJ, with RIJ < SIJ. The parameters AIJ, BIJ, λIJ and μIJ determine the shape of the Morse potential Vij and depend on both species types. The function bIJij controls the attractive term, which is reduced as the atomic coordination increases. Different variants of the Tersoff potential have been proposed; here for the term eIJKijk we used the following definition, in which

The term tIijk describe the bending energy, which is minimized when the cosine of the angle θijk, with i being the vertex, approaches the value hI. The two parameters cI and dI control the strength of the penalty angular term.
Billeter et al [6] introduced two additional terms in the formulation of the total energy

where the first term is that of equation (2). The second term in equation (8) is the sum of the core energies E0I of each species. This term was introduced to reproduce the energy of configurations containing different numbers of atoms. The last term introduces an additional penalty energy Eci to improve the description when there are changes in coordination, such as formation of defects, interfaces and surfaces. Eci is defined as

where Δz2i is the difference between the current coordination of atom i of type I, zi and its typical coordination z0I. The coordination zi is defined using the functions fIJs,ij and bIJij defined before via  . The deviation Δzi from the typical coordination is defined via

where z = |zi − zI0| − int(|zi − zI0|); Δz2i is set constant for values of z larger than zcut, see figure 1; zT, zB and zcut are three adimensional, species-independent parameters.

Figure 1. Graphic plot of the penalty energy Ec defined by equations (9)–(11) for germanium (solid line) and tellurium (dashed line). The parameters are those of table 1.
Download figure:
Standard image High-resolution imageIn the present work we used the augmented potential of [6] but modified the definition of the angular term tIijk by choosing different values of the parameters dI,J,K and hI,J,K, which now depend on the three species I, J and K forming the angle. Moreover, we added an additional parameter θ0,I for each species I. The term in tIijk is now defined as

The modification in equation (11) allowed a better description of the angle distribution in the amorphous phase, see section 3.
2.2. Construction of the Tersoff-based potential
The potentials were constructed following the recipe of [6]. To find the optimal set of parameters AIJ, BIJ, λIJ, μIJ, βI, nI, cI, dI,J,K, hI,J,K, RIJ, SIJ, E0, Z0, zB, zT, cI,1, cI,2 and θ0,I that minimize the energy and the force mismatch computed via FP and classical potential. The energy mismatch Δ2E was defined as

where the summation is carried out over the total number of configurations, Nf. Ecla,n and EDFT,n are the energies of the n-configuration computed with the classic potential and DFT, respectively. Δ2E is the mean square deviation of the errors of all frames. Similarly, it is possible to define the force mismatch Δ2F as

where Fcla(DFT),n,i,α represents the classical (DFT) force of atom i along the Cartesian direction α of the n-configuration and Nat,n is the total number of atoms of the n-system.
In [6] the energy mismatch and the force error were optimized simultaneously by minimizing Δ2W defined as

where rB is the Bohr radius and wE is a weight parameter varying between 0 and 1. By setting wE = 1, Δ2W is equal to Δ2E, which means that only the energy mismatch is minimized; in contrast, wE = 0 correspond to minimizing the force error. Another way to measure the goodness of the potential is to compare the directions of the classical and DFT forces to measure their alignment. This is done computing the correlation coefficient CF which defined as follows. The best alignment correspond to CF = 1.

We started by fitting the forces of isolated Ge–Ge, Ge–Te and Te–Te dimers to obtain the starting coefficients A, B, λ, μ and an initial estimate of the cutoff distances R and S. Subsequently, groups of parameters were fitted simultaneously. We cycled hundreds of times over all groups to maximize the correlation coefficient CF ; the coefficients cI,1 and cI,2 of the additional term of equation (9) were fixed to zero. Finally, during the refinement, we kept fixed R and S. We would like to point out that a larger values of S results in a higher correlation coefficient, but the drawback is that the potential becomes less transferable over a wide range of volumes, because at different densities different numbers of atoms can be included in the cutoff range. The parameters defining the term of equation (9) were optimized using a weight wE between 0.01 and 0.02 using a subset of crystalline structures at different volumes. The optimal parameters are reported in table 1.
Table 1. Optimized parameters of the classical potential defined via equations (2)–(11). The parameters zT and zB of equation (11) are equal to 0.50 and 0.50, respectively, and zcut = 3.0 (adim.).
| Ge | Ge–Te | Te | |
|---|---|---|---|
| A (eV) | 6216.387 | 5368.015 | 4237.566 |
| B (eV) | 417.086 | 900.597 | 1001.053 |
| λ (Å−1) | 3.376 34 | 2.847 63 | 2.580 06 |
| μ (Å−1) | 2.118 59 | 2.030 09 | 1.917 81 |
| β (adim.) | 6.4361 × 10⁻⁷ | – | 0.342 02 |
| χ (adim.) | 1 | 1 | 1 |
| R (Å) | 2.836 33 | 2.749 30 | 2.664 94 |
| S (Å) | 3.783 06 | 4.444 33 | 4.083 55 |
| n (adim.) | 1.206 57 | – | 0.911 54 |
| c (adim.) | 1.0832 × 10⁶ | – | 1.2028 × 10³ |
| θ0 (rad) | −0.9 | – | −0.9 |
| E0 (eV) | −105.562 37 | – | −221.629 27 |
| Z0 (adim.) | 4.415 69 | – | 3.450 86 |
| c1 (eV) | 0.018 77 | – | 0.104 49 |
| c2 (eV) | 0.099 32 | – | 0.227 49 |
| d, h (adim) | X=Ge | X=Ge | X=Te |
| Y =Ge | Y=Te | Y=Te | |
| dX−Ge−Y | 25.619 10 | 28.181 70 | 28.070 53 |
| dX−Te−Y | 27.861 51 | 27.886 12 | 35.753 17 |
| hX−Ge−Y | −0.449 82 | −0.351 75 | −0.344 48 |
| hX−Te−Y | −0.331 05 | −0.371 31 | −0.463 33 |
2.3. Computational details of first-principles calculations
We produced 1000 configurations to build up the database with the reference structures using different approaches: (i) most of the structures were obtained via FP MD simulations at different temperatures; (ii) other structures were produced artificially from c-GeTe either by displacing selected groups of atoms along high-symmetry directions, by removing selected atoms to produce local defects or by randomly displacing the atomic positions; and (iii) in the final steps of the construction of the potential, additional FP calculations of energies and forces were carried out on structures produced with our potential via standard MD and replica-exchange (RE) [7, 8] MD simulations.
Our study employs both the Car–Parrinello scheme (CP) [9] and Born–Oppenheimer (BO) FP MD to simulate liquid, amorphous and crystalline GeTe. The FP simulations were performed within the framework of DFT in the local density approximation supplemented by generalized-gradient corrections [10], as implemented in the CPMD code2. Local spin-density calculations were carried out to test the presence of spin polarization on selected snapshots. We never found unpaired electrons in these tests. We employed Goedecker–Teter–Hutter pseudopotentials [11] with a plane-wave expansion of the Kohn–Sham orbitals up to a kinetic energy cutoff of 80 Ry. We used only the γ point to sample the Brillouin zone (BZ). GeTe structures were modeled using three-dimensional periodic boundary conditions at different densities; the box size and the number of atoms for each system are reported in table 2.
Table 2. Twenty-three groups of GeTe structures used for fitting and testing the classical potential: given in the columns are the label of the group (see text), the number of atoms Na, the box size, the sampling time τ (ps) (if from FP MD), the number of configurations for training Ntr and testing Nte, the correlation coefficient CF (see equation (16)), the energy mismatch ΔE (see equation (12)) and the force error ΔF (see equation (13)). ⋆Randomized positions with maximum displacement equal to 0.5 Å from optimized c-GeTe at different lattice parameters.
| Label | Na | Box (Å) | τ (ps) | Ntr/Nte | CF (adim.) | ΔE (meV atom−1) | ΔF (eV Å−1) |
|---|---|---|---|---|---|---|---|
| (a) | 128 | 17.124 (α=58.3°) | – | 2/2 | 0.826 | 1.747 | 0.115 |
| (b) | 127 | 17.124 (α=58.3°) | – | 13/13 | 0.835 | 20.137 | 0.175 |
| (c) | 64 | 12.400 | 45.3 | 0 / 2130 | 0.857 | 66.205 | 0.368 |
| (d) | 64 | 12.137 | 6.1 | 0 / 1263 | 0.884 | 68.714 | 0.368 |
| (e) | 64 | 12.137 | 4.4 | 21 / 186 | 0.715 | 10.115 | 0.349 |
| (f) | 64 | 12.137 | 14.2 | 209 / 2085 | 0.677 | 29.631 | 0.405 |
| (g) | 64 | 12.137 | 17.7 | 269 / 2682 | 0.705 | 16.506 | 0.392 |
| (h) | 64 | 12.137 | 21.3 | 0 / 1149 | 0.741 | 40.231 | 0.334 |
| (i) | 215 | 17.997 | – | 1 / 1 | 0.892 | 1.658 | 0.097 |
| (j) | 214 | 17.997 | – | 4 / 4 | 0.885 | 5.067 | 0.104 |
| (k) | 213 | 17.997 | – | 2 / 2 | 0.871 | 7.833 | 0.110 |
| (l) | 212 | 17.997 | – | 3 / 3 | 0.857 | 10.265 | 0.115 |
| (m) | 216 | 17.997 | – | 1 / 1 | 0.929 | 0.656 | 0.097 |
| (n) | 216 | 17.997 | – | 1 / 1 | 0.937 | 15.792 | 0.160 |
| (o) | 216 | 17.997–19.579⋆ | – | 0 / 63 | 0.975 | 60.212 | 0.571 |
| (p) | 216 | 17.997 | 5.5 | 16 / 75 | 0.928 | 56.630 | 0.217 |
| (q) | 216 | 18.600 | 9.2 | 63 / 125 | 0.917 | 96.282 | 0.316 |
| (r) | 216 | 18.206 | 11.9 | 30 / 433 | 0.859 | 92.382 | 0.273 |
| (s) | 216 | 18.206 | – | 28 / 465 | 0.879 | 168.421 | 0.300 |
| (t) | 216 | 18.521 | 18.0 | 130 / 1140 | 0.877 | 96.314 | 0.225 |
| (u) | 216 | 18.206 | – | 12 / 92 | 0.804 | 139.568 | 0.230 |
| (v) | 512 | 21.537 | – | 113 / 113 | 0.976 | 103.882 | 0.376 |
| (w) | 343 | 23.588 | 1.5 | 46 / 451 | 0.698 | 79.536 | 0.396 |
We used the PW code, which is part of the Quantum-ESPRESSO package [12], only to compute two equations of state (EOS) of c-GeTe, using the same pseudopotentials and the same setup as described above except for the sampling of the BZ. EOS were used to test our FP simulation setup versus experimental and theoretical data available from literature and to validate the capability of the classical potential to reproduce the energies and the structures over a wide range of volumes, see section 3. GeTe has two crystalline phases: the rhombohedral phase, also called α-GeTe, which has R3m symmetry and is stable at standard conditions, and the cubic one, β-GeTe, which has Fm3m symmetry and is stable at 432 °C [13–15]. The α-GeTe phase was modeled using a single GeTe unit in a rhombohedral cell; geometry optimizations were repeated at several volumes and the resulting energies were fitted via a Murnaghan EOS [16]. At each volume, the edge a and the angle α of the rombohedric box were optimized such as to reproduce a diagonal stress tensor with residual anisotropy in the diagonal components of less than 1 kbar; BZ integration was performed over a 12 × 12 × 12 Monkhorst–Pack mesh [17]. The optimized lattice parameter of the box was a = 4.410 Å and the angle α was equal to 57.57°. These values are close to the experimental values: a = 4.2810 Å and α = 58.358° [18]. To model β-GeTe, we used a cubic box containing four GeTe units. For this system, BZ integration was performed over a 12 × 12 × 12 Monkhorst–Pack mesh. The optimized lattice parameter was a = 6.060 Å to be compared with the experimental one of a = 5.999 Å [13, 14]. The equation of state of pure Ge was computed using a cubic box containing eight atoms and BZ integration was performed over a 12 × 12 × 12 Monkhorst-Pack mesh: in this case the optimized lattice parameter was a = 5.775 Å, to be compared with the experimental one of 5.658 Å [19]. The equilibrium lattice constant of Te was obtained using an hexagonal box containing three atoms, and BZ integration was performed over a 6 × 6 × 6 Monkhorst–Pack mesh: here the optimized lattice parameters were a = 4.497 Å and c/a = 1.328.
The majority of the structures was produced via FP MD simulations using two different systems: the smaller one contained 64 atoms, the larger one 216 atoms. We used a rombohedric box containing 128 and 127 atoms to simulate perfect α-GeTe and α-GeTe containing a germanium vacancy, respectively, structures (a)–(b) in table 2. With the 64-atom system containing 32 GeTe units, we simulated liquid GeTe via BO MD simulations. Liquid GeTe was modeled with a 12.4-Å cubic box corresponding to the experimental density (5.58 g cm−3) of the l-GeTe [14, 20], structures (c) in table 2. The temperature was controlled via a Nosé–Hoover (NH) thermostat [21, 22] with a target temperature of 1200 K. The ionic timestep in BO MD was always 2.4 fs, and the total duration of the MD simulation was 17.0 ps. We reduced the temperature to 1000 K and performed 8.4 ps, followed by 9.7 ps at T = 800 K, and 10.2 ps at 700 K. Positions, forces and energies were recorded periodically. We scaled the atomic coordinates obtained at liquid density at T = 1200 K in a simulation box of 12.137 Å, corresponding to the density 5.95 g cm−3, and generated other structures (d) via a 6.1 ps long BO MD simulation at T = 1200 K. We cooled the system from T = 1200–300 K via four independent MD simulations lasting 4.4 (e), 14.2 (f), 17.7 and 21.3 ps (h) by rescaling the velocity at each step with a factor between 0.9992 and 0.9998.
Other structures were generated using a larger system containing 108 GeTe units. Structures labeled (i)–(l) in table 2 were created by introducing up to four germanium vacancies, and (m) and (n) by translating either only Te atoms or the Ge and Te atoms along the [111] direction. This particular distortion was inspired by the work of Kobolov et al [23] in which it was shown that changes in the optical properties in GST can occur during the distortion of the crystalline structure mentioned above. To build a potential that is transferable to a broad range of densities, we randomized the positions of c-GeTe with different displacements (always lower than 0.5 Å) at different lattice parameters, see structures (o) in table 2. With the 216-atom system, the atomic trajectories were generated via CP MD simulations at finite temperature; the configurations were then post-processed to compute their ground-state energies and the forces to be used for fitting (training) and testing the classical potential. This two-steps approach was necessary to correct the small error that affects energies and forces when using the CP scheme at finite temperature [24]. In contrast, BO MD simulations were used to evolve the 64-atom system at different temperatures. In the CP MD simulations we used a 0.12 fs timestep and an electron mass equal to 600 au; but to integrate the equation of motions of the ions in BO MD simulations a larger timestep equal to 2.4 fs was used. Constant temperature was imposed on the ions by a massive NH thermostat [21, 22]. As in GeTe at high temperature the energy gap between the highest occupied and lowest unoccupied orbitals was less than 0.1 eV, adiabaticity of the CP MD trajectory was maintained by coupling two separate NH thermostats to the nuclear and electronic subsystems [25]. We melted c-GeTe in a simulation lasting 5.5 ps by heating the system to T = 1200 K using a cubic box with 17.997 Å long edges, structures (p) in table 2. In a larger box, corresponding to a density equal of 5.58 g cm−3, see structures (q), l-GeTe was simulated at T = 1200 K in a 9.2 ps long run. Liquid GeTe was then scaled at higher density, 5.95 g cm−3, and quenched from 1200 K to room temperature in a 11.9 ps MD. DFT forces and energies of additional a-GeTe structures obtained via RE MD classical simulations were computed and using to refine the potential (s). We performed a CP MD simulation lasting 18 ps at T = 300 − 400 K and at density equal to 5.65 g cm−3 of structure (t), which is particularly favorable in energy obtained via classical RE simulations. Structures (u) result from DFT static calculations of a-GeTe structures obtained via classical MD simulations quenching from 875 K to room temperature in 4 ns.
We also used configurations of pure germanium and pure tellurium. Structures containing 512 Ge-atoms in a cubic box were produced via classical MD and RE simulations using the potential proposed by Tersoff [5] at different temperatures between 300 and 3000 K; the box size was 21.537 Å (v). Forces and energies on selected snapshots were computed via DFT as described above. To improve the fit of the parameters describing the tellurium we performed short DFT MD simulations lasting 1.5 ps at T = 625 K using a box containing 343 Te-atoms at a density of 5.68 g cm−3 (w).
3. Validation
We validated the classical potential by comparing different structural properties of the crystalline, the liquid and the amorphous phase with the DFT results described in section 2.
3.1. Crystalline GeTe, Ge and Te
We computed the EOS of the rhombohedral α and cubic β phases of c-GeTe using two systems made of 64 and 108 GeTe units, respectively. DFT and classical EOS are compared in figure 2. We fitted the energy versus volume data via Murnaghan EOS (see section 2). The lattice parameters, the bulk modulus and the bond lengths at the equilibrium volume are reported in table 3. The optimized structures of the rombohedric and the cubic phases at the equilibrium volume are shown in figure 3. We also tested the capability of the classical potential to reproduce the Peierls distortions occurring in c-GeTe over a broad range of volumes using the β phase, which is metastable at standard conditions. This bimodal distribution of short and long bonds has been shown even at high temperature by Fons et al [26]. We optimized the geometries with the classical potential at different lattice parameters, see figure 4, and we compared the DFT and the classical distances of the short and the long bonds. Both the DFT and the classical calculations used the same setup as was employed to compute the EOS: the 4 GeTe and 108 GeTe cubic boxes for the DFT and classical simulations, respectively. The Peierls distortion is reproduced correctly over the entire volume range. A very good agreement between DFT and classical distances is achieved at the technologically most interesting densities, which are close to the amorphous and the equilibrium crystalline volume per atom. We computed the formation energy of a Ge vacancy in the rhombohedral (cubic) phase by removal of a Ge atom from the perfect crystal containing 128 (216) atoms. The energy is computed after relaxation of the structure and using as reference the energy of a Ge atom in its bulk. The formation energies are 0.00 and −0.22 eV for the rhombohedral and cubic phases, respectively. The corresponding DFT values are 0.93 and 0.62 eV for the rhombohedral and cubic phases, respectively. The error is about 0.9 eV for both the geometries. For further validation, we performed the test proposed in [3], namely, to compute the energies of α-GeTe structures in which the Ge–Te distances were changed by shifting the Ge-atoms along the [111] direction, see figure 5. The agreement between DFT and classical data is very good.
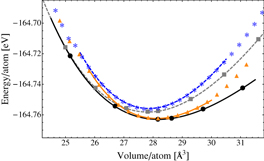
Figure 2. FP and classical EOS of different phases of c-GeTe: DFT (classical) data of the rombohedric α-GeTe and the cubic β-GeTe are indicated by black circles (orange triangles) and gray squares (blue stars), respectively. Solid lines are the fit to the data of the α phase: black and orange lines for DFT and classical fit, respectively; dashed lines are the fit to the data of the β phase: gray and blue lines for DFT and classical fit, respectively. The solid and the dashed lines are plotted over the range of volumes used for the Murnaghan fit.
Download figure:
Standard image High-resolution image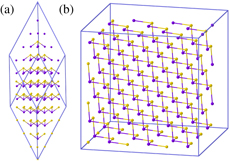
Figure 3. (a) Rhombohedric (R3m) α-GeTe and (b) cubic β-GeTe structures optimized with the Tersoff potential at the classical equilibrium volumes reported in table 3. The edges of the two supercells are indicated by blue solid lines. Ge and Te atoms are depicted with orange and violet spheres, respectively.
Download figure:
Standard image High-resolution image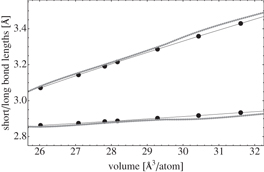
Figure 4. Peierls distortion in the cubic β-GeTe. The short and the long Ge–Te distances are plotted at different volumes. The classical results are obtained using a system consisting of 108 GeTe units in a cubic box. DFT calculations were performed adopting the same setup as that used to compute the EOS. Black and gray dots are DFT and classic results, respectively. Each point corresponds to an optimized geometry. Solid black lines are a linear interpolation of the DFT data.
Download figure:
Standard image High-resolution image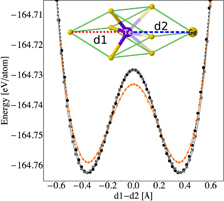
Figure 5. Total energy versus Ge–Te distance difference d1 − d2, see dotted line in the inset, in α-GeTe: Ge atoms have been displaced along the [111] direction. DFT and classical results at the DFT equilibrium lattice parameters are indicated by black dots and orange triangles, respectively. Gray squares are the classical results at the Tersoff equilibrium lattice parameters. Each point corresponds to a calculation; the dashed black line is a cubic interpolation of the DFT data. The simulation cell was kept fixed at the DFT equilibrium volume of table 3. DFT and classical calculations were performed with the same setup as that used to compute the EOS. The local maximum at 0.0 Å corresponds to a structure without Peierls distortions: each atom has six neighbors at the same distance. The agreement between the DFT and the classical data over a broad range of distances is extremely good (see black dots and gray squares) when the classical calculations are performed at the Tersoff equilibrium lattice parameters; at the DFT equilibrium lattice there are small differences.
Download figure:
Standard image High-resolution imageTable 3. DFT versus classical results: comparison of the GeTe phase, the equilibrium volume Veq, the angle α of the rombohedric phase, the bulk modulus B0 and the bond lengths of the short and long bonds.
| GeTe phase | Method | Veq (Å3 atom−1) | α (deg.) | B0 (GPa) | Three short bonds (Å) | Three long bonds (Å) |
|---|---|---|---|---|---|---|
| α (romb) | DFT | 28.187 | 57.57 | 29.5 | 2.83 | 3.33 |
| α | classical | 27.928 | 53.81 | 49.5 | 2.83 | 3.31 |
| β (cubic) | DFT | 27.817 | 90 | 38.2 | 2.88 | 3.19 |
| β | classical | 27.831 | 90 | 51.6 | 2.85 | 3.23 |
To compute the EOS of crystalline Ge we used a cubic 512-atom box. The equilibrium lattice parameters (bulk modulus, B0) obtained via the fit of the EOS for pure Germanium are 5.775 Å (B0 = 57.3 GPa) and 5.853 Å (B0 = 46.0 GPa), DFT and classical, respectively. The equilibrium geometry of pure tellurium was computed using an hexagonal box containing 375 Te atoms, a 5 × 5 × 5 supercell. The equilibrium volume is 34.607 Å3 atom−1, the c/a = 1.220, and the bulk modulus B0 = 115 GPa, to be compared with 34.880 Å3 atom−1, c/a = 1.328 and B0 = 21.5 GPa obtained via our DFT calculations. These large deviations show the limit of the short of the Te–Te interaction, about 4 Å, too short to properly model pure Tellurium. In the current formulation, the maximum value of the cutoff cannot be larger than the second neighbor distance of Te–Te in c-GeTe. A larger database of structures including liquid and amorphous, like those produced in [27, 28], combined with a long range interaction can improve the description of pure Tellurium.
3.2. Liquid GeTe
The structural and dynamic properties of l-GeTe were investigated using two cubic boxes containing 216 and 4096 atoms at a density equal to 5.65 g cm−3. We performed two constant temperature MD simulations lasting 100 ps at T = 1150 K using the Berendsen thermostat with a 24 fs coupling constant. We selected different configurations from the two trajectories corresponding to the small and the large systems, and from those configurations we started 100 and 32 independent MD simulations at T = 1150 K using 216 and 4096 atoms, respectively. These simulations were later used to quench the liquid in the amorphous phase. We computed the pair correlation function and the angle distribution from the 100 trajectories containing 216 atoms; the same was done with the 32 trajectories containing 4096 atoms. Coordination numbers are reported in the supplementary data (available from stacks.iop.org/NJP/15/123006/mmedia). In figures 6 and 7, DFT results taken from [3] and classical results on the 216 systems are compared. The overall agreement is good, with the largest deviation between DFT and classical results appearing in the pair correlation function: we obtained a sharper and higher Ge–Te peak. We plotted only the results of the smaller system, because we did not find appreciable differences between the properties computed for the smaller (216 atoms) and the bigger (4096 atoms) systems. This is probably due to the fact that the interactions of our potential are much shorter than the size of the 216-atom cubic box (which s 18.6 Å in size). We equilibrated the 4096-atom system at T = 1000 K with an MD simulation at the liquid experimental density, 5.58 g cm−3 [20], then we performed a 180 ps constant volume and energy (NVE) MD simulation to compute the diffusion coefficient from the mean-squared displacement using the Einstein equation

where t is the time. The average is carried out over the i atoms of the I-species. RI(t) are the time dependent coordinates. The diffusion coefficients computed are 5.58 and 4.11 ×10⁻⁵cm2 s−1 for the germanium and tellurium species, respectively. Our short-range potential overestimates the theoretical diffusion coefficient computed via FP MD in [29] by about 20 (Ge) and 5% (Te): 4.65 ×10⁻⁵ (Ge) and 3.93 × 10⁻⁵ cm2 s−1 (Te). Probably, our short-range Tersoff potential produces a smoother potential that results in a more diffusive GeTe. The effect of the cutoff on the diffusion coefficient has been mentioned in [3], in which the authors reported that an increase of the cutoff from 6.0 to 6.88 Å resulted in an improved description of the diffusion coefficient.
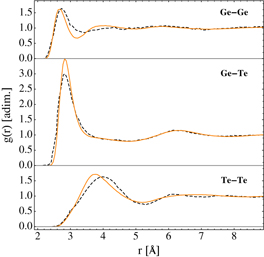
Figure 6. Pair correlation function g(r) of l-GeTe at T = 1150 K and density equal to 5.65 g cm−3: (top) Ge–Ge, (middle) Ge–Te and (bottom) Te–Te. Orange solid lines and black dashed lines represent classical and DFT results, respectively. DFT data were taken from [3].
Download figure:
Standard image High-resolution image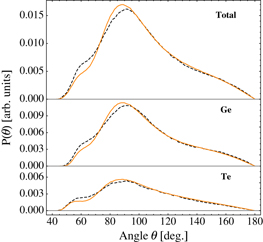
Figure 7. Angle distribution P(θ) of l-GeTe at T = 1150 K and a density equal to 5.65 g cm−3: (top) total, (middle) X–Ge–Y and (bottom) X–Te–Y triplets with X,Y = Ge or Te. We considered Ge–Ge, Te–Te pairs bonded at distances shorter than 3.0 Å and Ge–Te pairs lower than 3.22 Å (as defined in [3]). Orange solid lines and black dashed lines represent classical and DFT results, respectively. DFT data were taken from [3] and scaled by a factor such that the area below the curve is equal for DFT and classical results.
Download figure:
Standard image High-resolution image3.3. Amorphous GeTe
Amorphous GeTe configurations were generated by quenching l-GeTe via a series of classical MD simulations, in each of which the temperature was reduced in subsequent 50 K steps from 1150 K to room temperature. The entire duration of the simulation was 100 ps. We chose the same quenching time as in [3] to compare structures obtained with the same protocol. We performed 100 and 32 independent quenching using different initial configurations of l-GeTe containing 216 and 4096 atoms, respectively, i.e. systems described in section 3.2. The box size corresponded to a of 5.65 g cm−3, which is close to the experimental values of a-GeTe: 5.6 ± 0.6 and 5.7 g cm−3 in [30, 31], respectively. Using each of the 100 a-GeTe structures as starting point, we then carried out 100 MD simulations at T = 300 K. We computed the pair correlation function and the angle distribution averaging over the 100 trajectories. In figure 8, our classical pair correlation function is compared with DFT data from [3]. The Ge–Ge pair correlation functions are in good agreement; the first Ge–Te presents the largest deviation, the classic peak is much narrower, and a shift of about 0.2 Å is observed in the Te–Te peaks. The deviation in the Te–Te interaction can be due to the short-range potential. We could have choosen a longer cutoff parameter SI,J for Te–Te, but this resulted in a worse description of c-GeTe at high densities, where the second neighbors Te–Te are at shorter distances. The classical and DFT angle distributions are compared in figure 9: the overall agreement is good. Our classical angle distribution compares well with the DFT one. As reported in [3], we also found the formation of strained three-membered rings (3MR), which are responsible for the small shoulder in the angle distribution at about 60°. These highly strained rings are probably absent in the experimental a-GeTe samples, which are usually annealed at a much slower rate than in our simulations. Possibly they would not appear either in DFT if longer simulations were carried out. Our potential produces a much smaller fraction of 3MR than the classical potential proposed in [3] does. We would like to emphasis that the modified term described in equation (11) improved the angle distribution. Specifically, the second peak in the bimodal angle distribution of germanium at about 165° did not appear with the original equation of the Tersoff potential. We computed the vibrational density-of-states (DOS) of the 100 optimized a-GeTe geometries and compared the classical DOS with the DFT [3], see figure 10. The averaged potential energy of the optimized amorphous structures is 0.27 eV atom−1 higher than that energy of the crystalline phase at the equilibrium volume.

Figure 8. Pair correlation function g(r) of a-GeTe at T = 300 K and a density equal to 5.65 g cm−3: (top) Ge–Ge, (middle) Ge–Te and (bottom) Te–Te. Orange solid lines and black dashed lines represent classical and DFT results, respectively. DFT data were taken from [3].
Download figure:
Standard image High-resolution image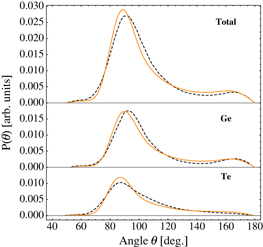
Figure 9. Angle distribution P(θ) of l-GeTe at T = 300 K and a density 5.65 g cm−3: (top) total, (middle) X–Ge–Y and (bottom) X–Te–Y triplets with X,Y = Ge or Te. The definition of angle is that of figure 7. Orange solid lines and black dashed lines represent classical and DFT results, respectively. DFT data were taken from [3].
Download figure:
Standard image High-resolution image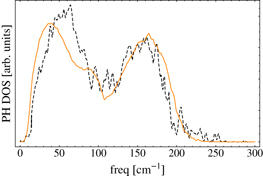
Figure 10. Vibrational DOS of 32 optimized a-GeTe geometries (containing 216 atoms) at a density of 5.65 g cm−3. Orange solid lines and black dashed lines represent classical and DFT results, respectively. DFT data were taken from [3].
Download figure:
Standard image High-resolution image
The structural properties computed so far do not require a definition of bonds, with the exception of the angle distribution which does not depend dramatically on a particular definition. On the contrary, the analysis of coordination numbers type resolved, q-order parameter [32], and statistic of rings [33] depends strongly on the criteria used to define a bond. We report in the supplementary data (available from stacks.iop.org/NJP/15/123006/mmedia) additional structural analysis to provide data for comparing with pre-existing data using the definition of bonds of [3]; we find this criteria not enough accurate to define properly the bond network. For this reason, although this paper is focused on the classical potential, in the supplementary data, we show that localized Wannier functions, just to mention one, are more appropriate to define the bond network than criteria based on distances.
4. Conclusions
In this work, we developed a classical potential to model the amorphous phase of GeTe. The functional form of this empirical potential is the extended Tersoff potential proposed by Billeter et al [6] plus a modified three-body term to improve the description of a-GeTe. The 50 parameters defining our potential were fitted to reproduce DFT energies and forces of different configurations of Ge, Te and GeTe. Almost all the GeTe structures of our reference database contained an integer number of GeTe atoms, except for those structures in which germanium vacancies were introduced.
We demonstrated that despite the relatively simple functional form of the potential, we were able to describe the structural features of c-GeTe, l-GeTe and a-GeTe over a broad range of densities. In the validation section (section 3), we computed the pair correlation function, equation of states and angle distributions of different phases of GeTe. Overall they compared very well with data available in literature. The structural distortion occurring in the cubic phase is extremely well reproduced over a broad range of volumes. Although our potential underestimates the energy difference between crystalline and amorphous GeTe by 0.17 eV atoms−1, we found that c-GeTe spontaneously forms during RE MD simulations, an indication of the right ordering of energies. The large deviations appear in the Te–Te pair correlation function of a-GeTe and in the lattice parameter of c-Te. This issue does not limit the modeling of GeTe that contains a relatively low fraction of Te–Te bonds. A long range interaction can be included for systematic improvement of alloys containing more tellurium.
The main advantages of the approach presented in this work compared to the more sophisticated and accurate neural network-based potentials can be summarized as follows. Almost every parameter of the potential is connected to a physical property; this made the fitting procedure much faster and transferability of the potential to configurations very far from those included in the training set such as surfaces, clusters and different compositions much easier. During the fitting procedure, we can monitor the evolution of the values of the parameters and we drive the fit by selecting the groups of parameters that are modified simultaneously. We used slightly less than 1000 configurations for the fit, about 30 times less than the number of configurations used to construct the neural network potential proposed in [3]. The simple functional form, described by a few tens of parameters, fifty in our case, is an extension of the standard Tersoff potential, that can readily be implemented in every MD code both in the serial and parallel platforms. All parameters defining the potential are given in table 1. The validity of the potential when applied to specific problems can be easily checked. On a single CPU of an IBM®POWER7®3 the CPU time is 0.275 s step−1 of MD of a l-GeTe made of 4096 atoms: this is the typical computational time of a Tersoff potential. Within this approach, it also becomes feasible to introduce additional species, such as Sb-atoms, just to name one, to extend the study to different alloys, or dopants, such as C-atoms [34], or Si-atoms, to tune the properties of the amorphous and of the crystalline phases. When necessary, with the present formulation additional terms linked to physical interactions, such as electrostatic or van der Waals (vdW) interactions, can be introduced for systematic improvements. For example, experiments on GeTe–Sb2Te3 alloys have shown that the contribution to the bonding due to vdW interactions becomes more important with decreasing GeTe content and increasing Sb2Te3 content [35]. Similarly, FP calculations on Ge15Te85 have shown the importance to include vdW interactions to properly model the pair correlation function of Te-atoms in systems with high content of tellurium [36]. Our work shows that a simple classical potential, which can be easily implemented and used by the scientific community, can successfully model a complex material like germanium–telluride opening the possibility to simulate the structural changes that occur in PCM based memories during the set and reset processes.
Footnotes
- 2
CPMD, Copyright Corp IBM 1990–2013 and MPI für Festkörperforschung, Stuttgart, Germany, 1997–2001.
- 3
IBM and POWER7 are trademarks of International Business Machines Corporation, registered in many jurisdictions worldwide. Other product or service names may be trademarks or service marks of IBM or other companies.