


Abstract
We use the diffusion quantum Monte Carlo (DMC) method to calculate the ground-state phase diagram of solid molecular hydrogen and examine the stability of the most important insulating phases relative to metallic crystalline molecular hydrogen. We account for finite-size errors by combining the use of twist-averaged boundary conditions with corrections obtained using the Kwee–Zhang–Krakauer functional in density functional theory. To study the closure of the band gap with increasing pressure, we perform quasi-particle many-body calculations using the GW method. In the static approximation, our DMC simulations indicate a transition from the insulating Cmca-12 structure to the metallic Cmca structure at around 375 GPa. The GW band gap of Cmca-12 closes at roughly the same pressure. In the dynamic DMC phase diagram, which includes the effects of zero-point energy in the quasi-harmonic approximation, the Cmca-12 structure remains stable up to 430 GPa, well above the pressure at which the GW band gap closes. Our results predict that the semimetallic state observed experimentally at around 360 GPa (2012 Phys. Rev. Lett. 108, 146402) may correspond to the Cmca-12 structure near the pressure at which the band gap closes. The dynamic DMC phase diagram indicates that the hexagonal-close-packed P63/m structure, which has the largest band gap of the insulating structures considered, is stable up to 220 GPa. This is consistent with recent x-ray data taken at pressures up to 183 GPa (2010 Phys. Rev. B 82 060101), which also reported a hexagonal-close-packed arrangement of hydrogen molecules.
Export citation and abstract BibTeX RIS

Content from this work may be used under the terms of the Creative Commons Attribution 3.0 licence. Any further distribution of this work must maintain attribution to the author(s) and the title of the work, journal citation and DOI.
1. Introduction
Solid molecular hydrogen is the simplest and most fundamental quantum molecular crystal. At high pressure it is predicted to become not only a metallic atomic solid [1] but also a high-Tc superconductor [2] and perhaps a superfluid [3]. Although there are experimental results for the structure and phase diagram of high-pressure hydrogen at room temperature [4–8], the crystal structures appearing in the complex low-temperature high-pressure phase diagram are not yet completely determined. Spectroscopic investigations using infrared (IR) and Raman methods suggest the existence of three phases [9]. Phase I, which is stable up to 110 GPa, is a molecular solid composed of quantum rotors arranged in a hexagonal-close-packed (hcp) structure. Changes in the low-frequency regions of the Raman and IR spectra imply the existence of a second phase above 110 GPa; this is known as phase II, or the broken symmetry phase. The continuous behaviour of the Raman vibron frequency across the I to II transition suggests that phase II may also consist of an arrangement of molecules on an hcp lattice, as in the P63/m structure. Calculations based on density functional theory (DFT) predict orthorhombic Cmc21, Pca21 and P21/c structures [10–12]. The molecular centres in these structures lie close to those of an hcp lattice, but are incompatible with neutron data for solid deuterium [13]. The appearance of phase III at 150 GPa is accompanied by a large discontinuity in the Raman spectrum and a strong rise in the spectral weight of the IR molecular vibrons. Although the structures of phase II and phase III are not known for certain, recent x-ray results [14] at pressures up to 183 GPa suggest that the hydrogen molecules in both phases lie close to the points of an hcp lattice. Recent IR and optical absorption results [15] indicate that the molecular structure of phase III persists up to 360 GPa, with no evidence of the onset of a metallic state.
Computational methods used to investigate the high-pressure low-temperature phase diagram of solid molecular hydrogen include DFT [11, 12, 16–20] and quantum Monte Carlo (QMC) [21, 22]. Approaches used to explore the phase space of possible structures include the evolutionary method of Oganov and Glass [23] and the static ab initio structure searching method of Pickard and Needs [24], which has also been employed to determine the ground-state structure of atomic metallic hydrogen [25]. Recently, a series of four papers [26, 27] presented a fresh look at the high-pressure hydrogen problem. By studying the equalization of the intra- and inter-molecular H–H bond lengths in dense hydrogen, these papers investigated the four most stable structures found by Pickard and Needs [24] using DFT in the static approximation (i.e. ignoring the zero-point (ZP) vibrational energy of the H atoms).
However, all of the recent calculations of the metallization pressure and phase diagram are based on the single-particle mean-field-like DFT description of the electronic states. This has various drawbacks, such as the band-gap problem and the sensitivity of the results to the choice of exchange-correlation (XC) functional, which affects both the relative stabilities of different phases and the predicted metallization pressure. Indeed, we have shown recently [28] (see also [20] for a study using hybrid functionals) that the differences between XC functionals are large enough to render DFT incapable of providing a reliable description of the phase diagram of solid hydrogen. Furthermore, attempts to explore the phase space of possible structures have been based primarily on DFT in the static approximation, which ignores the proton ZP energy (ZPE). Since the ZPE is larger than the energy differences between various candidate structures, structure-searching methods including an approximate ZPE should be considered. Most of the existing DFT calculations of solid hydrogen have used the local density approximation (LDA) or the generalized gradient approximation (GGA) to the unknown XC functional. Neither of these functionals adequately describes van der Waals (vdW) interactions.
In this paper, we use QMC simulations to determine the electronic ground-state energy of several proposed phases of solid molecular hydrogen in the pressure range 100 < P < 400 GPa. By combining our QMC results with ZPEs calculated at the DFT level, we determine the phase diagram. We study in particular the two main factors affecting the quality of the calculated phase diagram: finite-size (FS) errors and proton ZPE. To investigate the reduction of the band gap as the pressure increases we also carry out many-body perturbation theory calculations within the GW approximation. We focus on four specific structures, with space groups P63/m, C2/c, Cmca-12 and Cmca. According to ground-state static DFT calculations using the Perdew–Burke–Ernzerhof (PBE) version of the GGA [29], these are stable in the pressure ranges <105, 105–270, 270–385 and 385–490 GPa, respectively [24].
2. Computational methods
2.1. Diffusion quantum Monte Carlo (DMC)
Diffusion quantum Monte Carlo [30] (DMC) is a stochastic projector method for solving the imaginary-time many-body Schrodinger equation

where t is a real variable measuring the progress in imaginary time, R = (r1,r2,...,rN) is a 3N-dimensional vector specifying the coordinates of all N electrons in the system, and ET is an energy offset. Defining the Green function

one can rewrite the imaginary-time many-body Schrödinger equation in the integral form

Utilizing the spectral expansion,

the Green function can be expressed as

where Ψi and Ei are eigenfunctions and eigenvalues of  , respectively, and the sum is over the complete set of eigenfunctions. It is straightforward to show that, as τ → ∞, the operator
 ![$\exp [-\tau (\skew 3\widehat {H} - E_T)]$](https://content.cld.iop.org/journals/1367-2630/15/11/113005/revision1/nj484591ieqn2.gif) projects out the lowest eigenstate |Ψ0〉 that has non-zero overlap with the starting state |Φ(R,t = 0)〉. This fundamental property of the projector
projects out the lowest eigenstate |Ψ0〉 that has non-zero overlap with the starting state |Φ(R,t = 0)〉. This fundamental property of the projector ![$\exp [-\tau (\skew 3\widehat {H}- E_T)]$](https://content.cld.iop.org/journals/1367-2630/15/11/113005/revision1/nj484591ieqn3.gif) is the basis of the DMC method and similar projector-based approaches.
is the basis of the DMC method and similar projector-based approaches.
In a practical DMC simulation, equation (1) is expressed in real space

where  is the 3N-dimensional Laplacian. Equation (6) may be interpreted as describing the time evolution of the probability density of a population of abstract 'walkers'—points R in the 3N-dimensional phase space—diffusing under the influence of the Laplacian term whilst simultaneously multiplying or dying out at a rate dependent on the local sign and magnitude of V (R) − ET . This intuitive picture can be derived mathematically by using the Trotter decomposition [31] to obtain an approximation to G(R←R',τ) valid in the small τ limit. The short-time propagator consists of a Gaussian diffusion term multiplied by a reweighing term that describes the multiplication/death process. A DMC simulation uses this prescription to evolve a population of a few hundred walkers explicitly, time step by time step. After many time steps the walker population settles down to sample the ground-state wave function and ground-state expectation values can be accumulated.
Due to the antisymmetry property of fermions, the many-body electronic wave function cannot be positive everywhere and has to take both positive and negative values. The weak point of the naive DMC algorithm described above is that it can handle only non-negative wave functions. Fixed-node DMC is the most widely used method for dealing with the fermionic antisymmetry. The wave function Φ(R,t) is multiplied by a fermionic trial wave function ΨT (R) and equation (6) is replaced by an equivalent equation for the imaginary-time evolution of the product f(R,t) = ΨT (R)Φ(R,t). The initial wave function Φ(R,t = 0) is set equal to ΨT (R), ensuring that f(R,t = 0) is non-negative. The evolution equation for f is then solved subject to the constraint that f(R,t) is zero wherever ΨT (R) is zero, which ensures that f never becomes negative. It may be shown [30] that this procedure yields the energy expectation value of the variationally optimal wave function with the same nodal surface (surface of zeros) as the chosen many-electron trial function. The introduction of the trial wave function (the form of which is discussed below) also vastly reduces the statistical noise in the results. Indeed, if ΨT is equal to the exact ground-state Ψ0, the fixed-node method yields the exact ground-state energy with zero statistical noise. If ΨT differs from Ψ0 but has the same nodal surface, the exact ground-state energy is obtained with a non-zero statistical error bar. If the nodal surface of ΨT differs from that of Ψ0, the expected value of the fixed-node ground-state energy is a variational upper bound on the true ground-state energy.
The fixed-node DMC method has a long history and has been thoroughly benchmarked [30, 32, 33]. For small systems, where even more accurate results can be obtained using quantum chemical methods, total energies calculated using fixed-node DMC are consistently more accurate than energies calculated using DFT and comparable in quality to energies obtained using the coupled cluster singles and doubles with perturbative triples method often referred to as the 'gold standard' of quantum chemistry [34–37]. Moreover, unlike DFT, fixed-node DMC provides a good description of weak interactions [38–44] such as those acting between the H2 molecules in solid molecular hydrogen. DMC also describes the dependence of the total energy on coordination number (very important when comparing the energies of different crystal structures) and the form of the potential surface during bond-breaking processes more accurately than DFT. For large systems such as the ones studied in this paper, fixed-node DMC is the most accurate known ground-state total energy method and the only possible benchmarks are against experiment. Again, however, DMC consistently outperforms DFT. For example, the measured cohesive energy of crystalline Si is 4.62 eV atom−1; fixed-node DMC simulations using a trial function similar in form to the trial functions used in this paper yield 4.63 eV atom−1 [45]; and DFT in the local spin-density approximation yields 5.28 eV atom−1. In this particular (unusually favourable) case, the DMC result is 65 times more accurate than the DFT result. The ability of DMC to describe changes in coordination is illustrated by the example of the Si self-interstitial defect [45]. The fixed-node DMC value of the defect formation energy, which is in good agreement with experiment, is about 1 eV larger than the PW91 GGA value and 1.5 eV larger than the LDA value. The main drawback of DMC, which explains why it is not more widely used, is the computational cost: a DMC simulation typically costs about 104 times more than a DFT simulation of the same system.
Our fixed-node DMC simulations used the CASINO QMC code [32] and a trial function of Slater–Jastrow (SJ) form,

where R is a 3N-dimensional vector that defines the positions of all N electrons, r↑i is the position of the ith spin-up electron, r↓j is the position of the jth spin-down electron, ![$\exp [J({\bf{ R}})]$](https://content.cld.iop.org/journals/1367-2630/15/11/113005/revision1/nj484591ieqn5.gif) is the Jastrow factor and
is the Jastrow factor and ![$\det [\psi _{n}({\bf{ r}}_i^{\uparrow })]$](https://content.cld.iop.org/journals/1367-2630/15/11/113005/revision1/nj484591ieqn6.gif) and
and ![$\det [\psi _{n}({\bf{ r}}_j^{\downarrow })]$](https://content.cld.iop.org/journals/1367-2630/15/11/113005/revision1/nj484591ieqn7.gif) are Slater determinants of spin-up and spin-down one-electron orbitals. These orbitals were obtained from DFT calculations using the plane-wave-based Quantum Espresso code [46]. A norm-conserving pseudopotential constructed within DFT using the PBE XC functional was employed [47]. Previous work has shown that the pseudopotential approximation has a very small impact on the results of calculations of high-pressure solid hydrogen [25]. We chose a very large basis-set cut-off of 300 Ryd to guarantee converge to the complete basis set limit [48]. The plane-wave orbitals were transformed into a blip polynomial basis [49]. Our Jastrow factor consists of polynomial one-body electron–nucleus (en) and two-body electron–electron (ee) terms, the parameters of which were optimized by variance minimization at the variational Monte Carlo (VMC) level [50, 51].
are Slater determinants of spin-up and spin-down one-electron orbitals. These orbitals were obtained from DFT calculations using the plane-wave-based Quantum Espresso code [46]. A norm-conserving pseudopotential constructed within DFT using the PBE XC functional was employed [47]. Previous work has shown that the pseudopotential approximation has a very small impact on the results of calculations of high-pressure solid hydrogen [25]. We chose a very large basis-set cut-off of 300 Ryd to guarantee converge to the complete basis set limit [48]. The plane-wave orbitals were transformed into a blip polynomial basis [49]. Our Jastrow factor consists of polynomial one-body electron–nucleus (en) and two-body electron–electron (ee) terms, the parameters of which were optimized by variance minimization at the variational Monte Carlo (VMC) level [50, 51].
Geometry and cell optimizations were carried out using DFT with a dense 16 × 16 × 16 k-point mesh. The BFGS quasi-Newton algorithm, as implemented in the Quantum Espresso package, was used for both cell and geometry optimization, with convergence thresholds on the total energy and forces of 0.01 and 0.1 mRy Bohr−1, respectively, to guarantee convergence of the total energy to less than 1 meV proton−1 and the pressure to better than 0.1 GPa. An investigation of the proton–proton distance of accurately relaxed structures in the pressure range of 100–450 GPa reveals two main features. Firstly, as the pressure increases, the intra-molecular H2 bond length (nearest-neighbour distance) increases slightly, rising from 0.735 to 0.778 Å. This could be a consequence of a weakening of the H2 bonds as the coordination of the H atoms increases. Second, unlike the intra-molecular H2 bond length, the inter-molecular distance decreases smoothly as the pressure rises. Details of the behaviour of the inter-atomic distance with pressure and of the experimental evidence are presented in [26].
2.2. GW approximation
Band gaps obtained from DFT simulations are not formally equivalent to the quasi-particle band gaps measured experimentally and depend strongly on the choice of XC functional. Local and semi-local functionals, in particular, yield DFT band gaps much smaller than experimental gaps. DMC does not suffer from the band-gap underestimation problem and can be used to obtain limited information about excited states. However, other approaches such as the GW method used in this work are generally better for excitation spectra. Many-body perturbation theory within the GW approximation has been widely tested and shown to yield highly accurate bandgaps of semiconductors and weakly correlated insulators. The results of GW calculations of the band gaps of sp-bonded materials generally match experiment to within a few tenths of an eV [52].
The quasi-particle spectrum of a solid can be determined from the Dyson equation [53],

where Enk are the quasi-particle energies, T is the kinetic-energy operator, Vn is the potential due to the nuclei, VH is the Hartree potential and Σ is the electron self-energy operator. In the GW approach, the self-energy operator is approximated by the first term of an expansion in the dynamically screened Coulomb interaction [53]

where W =  −1VC is the screened Coulomb interaction, VC is the bare Coulomb interaction and is the dielectric matrix. The electron Green function G is given in the quasi-particle approximation by

where ψi is the DFT wave function obtained by solving the Kohn–Sham equations, δi = 0− for a quasi-electron and δi = 0+ for a quasi-hole. The static dielectric matrix is obtained within the random-phase approximation, RPA = 1 − VCχ0, where

is the independent-particle polarizability, |υ,k〉 and ευ,k are the valence-band DFT eigenvectors and eigenvalues and |c,k〉 and εc,k are the conduction-band DFT eigenvectors and eigenvalues. The static dielectric matrix (ω = 0) is extended to finite frequencies using a generalized plasmon-pole model [53].
In this work, all GW quasi-particle band gaps were calculated using the Yambo code [54]. Non-self-consistent GW calculations were performed starting from DFT wave functions, using a plasmon pole approximation for the dielectric function [55, 56]. Following convergence checks, the numbers of unoccupied bands and k-points were set to 200 and 512, respectively. We also checked convergence with respect to the number of plane waves, which was set to 1800 for the P63/m structure and 2700 for the Cmca-12 and C2/c structures. It is important to point out that our GW and DMC results are independent of one another. DMC is used to calculate the enthalpy as a function of pressure, whilst GW is used to calculate the quasi-particle band gap as a function of pressure. Both methods use the same relaxed DFT crystal structures, but they are otherwise unrelated.
3. Results and discussion
3.1. Effect of single-particle Slater determinant on quantum Monte Carlo (QMC) energy
Our previous DFT work [20] showed that hybrid XC functionals including a small fraction of exact exchange favour insulating phases relative to metallic phases. Very recently [28], we have also shown that DFT results for high-pressure solid molecular hydrogen, at both the static (ignoring the effects of proton ZPE) and dynamic (including the effects of proton ZPE) levels, depend strongly on the choice of XC functional. Since DFT orbitals are used to construct our DMC trial wave functions and thus to define the fixed nodal surface, it is important to investigate how the choice of density functional affects the DMC results. For this purpose, we compared the VMC and DMC energies of the insulating P63/m phase (which has the largest band gap of the four structures considered) using orbitals calculated using the semi-local PBE GGA functional [29] and the PBE0 hybrid functional including 25% exact exchange [57]. The VMC and DMC calculations were performed at the Γ point of the Brillouin zone of a simulation cell containing 128 hydrogen atoms and 2 × 2 × 2 replicas of the P63/m unit cell. The VMC and DMC energies at pressures 100, 200 and 300 GPa, are given in table 1.
Table 1. VMC and DMC energies of the P63/m phase calculated using PBE and PBE0 single-particle orbitals. Energies and pressures are in eV per proton and GPa, respectively.
| Pressure | PBE-VMC | PBE0-VMC | PBE-DMC | PBE0-DMC |
|---|---|---|---|---|
| 100 | −15.1335(4) | −15.1397(4) | −15.2327(3) | −15.2338(3) |
| 200 | −14.5898(4) | −14.5979(4) | −14.6856(3) | −14.6867(3) |
| 300 | −14.0473(4) | −14.0524(4) | −14.2184(3) | −14.2193(3) |
The difference between the PBE and PBE0 energies is about 6 meV atom−1 at the VMC level and 1 meV atom−1 at the DMC level. Similar calculations for the Cmca-12 structure at two different pressures gave similar results. This demonstrates that, in the case of solid molecular hydrogen, DMC energies calculated using PBE and PBE0 orbitals differ negligibly, even though the change of functional has a large effect on the DFT phase diagram [20, 28]. The very weak dependence of the DMC energy on the choice of single-particle orbitals suggests, furthermore, that the fixed-node errors are small. This contrasts with the case of 3d transition metal compounds [58], where changing the DFT XC functional does affect the DMC results.
Computational cost prevented us from using backflow trial wave functions [59–62] throughout this work, but we did test the accuracy of the trial nodal surface by carrying out a few backflow DMC simulations for the metallic Cmca phase in a 64 electron simulation cell. Based on an old idea due to Feynman [63], the backflow transformation allows the one-electron orbitals in the determinant to depend on the positions of the other electrons in the simulation. In practice this dependence is parameterized and the parameters optimized variationally, thus improving the trial nodal surface. The introduction of backflow decreases the DMC total energy by approximately 10 meV per proton. Much of this reduction is expected to cancel when comparing the energies of different phases, so the effect of backflow on energy differences is unlikely to be larger than a few meV per proton.
3.2. Finite-size corrections to the DMC energy
In DFT, the limit of infinite system size can be approached by improving the k-point sampling. Since the Coulomb energy depends only on the charge density, which is periodic in an infinite system, it can be calculated exactly given the charge density of one unit cell. In a QMC simulation, however, we sample random snapshots of the positions of the N point-like electrons within the simulation cell. The Coulomb energy of a snapshot is defined by replicating it periodically and solving Poisson's equation for the infinite periodic lattice. In a real crystal, the electrons in neighbouring cells would be in different positions, so this procedure introduces spurious correlations. Hence, although it is still possible to use the many-body equivalent of k-point sampling (often referred to as twist averaging [64]), increasing the number of k-points no longer produces exact results for an infinite system. The resulting FS effects are a significant source of error [30]. The following QMC results used C2/c, Cmca-12, P63/m and Cmca simulation cells containing 96, 96, 128 and 144 atoms, respectively, equivalent to 2 × 2 × 2, 2 × 2 × 2, 2 × 2 × 2 and 3 × 2 × 3 repetitions of the corresponding unit cells.
QMC FS errors are conventionally separated into one-body and many-body contributions. One-body (independent-particle) errors arise from the non-interacting kinetic, potential and Hartree energies and include shell-filling effects. These errors can be removed by twist averaging [64]. Many-body errors arise from the effects of exchange and correlation on the Coulomb and kinetic energies and are not removed by twist averaging. Various techniques may be used to reduce or cancel these errors, but none is entirely successful and care is required. The oldest approach is extrapolation, which remains useful. The use of the 'modified periodic Coulomb interaction' [65–67] reduces the Coulomb errors but not the kinetic energy errors and must therefore be combined with other techniques. The Kwee–Zhang–Krakauer (KZK) approach [68] applies corrections obtained from DFT calculations carried out using a modified XC functional explicitly designed to mimic the DMC many-body errors. Most recently, structure-factor-based approaches that reduce both the kinetic and potential energy many-body errors have been developed [69, 70].
To remove single-particle errors and eliminate shell effects in the kinetic energies of metallic systems, we use twist-averaged boundary conditions (TABC) [64]. A twist ks is imposed by insisting that the many-electron wave function Ψks obeys the boundary condition

for all electrons i. Expectation values of observables are obtained by averaging over twist vectors ks uniformly distributed over the simulation-cell Brillouin zone:

The twists can be chosen from a uniform Monkhorst–Pack grid, preferably offset from Γ, or can be chosen randomly, as in this work. The number of twists should be as large as computational resources allow.
We tested three different methods for dealing with the many-body FS errors. The first was the KZK approach [68], which uses a system-size-dependent LDA fitted to the results of DMC simulations of finite cubic simulation cells of uniform electron gas. DFT energies calculated using the KZK functional incorporate DMC FS errors within an approximation analogous to the LDA. To estimate the FS error in the DMC total energy of a given simulation cell, the DFT total energy of exactly the same simulation cell is calculated using the KZK functional. The difference between this value and the DFT energy of an infinite simulation cell calculated using the standard LDA provides an estimate of the DMC FS error. The KZK functional was not originally combined with twist averaging, but the combination is easy to implement (see below) and very successful.
The second and third methods tested made use of the structure-factor-based corrections proposed by Chiesa et al [69] and Drummond et al [70]. The second approach used the standard Ewald form of the periodic Coulomb interaction and Chiesa corrections for the kinetic and potential energies. The third approach combined the use of the modified periodic Coulomb interaction [65–67] with Chiesa corrections for the kinetic energy only.
To check the accuracy and convergence of the DMC energy as a function of the number of protons N in the simulation cell, we performed calculations for different N (and thus also different L). Table 2 compares the results obtained using all three finite-size correction methods for the metallic Cmca phase. The convergence of the KZK-corrected DMC energy with increasing N is excellent and there is no difficulty in reaching the accuracy of a few meV per proton necessary for calculations of the hydrogen phase diagram at high pressure and low temperature. Our DMC-TABC energies were averages over 12 random twists in the simulation-cell Brillouin zone, corresponding to 12 randomly translated Monkhorst–Pack k-point meshes in the primitive Brillouin zone. In the case of the metallic Cmca structure, we also carried out DMC-TABC calculations using 24 twists; the change in the total energy was about 1.4 meV proton−1 at P = 400 GPa, implying that DMC energies obtained by combining TABC and KZK FS-corrections converge very rapidly as the number of twists is increased. We emphasize the importance of our approach to the treatment of FS errors as an application of TABC to real systems [71].
Table 2. DMC energies of the metallic Cmca phase for different numbers N of protons in the simulation cell. All DMC energies were calculated using twelve randomly chosen twists. A comparison between the FS-corrected results obtained using the Ewald interaction with KZK corrections (Ewald + ΔKZK) at rs = 1.336, the Ewald interaction with Chiesa corrections for the kinetic and potential energies (Ewald + ΔKE + ΔPE) at rs = 1.343 and the modified periodic Coulomb interaction with Chiesa corrections for the kinetic energy only (MPC + ΔKE) at rs = 1.335, demonstrates the effectiveness of the twist-averaged KZK approach for correcting FS errors. Energies are in eV per proton.
| N | Ewald + ΔKZK | Ewald + ΔKE + ΔPE | MPC + ΔKE |
|---|---|---|---|
| 64 | −14.2038(8) | −14.3172(9) | −14.2021(9) |
| 96 | −14.2134(6) | −14.2651(5) | −14.1820(5) |
| 128 | −14.2133(4) | −14.2368(4) | −14.1685(4) |
| 144 | −14.2109(4) | −14.2535(4) | −14.1958(4) |
The KZK scheme removes the FS errors in DMC calculations of cubic homogeneous systems exactly by construction. Our systems are neither cubic nor homogeneous, but the KZK approach still works remarkably well. Its use of DFT could be considered a drawback, but it is important to bear in mind that any valid FS-correction method must yield the same total energy in the limit of a large enough simulation cell. The important question is not whether the unattainable limiting value is correct but how rapidly it is reached. For solid H we find that the system-size dependence of the KZK-corrected DMC total energy is noticeably weaker than the system-size dependence of energies corrected using other methods. The KZK-corrected energy also settles down to a system-size-independent constant more quickly than energies corrected using other methods.
The correct combination of TABC and KZK corrections has not previously been described in the literature so we provide a brief explanation here. We write the QMC ground-state energy of the infinite simulation cell as

where

is the twist-averaged DMC energy for a simulation cell of size L and ΔEFSTAV(L) is the required FS correction. This correction is approximated using the formula

where EDFT,LDA(∞) is the DFT energy computed within the LDA using a fully converged k-point mesh (which in this work means 24 × 24 × 24) and

The FS DFT energy, EDFT,FS(L), is obtained from DFT-KZK calculations employing the same simulation cell and twists as our DMC-TABC results. The FS correction, ΔEFSTAV(L), therefore accounts both for the many-body FS errors and for any one-body FS errors not removed by the limited twist averaging employed in the DMC-TABC simulations.
3.3. Band gaps
The quasi-particle band gap is given by

where N,M is the energy of the Mth Kohn–Sham orbital in an N-electron system. The band-gap discontinuity, Δxc = N+1,N+1 − N,N+1, is by definition the energy difference between the highest occupied Kohn–Sham orbital in an (N + 1)-electron system and the lowest unoccupied Kohn–Sham orbital in an N-electron system. The last two terms in equation (18) give the band gap of the N-electron Kohn–Sham system. The non-zero value of Δxc results from the existence of a discontinuous jump [72] in the XC potential Vxc on addition of an electron: Δxc = Vxc,N+1( r) − Vxc,N( r). The lack of explicit position dependence on the left-hand side of this equation indicates that Δxc is a position-independent constant.
Although some of the band-gap underestimation observed in Kohn–Sham DFT calculations is due to the inadequacies of local and semi-local XC functionals such as LDA and PBE, a significant part is due to Δxc. Hybrid functionals such as PBE0 [57], which is formed from PBE by replacing 25% of the semi-local exchange energy by a fully non-local Hartree–Fock-like expression, yield better band gaps for most systems, including solid molecular hydrogen [16], but not necessarily for the right reasons. The GW method described in section 2.2 calculates true quasi-particle energies and yields consistently accurate band gaps for weakly-correlated sp-bonded solids.
In the following, we present the pressure dependence of the band gap of the Cmca-12 phase as calculated using the PBE, PBE0 and GW approximations. To obtain a very simple estimate of the metallization pressure of phase III, we linearly extrapolate the band gap as a function of pressure and look for the pressure at which the gap closes. Figure 1 illustrates band-gap closure in the Cmca-12 phase. The PBE, PBE0 and GW results show that the band gap of Cmca-12 vanishes at 245, 309 and 373 GPa, respectively. The PBE metallization pressure is in agreement with the value estimated by Pickard and Needs [24]. From band-structure calculations we see that the Cmca-12 phase has an indirect band gap; the linear decrease of the band gap with pressure is not unexpected in indirect gap structures and is also reported experimentally [9].

Figure 1. Band gap of the Cmca-12 crystal structure as a function of pressure as calculated using the PBE, PBE0 and GW approximations. The PBE, PBE0 and GW results show that the band gap of Cmca-12 vanishes at 245, 309 and 373 GPa, respectively.
Download figure:
Standard image High-resolution imageAs usual, band gaps calculated using the semi-local PBE functional are much too small. A significant contributor to this band-gap underestimation is the inability of any analytic functional of the density to represent the discontinuous change in XC potential that occurs as a single electron is added to a system with a filled band [72]. By including a fraction of the exact non-local orbital dependent exchange energy, the PBE0 hybrid functional circumvents this problem to some extent. However, even the PBE0 band gap is considerably smaller than the GW band gap, which is expected to be more accurate.
Our GW results show that the band gaps of the P63/m, C2/c and Cmca-12 structures vanish at the static pressures of 446, 398 and 373 GPa, respectively. Semilocal DFT, hybrid-DFT [20] and GW calculations all show that P63/m has the largest band gap and, consequently, the largest metallization pressure of the three insulating structures considered. The GW indirect band gap and its pressure dependence agree very well with recently reported experimental results [73].
The agreement with experiment is gratifying but could be misleading, since the large ZP fluctuations of the proton positions in solid H may reduce the band gap significantly. Indeed, Morales et al [74] recently investigated the influence of ZP motion on the DFT band gap of solid hydrogen and observed a dramatic reduction. Their paper did not provide details of the method used, but it was probably as described in [75]. Unfortunately, as Morales et al point out, their results disagree with experiment, for reasons that remain unclear. A similar approach could in principle be applied to the GW band gap of solid H, but the computational cost would be very high.
3.4. Static DMC phase diagram
In the following, we present enthalpy-pressure diagrams obtained from DMC simulations at the static level of theory, which ignores proton ZPE. Calculating the pressure accurately in DMC is difficult. However, we note that the enthalpy H(P) is related to E(V ) via a Legendre transformation,

where the equilibrium volume Veq(P) minimizes the right-hand side at fixed P. Hence, if we choose a pressure P and evaluate the quantity H(P,V ) = E(V ) + PV at an approximate volume V =Veq(P) + ΔV , we obtain

The leading contribution to the difference between H(P,V ), which is easy to evaluate, and H(P), which is not, is B(ΔV )2/2nV2 per proton, where B = −V dP/dV =V d2E/dV2 is the bulk modulus of high-pressure hydrogen [76, 77] and n is the number of protons per unit volume. In practice, we set V to the DFT volume, VDFT(P). Since DFT volumes are normally quite accurate, we estimate that ΔV/V ≃3%. By plotting P as a function of V , one finds that −dP/dV ≃4 GPa a−30 at 300 GPa. The volume of a unit cell containing 16 protons at this pressure is approximately 159 a30. The error in the enthalpy is thus approximately 3 meV per proton.
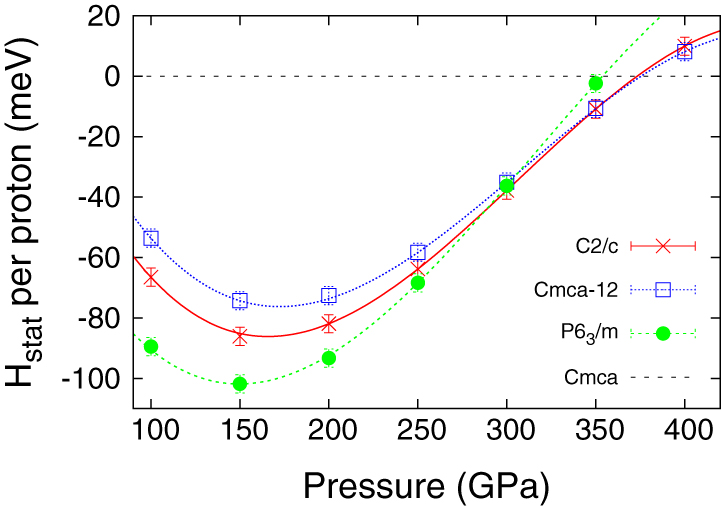
Figure 2 illustrates Hstat as a function of pressure. The static lattice enthalpies of three different insulating crystal structures are shown relative to the enthalpy of the metallic Cmca structure. Within the static approximation, the P63/m structure is the most stable up to a pressure of approximately 250 GPa, but is less stable than both C2/c and Cmca-12 by 350 GPa. The error bars make it difficult to establish exactly where the transition from P63/m to C2/c or Cmca-12 takes place or to say which of C2/c or Cmca-12 is favoured. The transition from C2/c or Cmca-12 to the metallic Cmca phase happens around 375 GPa.

Figure 2. Enthalpy as a function of pressure calculated using the DMC-TABC method in the static approximation. The static lattice enthalpies of three different insulating crystal structures are reported relative to the enthalpy of the metallic Cmca structure. The metallization occurs via a transition from the zero band-gap Cmca-12 structure to the metallic Cmca structure at around 375 GPa.
Download figure:
Standard image High-resolution imageThus, within the static approximation, DMC predicts that the hcp P63/m structure is more stable than the other structures investigated over the entire pressure range at which phases I and II exist experimentally, and that it remains more stable well above the measured transition to phase III. As already discussed above, recent x-ray results [14] at pressures up to 183 GPa suggest that hcp symmetry is a strong candidate not only for phase II but also for phase III.
We claim that our static DMC phase diagram is much more accurate than the static DFT phase diagram. One reason is the importance of vdW interactions between hydrogen molecules, which significantly influence the phase diagram, especially at low densities. QMC calculations have recently shown that the vdW interaction has a substantial effect on the transition pressures between the crystalline phases of ice at high pressure [40] and one would expect them to matter even more in solid molecular hydrogen. An important consequence is that transition pressures obtained from standard DFT functionals, which neglect vdW forces, are likely to be unreliable. Because of this recognition, some very recent work [74, 78] has used vdW density functionals to study solid and liquid H. There is no need to emphasize that DMC provides a highly accurate description of exchange and correlation in relatively weakly correlated materials and that it includes an excellent quantitative treatment of vdW forces.
Combining our static DMC phase diagram and GW results suggests: (a) that the well known rule of thumb 'the lower the energy the wider the gap' [79] is valid here (with the word 'energy' replaced by 'enthalpy'); and (b) that metallization occurs via a transition from the zero band-gap Cmca-12 structure to the metallic Cmca structure at around 375 GPa. The agreement between the pressure at which the GW band gap of the Cmca-12 structure closes and the pressure at which DMC predicts a phase transition from Cmca-12 to the metallic Cmca structure is remarkable but fortuitous, since including the effects of phonon ZPE changes the picture.
3.5. Dynamic DMC phase diagram
The above scenario is based on the static approximation. In reality, even in the ground state, H2 molecules are quantum oscillators with a natural frequency of ∼ 1014 Hz (for the H–H bond stretching) and a ZPE of several hundred meV per atom. Following standard practice in the field, our treatment of ZPE uses the harmonic approximation.
Estimating the ZPE within the harmonic approximation is feasible and was until recently believed to produce accurate results for molecular solid hydrogen [24]. A few months ago, however, Morales et al [74] published a paper reporting the results of DFT-based path-integral molecular dynamics simulations of solid hydrogen beyond the harmonic approximation. The quasi-harmonic and fully anharmonic total energies agreed well at high temperature but began to differ below about 300 K. At 200 K, the error in the quasi-harmonic energy had grown to approximately 8 meV per proton for the Cmca-12 phase at ∼ 265 GPa. Path-integral molecular dynamics simulations become more difficult as the temperature decreases, so temperatures lower than 200 K were inaccessible.
The quasi-harmonic energy was seen to be only weakly dependent on temperature below 300 K because the vibrational modes were frozen out, but the anharmonic energy continued decreasing almost linearly down to 200 K. The specific heat of kB/2 per atom was consistent with the assumption that every H2 molecule was acting as a free quantum rotor at a temperature well above the rotational energy level spacing. To estimate the anharmonic ZPE it was necessary to extrapolate the path-integral molecular dynamics results from T = 200 to 0 K. This extrapolation was carried out on the assumption that the hydrogen molecules continued to act like free quantum rotors. The difference between the quasi-harmonic ZPE and the extrapolated anharmonic ZPE was more than 20 meV per proton.
This surprisingly large difference is probably an overestimate. It is clear from the data that the molecules behave like free rotors at 200 K. However, since the Cmca-12 structure is orientationally ordered, the molecules must in fact be rotating in a shallow potential well. This implies the existence of a temperature between 200 and 0 K below which the effects of the potential well become important and the rotational modes begin to freeze out. This freezing temperature is lower than predicted by the quasi-harmonic approximation but probably higher than the freezing temperature of a free rotor as determined by its moment of inertia alone. All we can say for sure is that the difference between the harmonic ZPE and the anharmonic ZPE is between 8 and 20 meV per proton. A more relevant question is how the anharmonicity affects the relative stabilities of different crystal structures. According to Morales et al [74], the anharmonic contributions to energy and enthalpy differences are of order 5–10 meV per proton. This may also be an overestimate.
Another issue is the limited accuracy of DFT. We showed recently [28] that the quasi-harmonic ZPE depends on the choice of XC functional, increasing by up to 20 meV per proton as the functional is changed from LDA to PBE to Becke–Lee–Yang–Parr. The dependence of energy differences on functional is considerably smaller, but it remains unclear whether DFT is accurate enough to provide reliable results. The neglect of the fermionic nature of the protons may also be problematic.
It is clear that further work is required to assess the effects of the quasi-harmonic approximation, the choice of XC functional, and the neglect of the quantum statistics of the protons on calculations of the ZPE of solid molecular hydrogen. It may prove necessary to go beyond DFT and carry out DMC simulations with both electrons and ions treated quantum mechanically. This is possible in principle, although the computational cost would be enormous. For this work we use quasi-harmonic ZPEs calculated within DFT. Reassuringly, although errors at the 10 meV level change calculated transition pressures significantly, they are unlikely to change the qualitative structure of the phase diagram. Ignoring the ZPE altogether introduces much larger quantitative errors, but a comparison of figures 2 and 3 shows that this too leaves the qualitative structure of the DFT phase diagram more or less intact.

Figure 3. Enthalpy as a function of pressure calculated using the DMC-TABC method in the dynamic approximation. The quasi-harmonic proton ZPE was calculated using DFT. The dynamic lattice enthalpies of three different insulating crystal structures are reported relative to the enthalpy of the metallic Cmca structure. The P63/m, C2/c, Cmca-12 and Cmca phases are stable in the pressure ranges <220, 220–360, 360–430 and >430 GPa, respectively
Download figure:
Standard image High-resolution image
The quasi-harmonic ZPE was obtained from phonon frequencies calculated using density functional perturbation theory as implemented in Quantum Espresso [46]. The ZPE per proton was estimated as  , where
  . Here Nmode and N q are the number of vibrational modes in the unit cell and the number of phonon wave vectors q, respectively, ωi( q) is the angular frequency of the phonon in band i with wave vector q and the summation over q includes all k-points on a 2 × 2 × 2 grid in the Brillouin zone. McMahon [25] demonstrated that a q-point grid of this density is sufficient to converge ZPE differences between structures to within a few percent.
In agreement with previous DFT results [24] we find that the ZPE is large, structure dependent, and density dependent, ranging from 257 meV per proton at low density to 351 meV per proton at high density. The P63/m structure has the largest and the Cmca structure the smallest ZPE over the whole range of pressures considered. The C2/c and Cmca-12 structures have almost the same ZPE, which lies between the P63/m and Cmca values.
By defining Hdyn = Edyn + PV , where Edyn = Estat + ZPE, we obtain the dynamic phase diagram of solid molecular hydrogen illustrated in figure 3. The dynamic lattice enthalpies of three different insulating crystal structures are shown relative to the enthalpy of the metallic Cmca structure. Bearing in mind the statistical error bars, we see that P63/m is the most stable phase up to a pressure of approximately 220 GPa. This is in good agreement with experimental results [14]. As discussed above, because of the tiny enthalpy difference between the C2/c and Cmca-12 phases, it is difficult to determine their pressure stability ranges accurately. However, we are able to conclude that we expect to observe the following structural transitions with increasing pressure: P63/m →C2/c → Cmca-12 →Cmca.
Comparing the static and dynamic results, we see that the proton ZPE has two main effects. Firstly, although the order in which the phases appear with increasing pressure is unaffected, their enthalpies and regions of stability change. If we were to take an optimistic view and ignore the error bars, we would say that P63/m, C2/c, Cmca-12 and Cmca phases are now stable in the pressure ranges <220, 220–360, 360–430 and >430 GPa, respectively. As in the static case, however, the statistical and systematic errors make it difficult to discriminate between the C2/c and Cmca-12 structures over a wide range of pressures, this time from 300 to approximately 450 GPa. Secondly, the inclusion of ZPE increases the pressure of the transition to the metallic Cmca phase by 14%, which is close to the 10% increase previously reported [16].
Note that the static GW band gap still closes before the transition to the Cmca structure takes place. This leaves a region of 20–30 GPa where the Cmca-12 phase persists but is no longer insulating in the static approximation.
A comparison of the densities of different structures at the same pressure shows that, in phases II and III: density(Cmca) > density(Cmca-12) > density(C2/c) > density(P63/m). As the pressure is increased, the PV term in the enthalpy rises faster for the low-density insulating phases than for the metallic phase, reducing the relative stability of the insulating phases and leading eventually to the metal–insulator transition. The difference between the densities of the insulating phases and the metallic Cmca phase reduces at high pressure, especially in the case of the Cmca-12 structure.
The differences between the DMC and DFT phase diagrams are primarily due to the internal energy term in the enthalpy. The ZPE contributions to the pressure are quite small and have no significant effect on the PV term. For pressures up to 220 GPa, the DMC energy of the low density P63/m phase lies further below the energies of the other phases, especially the high-density metallic Cmca phase, than does the DFT energy. Our results, at both the static and dynamic levels, predict that the P63/m phase is the most stable of the structures considered for a large range of pressures up to 220 GPa in the dynamic case or 280 GPa in the static case. This prediction is consistent with the latest low temperature x-ray powder-diffraction results [14], which indicate that the hydrogen molecules in phases II and III are still in a hexagonal structure and that phase III remains hexagonal up to the maximum experimental pressure of 183 GPa. The nature of the difference between phases II and III remains to be established, but may be related to a classical orientational ordering of the H2 molecules [80].
4. Conclusion
In conclusion, we have used DMC simulations to study the phase diagram of the four most stable structures of high pressure hydrogen found from DFT calculations. We accurately computed the FS corrections by combining the use of TABC with the DFT-KZK method. We also carried out GW calculations to find the metallization pressure. Our GW results show that the band gap of the insulating Cmca-12 phase closes at 373 GPa, whilst our DMC simulations in the dynamic approximation show that the Cmca-12 structure may remain stable up to 430 GPa, at which point it transforms to the metallic Cmca phase. We propose that the semimetallic state observed experimentally at around 360 GPa [15] may correspond to the Cmca-12 structure near the pressure at which the band gap closes. At high pressures our DMC results are in qualitative agreement with previous DFT calculations [24], and suggest that the metallization of solid molecular hydrogen happens through the transformation of the Cmca-12 phase to the Cmca structure. Our DMC results indicate that the hcp structure P63/m, which has the lowest density and the largest band gap of the phases considered, is the most stable molecular structure up to 220 GPa.
Acknowledgments
We acknowledge interesting and helpful discussions with Richard Needs and Chris Pickard. This work was supported by the UK Engineering and Physical Sciences Research Council under grant EP/I030190/1, and made use of computing facilities provided by HECToR, the UK national super-computing service, and by the Imperial College London High Performance Computing Centre. We acknowledge support from the Thomas Young Centre under grant TYC-101.