

Abstract
We employed the top-seeded infiltration-growth (IG) process for the fabrication of bulk (Y, Gd)Ba2Cu3Oy (YG-123) superconductors by varying the composition of (Y, Gd)2BaCuO5 (YG-211) and compared with bulk YBa2Cu3Oy (Y-123) superconductors grown under similar conditions. IG-processed YG-123 exhibited Jc (77 K) of 4.78 × 10⁴ A cm−2 in zero field, which was higher than the value of 3.71 × 10⁴ A cm−2 for Y-123. The superconducting transition temperature (Tc) of YG-123 increased with increasing Gd content. However, there was spatial variation in the superconducting properties of IG-processed YG-123 samples due to the inhomogeneous distribution of YG-211. Jc values of YG-123 decreased when increasing the distance from the seed both along the a and c-axis directions. The scaling studies of the pinning behavior for YG-123 showed that non-superconducting YG-211 particles act as effective pinning centers, supported by the fact that δTc type pinning is active in the system.
Export citation and abstract BibTeX RIS

Original content from this work may be used under the terms of the Creative Commons Attribution 3.0 licence. Any further distribution of this work must maintain attribution to the author(s) and the title of the work, journal citation and DOI.
1. Introduction
The top-seeded infiltration-growth (IG) process of RE-Ba-Cu-O (RE = rare earth elements) is promising for the fabrication of single-grain RE-Ba-Cu-O bulk superconductors with improved superconducting properties. This method has various advantages over top-seeded melt-growth (TSMG) processes of RE-Ba-Cu-O bulk superconductors like enhanced critical current density (Jc). The IG process involves the melting of the liquid phase (BaCuO2 + CuO) and its infiltration into the solid precursor of RE-211 and subsequent formation of RE-123 on slow cooling. During grain growth, the RE-123 phase traps un-reacted RE-211, inhibiting further reaction with the liquid phase, and thus leading to homogeneous nucleation of 123 in the melt [1, 2]. Here further nucleation and growth of RE-123 phase requires RE, Ba and Cu. The amounts of Ba and Cu are plentiful in the liquid; however, RE is deficient since it is supplied by the dissolution of RE ions from the trapped RE-211 particles. Thus, while RE-123 engulfs RE-211 particles, RE-211 particles also dissolve in the RE-123 matrix to allow further growth of the RE-123 phase.
It is known that these trapped RE-211 inclusions act as effective pinning centers [3]. RE-211 particles can be refined by dopants like Pt, PtO2, CeO2. For a constant volume fraction of RE-211 inclusions in the RE-123 matrix, the critical current density is inversely proportional to the size of secondary phase inclusions, and thus Jc can be enhanced by simply decreasing the size of RE-211 inclusions [3]. Until now, IG-processed Y-123 samples showed the highest Jc values as reported by Muralidhar et al [4], where ball-milled Y-211 inclusions of ∼nm size were used as the precursor.
It is also interesting to note that RE-Ba-Cu-O superconductors with more than one RE element have shown higher critical current density [5–11] due to local compositional fluctuations. These disordered regions can also act as effective pinning centers for flux lines [12]. The presence of the RE-Ba solution leads to a so-called peak effect [13] and enhanced Jc [14] in mixed RE-123 superconductors. Ternary RE-123 superconductors like (Nd0.33, Eu0.33, Gd0.33)Ba2Cu3Oy have revealed eminent peak effects and enhanced critical current densities along with very high irreversibility fields [15, 16].
In this work, we have synthesized (Y, Gd)Ba2Cu3Oy (YG-123) bulk superconductors with the top-seeded IG process by varying the ratio of Y2BaCuO5 (Y-211): Gd2BaCuO5 (Gd-211) to study the effect of the ratio of Y/Gd on the microstructure and the superconducting properties.
2. Experimental details
To prepare Y-211 and Gd-211, high purity commercial powders of Y2O3, Gd2O3, BaO2 and CuO were mixed in a nominal composition of Y2BaCuO5 and Gd2BaCuO5 and calcined three times at 840, 870 and 890 °C for 12 h. In parallel, powders of BaCuO2, BaO and CuO were also mixed in a nominal composition of Ba3Cu5O8 (Y-035). It should be noted that any refinement of Y-211 and Gd-211 powders were not performed by adding Pt, PtO2 or CeO2 in this study. The calcined powders of Y-211 and Gd-211 of μm order were then mixed in different ratios and ground for 1 h, and then pellets of 20 mm diameter were made using powders of Y-211 + Gd-211 (YG-211) with different Y/Gd contents in the total weight. Similarly, Y-035 and Y-123 were mixed in the ratio of 1:1 by weight to prepare liquid + Y-123 pellets which served as a liquid source during the IG process. The green pellet of the solid precursor having YG-211 was then placed on the liquid-source pellet. Three samples were made with the solid precursor having Y-211:Gd-211 ratios of 80:20, 75:25 and 70:30 respectively. For a comparative study, the sample with Y-211:Gd-211 = 100:0 was also grown with the top-seeded IG process. Thus, four solid precursors of YG-211 were placed on the liquid-source pellet as shown in the arrangement in figure 1(a). Then a Nd-123 seed was positioned on the top center of the solid precursor for the growth of single-domain bulk. A Y2O3 powder plate and a MgO single crystalline sheet were placed at the bottom. The whole arrangement was set up on an alumina plate [4, 17, 18]. The specifications of IG-processed YG-123 samples are listed in table 1.
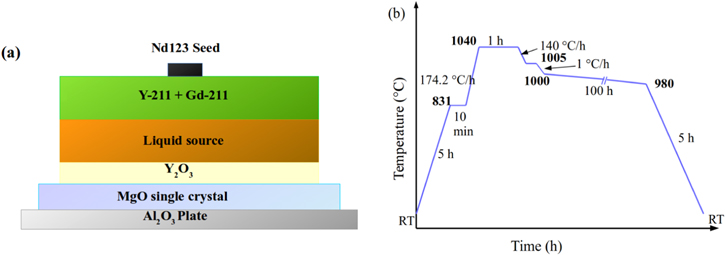
Figure 1. (a) Sample arrangement for the top-seeded IG process, where a pellet of solid precursor containing Y-211 and Gd-211 in different wt% ratio is kept on top of liquid source pellet (Y-123 + Y-035) further kept on Y2O3 and on a layer of MgO and alumina plate. A seed crystal of Nd-123 is positioned on top. (b) Heat treatment schedule program.
Download figure:
Standard image High-resolution imageTable 1. Specifications of YG-123 samples made by top-seeded IG technique.
| Sample | Y-211:Gd-211 (wt %) | Y-211 + Gd-211 (g) | Liquid source (g) | Liquid support (g) |
|---|---|---|---|---|
| Y100 | 100:0 | 6 | 6 | 0.8 |
| Y80Gd20 | 80:20 | 6 | 6 | 0.8 |
| Y75Gd25 | 75:25 | 6 | 6 | 0.8 |
| Y70Gd30 | 70:30 | 6 | 6 | 0.8 |
The heating schedule for the IG process is given in figure 1(b). Although the Tp of different rare earth superconductors varies, we kept the temperature profile the same for all three samples and similar to YBCO because we wanted to keep all the process parameters the same as the Gd-211 content is in small amount (20–30 wt% variation) compared to Y-211 in the solid preform. The assembly of YG-211 on a liquid-source pellet with a seed crystal on top was placed at the center of the furnace, heated to 830 °C in 5 h and held there for 10 min, then again heated in 1.2 h to a temperature of 1040 °C and held for 1 h for the formation of a Y-035 melt such that sufficient melt infiltrated into the YG-211 precursor. Then the temperature was lowered for 15 min to 1005 °C and then to 1000 °C in 5 min, then subjected to slow cooling with a rate of 0.2 °C h−1 to a temperature of 980 °C and then to 100 °C in 5 h; finally, the furnace was left to cool down to room temperature. The IG-processed YG-123 samples were annealed at 450 °C for 250 h in flowing pure O2 gas to impart superconducting properties.
The microstructures of these samples were studied with a field emission scanning electron microscope (FESEM). For these observations, the sample surface was mechanically polished using 3 M lapping papers with different grades down to 0.3 μm. For magnetic measurements, small test samples 1.5 × 1.8 × 0.5 mm3 in dimension were cut from the bulk samples (about ∼1 mm below the seed along the c-axis). Measurements of the transition temperature (Tc) and magnetization loops (M versus H) in fields from −1 to 5 T were performed at 77 K using a commercial SQUID magnetometer (Quantum design, Model MPMS5). Critical currents were estimated using the extended Bean's model [19, 20] for a rectangular sample which is given by

where d is the sample thickness along c-axis, a, b are cross-sectional dimensions with b ≥ a, and Δm is the difference of magnetic moments during increasing and decreasing fields in the M–Ha loop [19–21].
3. Results and discussions
3.1. Superconducting properties of IG-processed YG-123 samples
All the samples have been grown keeping all process parameters the same. Please remember that bulk YG-123 is, in fact, the composite of YG-123 and YG-211. The temperature dependence of dc magnetic susceptibility was measured for all the bulk YG-123 samples (Y80Gd20, Y75Gd25 and Y70Gd30) and compared with the sample Y-123 having only Y-211 inclusions (Y100). Note that the YG-211 particles in the present study are not treated with any grain refining additives like Pt, CeO2, or PtO2 [22–25].
Figure 2(a) shows the temperature dependence of normalized dc magnetic susceptibility in the presence of 10 Oe for all the four samples. It is clear from the figure that the superconducting transition temperature Tc3 and transition width ΔTc4 are different for all four samples, although they all show a sharp transition. The samples Y70Gd30 and Y75Gd25 show high onset Tc5 to the value of 91.9 K, while the sample Y80Gd20 shows onset Tc of 91.6 K. These values are higher than 91.5 K which is the onset Tc for the sample Y100.
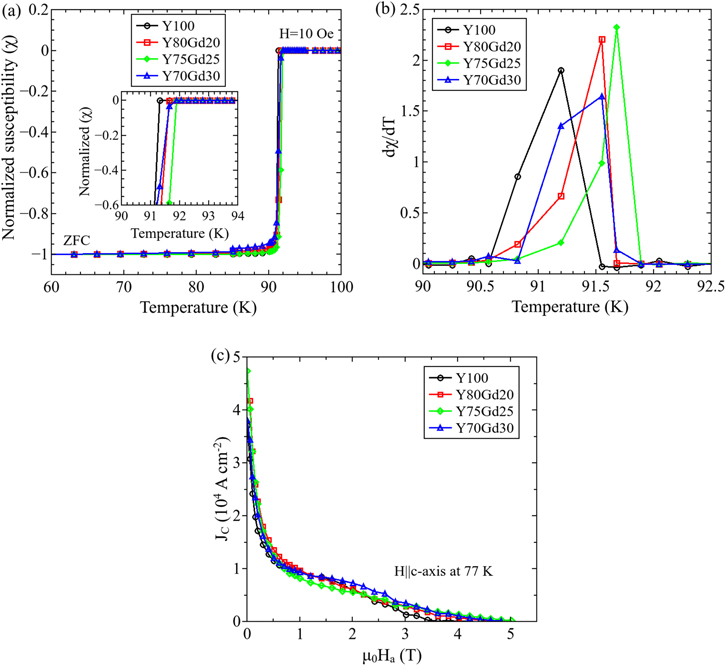
Figure 2. (a) Temperature dependence of dc magnetic susceptibility of bulk YG-123 samples in zero field cooled process. The inset shows the magnified view of superconducting transition for bulk YG-123 samples with different compositions of Y-211 : Gd-211, (b) plot of dχ/dT vs temperature and (c) field dependence of critical current density at 77 K for bulk YG-123 samples with H∣∣c-axis.
Download figure:
Standard image High-resolution imageTable 2 shows the values of the Tc and onset Tc for all four samples. Sample Y100 shows a Tc of 91.2 K which is rather low compared to the 93.2 K reported by M Muralidhar et al [4] where ball-milled Y-211 of nm order size are used. In our samples, as the content of Gd-211 in the precursor is increased, onset Tc values increased (see the inset in figure 2(a)) accompanied by a reduction of ΔTc to 0.22 K as seen in sample Y75Gd25 compared to a ΔTc of 0.52 K in sample Y100 as shown in figure 2(b).
Table 2. Details of the superconducting transition temperature (Tc) for the various YG-123 (IG) processed samples.
| Sample |

|
Tc (K) |
|---|---|---|
| Y100 | 91.5 | 91.2 |
| Y80Gd20 | 91.6 | 91.5 |
| Y75Gd25 | 91.9 | 91.6 |
| Y70Gd30 | 91.9 | 91.5 |
| Y75Gd25 B1 | 91.9 | 91.6 |
| Y75Gd25 B2 | 91.6 | 91.0 |
| Y75Gd25 B3 | 91.0 | 90.8 |
| Y75Gd25 S1 | 91.9 | 91.6 |
| Y75Gd25 S2 | 91.6 | 91.3 |
Figure 2(c) shows Jc—H curves for YG-123 samples with different YG-211 contents at 77 K with field applied parallel to the c-axis calculated from the M-H curves using the extended Bean model formula [19, 20]. The Jc values of sample Y100 at 77 K and 0 T for the H∣∣c-axis was 3.71 × 10⁴ A cm−2, which is relatively high without any treatment of Y-211 particles [26] and is the benefit of the IG process. The Jc at 77 K and 0 T for sample Y75Gd25 showed the highest value of 4.78 × 10⁴ A cm−2 as compared to the values of 3.80 × 10⁴ A cm−2 and 4.18 × 10⁴ A cm−2 for samples Y70Gd30 and Y80Gd20 respectively. However, in intermediate fields for 1.5 to 3 T, sample Y70Gd30 exhibited Jc values higher than those of Y75Gd25 and Y80Gd20. The critical current densities survived until μ0H = 4.03, 4.49, 4.84 and 5.10 T for samples Y100, Y80Gd20, Y70Gd30 and Y75Gd25, respectively. These values correspond to the irreversibility field, Birr (i.e. the field at which Jc = 100 A cm−2), that increased with increasing Gd-211 content due to the higher pinning efficiency of Gd-211 inclusions compared to Y-211. The maximum Birr for Gd-123/Gd-211 composite is reported to be ∼5.5 T at 77 K [27]. Clearly, as the Gd-211 content in the precursor is increased, the Jc values increase. It is notable that top-seeded IG-processed samples exhibit high critical current densities without any refinement of RE-211 particles, unlike TSMG process where the refinement of RE-211 particles with Pt and/or CeO2 additions are required for higher Jc values. Delamare et al [28] and Shi et al [29] have reported Jc values of 5.5 × 10⁴ A cm−2 and 7.2 × 10⁴ A cm−2, respectively, for melt-textured Y-123 and Gd-123 samples with the secondary phase refinement additives.
In order to check the spatial variation of critical current density Jc and superconducting transition temperature Tc throughout the Y75Gd25 sample, we measured the Tc values for the samples cut from various locations as shown in figure 3. Figure 4(a) shows the temperature dependence of normalized dc magnetic susceptibility in the presence of a magnetic field of 10 Oe. Samples B1 and S1 (i.e. the parts cut out from closer to the seed) show a sharp transition with high onset Tc of 91.9 K, while samples B2 and S2 exhibit onset Tc of 91.6 K and sample B3 shows the lowest onset Tc value of 91 K. The values of the transition temperatures are presented in table 2, which shows that there is a spatial variation in Tc throughout the sample ranging from 91 K to 91.9 K, which is a feature of IG-grown samples as also reported by Iida et al [30].
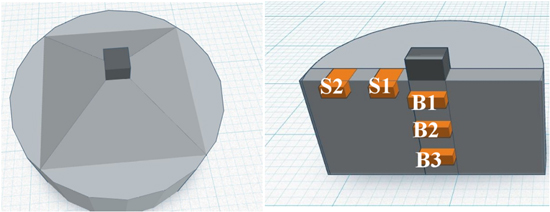
Figure 3. Schematic illustration of the locations from where SQUID samples were cut from the bulk Y75Gd25 sample.
Download figure:
Standard image High-resolution image
Figure 4. (a) Temperature dependence of dc magnetic susceptibility for various locations in the bulk Y75Gd25 sample. The inset shows a magnified view of superconducting transition temperature and (b) field dependence of critical current density for H∣∣c-axis at 77 K for various positions in the bulk Y75Gd25 sample.
Download figure:
Standard image High-resolution imageFigure 4(b) shows the field dependence of Jc values at 77 K for H∣∣c-axis calculated from M-H loops based on the extended Bean model for various positions in the Y75Gd25 sample. The plot shows that B1, B2, B3, S1 and S2 has Jc values of 4.78 × 10⁴, 4.70 × 10⁴, 4.10 × 10⁴, 3.80 × 10⁴ and 3.70 × 10⁴ A cm−2, respectively at 77 K in zero field, indicating that there is also a spatial variation in Jc values in the sample. The Jc values also decreased when increasing the distance from the seed along both directions of a- and c-axes, which is similar to the report by Iida et al [31] in both IG and melt-textured YBCO samples.
In order to clarify the pinning mechanism of the YG-123 samples, we analyzed the global volume pinning forces Fp utilizing the scaling theory [32, 33] where Fp = Jc × Ba from the critical current densities Jc (H,T) and applied field Ba. The peak in the plots of Fp versus μ0 H is Fp,max. We have then plotted Fp/Fp,max versus reduced field h = Ha/Hirr , where Hirr is the irreversibility field. Figures 5(a) and (b) show the plots for the sample Y100 and YG-123 bulk samples. The data were then fitted with a general expression of pinning function [32, 33] :

where the parameters p and q denote the characteristic of pinning in the sample and the peak of the function is given by hmax = p/(p + q). Clearly in figure 5(a), the plot for IG-processed Y-123 with Y-211 in the precursor shows a peak at hmax = 0.33 which gives p = 2 and q = 4 with A = 45.8. Similar values have been reported by J N Li et al for single crystalline YBa2Cu3O7 [34] where both the pinning and shear strength are of comparable level, leading to a higher exponent q value [35]. This suggests that normal and point pinning is active as in melt-processed Y-Ba-Cu-O containing fine Y-211 inclusions [36]. Similarly, hmax = 0.33 has also been reported in TSMG-processed NdBa2 Cu 3O7−δ with p = 1 and q = 2, suggesting that normal and point pinning is active based on small size normal cores [37].
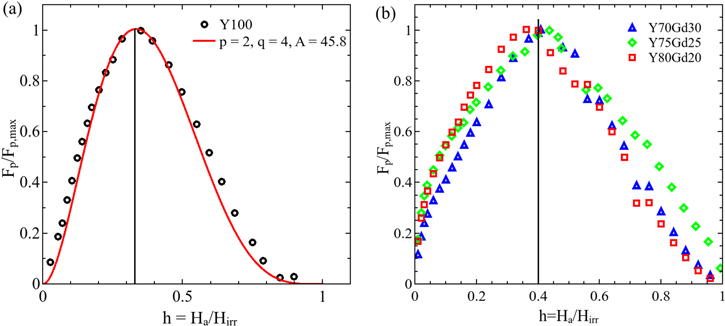
Figure 5. Plot of normalized flux pinning force 'Fp/Fp,max' versus reduced field at 77 K for (a) sample Y100 and (b) samples (YG)-123 i.e. samples Y80Gd20, Y75Gd25 and Y70Gd30. The curve for sample Y100 showed a peak at hmax = 0.33, while samples Y80Gd20, Y75Gd25 and Y70Gd30 showed peaks at hmax = 0.42.
Download figure:
Standard image High-resolution imageFigure 5(b) shows the plots for the samples Y80Gd20, Y75Gd25 and Y70Gd30. The peak position of the samples YG-123 shows hmax = 0.40. Clearly the peak at hmax = 0.40 is similar to reports of 0.48 and 0.42 for single crystals and OCMG-processed Nd-Ba-Cu-O samples [38], and also similar to reports by A K Pradhan et al [39]. Compared to IG-processed Y-123, the Gd-containing YG-123 bulk samples exhibit more effective pinning and hence higher hmax. This also implies that the presence of δTc pinning is active in the sample due to variation in the distribution of YG-211 distribution (compositional fluctuations leading to fluctuations in transition temperature Tc), or this can also occur due to variation in oxygen distribution within the sample.
3.2. Microstructural growth features and its effect on critical current densities
Figure 6(a) shows the FESEM micrograph image of sample Y100 at 2500x magnification. The Y-211 inclusions of micron order are clearly visible and uniformly distributed throughout the Y-123 superconducting matrix. To confirm its chemical composition, energy dispersive x-ray spectroscopy (EDS) point analysis was performed for two different 211 inclusions and found to have the element ratio of Y:Ba:Cu = 2:1:1 as shown in figure 6(b). The FESEM micrographs observed at 2500x magnification for the bulk YG-123 samples are presented in figure 7 along with YG-211 particle size distribution histograms in panels (d)–(f). Micron-sized YG-211 particles (light gray) are distributed almost uniformly in the YG-123 matrix (dark gray). FESEM observations for the bulk samples Y80Gd20, Y75Gd25 and Y70Gd30 suggested that the average size of the YG-211 particles was reduced by increasing Gd-211 content. Table 3(a) contains the volume fraction of YG-211 particles  and the average size of YG-211 particles: d (in μm). Thus, the reduction in YG-211 particle size for the bulk Y80Gd20, Y75Gd25 and Y70Gd30 samples is also evident from table 3(a). Along with the size reduction, the volume fraction of these YG-211 particles also decreased significantly. Similar results have been reported by Hinai et al [40] and also by Iida et al [31] where the volume fraction of Gd-211 particles trapped by Gd-123 matrix decreased when increasing Ba content in the liquid source pellet.
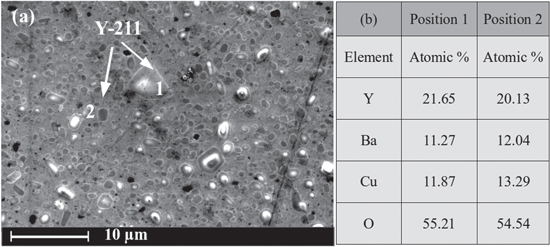
Figure 6. (a) FESEM image obtained for sample Y100 at magnification of 2500x and (b) EDS point elemental analysis data for the various Y-211 particles in Y100 sample.
Download figure:
Standard image High-resolution image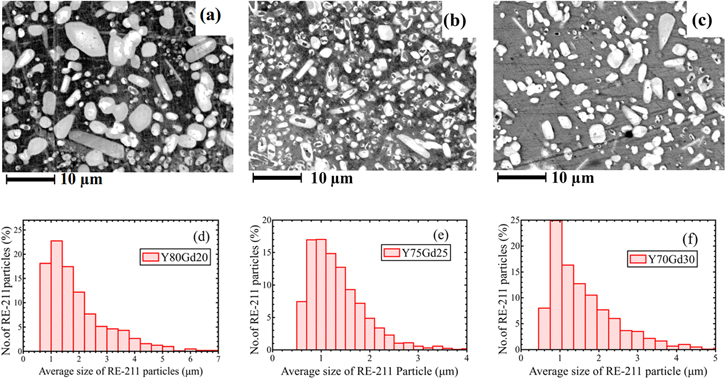
Figure 7. FESEM images at high magnification of 2500x are shown in (a)–(c) for samples Y80Gd20, Y75Gd25 and Y70Gd30. The particle size histogram of (YG)-211 particles are obtained from images (a)–(c) and are shown in panels in (d)–(f).
Download figure:
Standard image High-resolution imageTable 3. Details of the percentage volume fraction and YG-211 particle size from the FESEM microstructure analysis.
| Sample |
 (%) (%) |
Size d (μm) |
 (μm−1) (μm−1) |
|
| (a) | Y80Gd20 | 39.14 | 1.90 | 20.60 |
| Y75Gd25 | 34.59 | 1.65 | 20.96 | |
| Y70Gd30 | 32.69 | 1.57 | 20.90 | |
| (b) | Y75Gd25 B1 | 34.59 | 1.65 | 20.96 |
| Y75Gd25 B2 | 30.44 | 1.55 | 19.64 | |
| Y75Gd25 B3 | 20.19 | 1.28 | 15.77 | |
| Y75Gd25 S1 | 31.08 | 1.41 | 22.04 | |
| Y75Gd25 S2 | 29.49 | 1.33 | 22.17 | |
The IG process does not involve the peritectic decomposition of RE-123 to RE-211. Instead, it involves the infiltration of the liquid phase into the solid RE-211 precursor and subsequent solidification in the presence of a continuous supply of the liquid, leading to the formation of the RE-123 phase. The growth of the RE-123 phase continues with the supply of RE ions from the RE-211 particles in the RE-123 matrix through peritectic temperature Tp and thus RE-211 dissolves while excess RE-211 is trapped in the matrix [41]. The peritectic solidification of RE-123 while slow cooling from RE-211 can be understood via three steps: (a) growth of faceted 123 crystals, (b) melting of 211 particles in liquid and (c) solute diffusion in liquid [42]. The RE-211 in the presence of excess liquid (BaCuO2 + CuO) transforms into RE-123 along the liquidus lines of RE (Y, Gd) in Ba3Cu5O8 melt in air [43]. On slow cooling from Tp, the growing RE-123 will trap the RE-211 in liquid matrix according to the reaction: RE-211 + L → RE-123 + L. Thus, the RE-123 phase precipitates, the liquid becomes RE deficient and the required RE flux is provided by the simultaneous dissolution of RE-211 particles. The growth front thus not only dissolves the RE-211 particles but also traps RE-211 particles within 123 matrix depending upon the dissolution rate of RE-211 particles and rate of growth of the RE-123 matrix. This can also be understood in terms of the fact that the RE solute diffusion occurs from composition difference at the liquid RE-211 and liquid RE-123 interface and is also related to the growth rate of RE-123 phase [44]. Since RE-211 particles dissolve in liquid to form RE-123, each RE-211 particle thus becomes smaller according to the amount of RE-211 being used up [45]. Krauns et al [43] give the liquidus lines of Y and Gd in Ba3Cu5O8 where transformation of RE-211 + L into RE-123 + L occurs at temperature of 1005 °C for Y and at 1045 °C for Gd. Thus Gd has higher Tp, and they have also shown that the enthalpy of dissolution for RE-211 compounds is higher for Gd-211 than Y-211. Therefore, during the heat treatment schedule when all the liquid has melted during the first stage at 1040 °C, the Gd-211 particles with higher Tp start to be consumed before Y-211 with lower Tp and form Gd-123 with the required Gd flux being provided by the Gd-211 inclusions present in the precursor. The growth rate is thus defined by the diffusion rate of RE ions and the more soluble the element is, the faster is the growth process [46]. For sample Y80Gd20 where the content of Gd-211 is less than Y70Gd30, the growth rate is initially smaller until the temperature reaches 1005 °C. Below this temperature, Y-211 starts to dissolve. So, a variation in the distribution of YG-211 particle size can be observed, and it decreases with increasing Gd-211 content. Hence sample Y70Gd30 has smaller sized YG-211 particles due to a higher growth rate above 1005 °C. As a result, the size of YG-211 particles of Y80Gd20 is larger than Y70Gd30, as can also be seen from table 3(a).
Figure 8 shows the plot of critical current density Jc at μ0 H = 0.2 T and 77 K for samples Y80Gd20, Y75Gd25 and Y70Gd30 against the ratio of volume fraction and an average size of YG-211 particles. This plot shows that Jc linearly varies as  as has been reported by Murakami et al [3].

Figure 8. The dependence of critical current density on the ratio of volume percentage of YG-211 particles to size of YG-211 particles for the samples Y80Gd20, Y75Gd25 and Y70Gd30.
Download figure:
Standard image High-resolution imageFigure 9 shows the FESEM microstructure of various positions (as shown in figure 3) in sample Y75Gd25 at a magnification of 2500x. Table 3(b) shows the volume fraction and average size of YG-211 particles for the various positions in the sample. From the tabulated values and histograms in figures 9(f)–(j), one can clearly see that the average size of 211 inclusions decreased as the distance from the seed increased along both a- and c-axis directions. However, Ouerghi et al [47] have reported an increase of RE-211 particle size as we proceed away from seed due to Ostwald ripening [48], whereby larger sized 211 particles are found at the edges of the sample [49–51]. A decrease in the particle size can well be described by pushing/trapping theory [44, 49, 52, 53], which was however proposed for non-reactive inclusions, but since the 211 particles are consumed during the growth of the 123 phase, the smaller particles pushed out are accumulated near the edges. In addition, these particles are bound to become more smaller due to self-decomposition as the growth front proceeds in both the a-axis and c-axis from the seed crystal [52]. From table 3(b), we can see that the volume fraction of YG-211 particles decreases along both the a- and c-axis directions by increasing the distance from the seed crystal, which is not consistent with the pushing/trapping theory where more RE-211 particles will be pushed away from the seed, and the volume fraction should increase. K Iida et al [31] has reported an increase in  with distance from the seed in IG-processed Gd-123 system. Diko et al [54] have also reported a similar increase in
  in melt-grown REBa2Cu3Oy. Similar reports were also reported by Endo et al [55] and for nanocomposite inclusions in REBCO by N Hari Babu et al [56]. However, contradictory to all these reports, our samples show a decrease in volume fraction which can be due to the fact that the YG-211 particles being pushed out should also dissolve at the growing 123 front to provide the necessary RE ion flux, thus leading to a significant decrease in volume fraction as proposed by Chow et al [57]. When we treat the trapping/pushing phenomenon, many factors should be taken into account since the RE-211 inclusions are reactive in nature. The slow dissolution of RE-211 particles leads to a reduced volume fraction, which is evident from the histograms of YG-211 particle size distribution in figures 11(f)–(j).
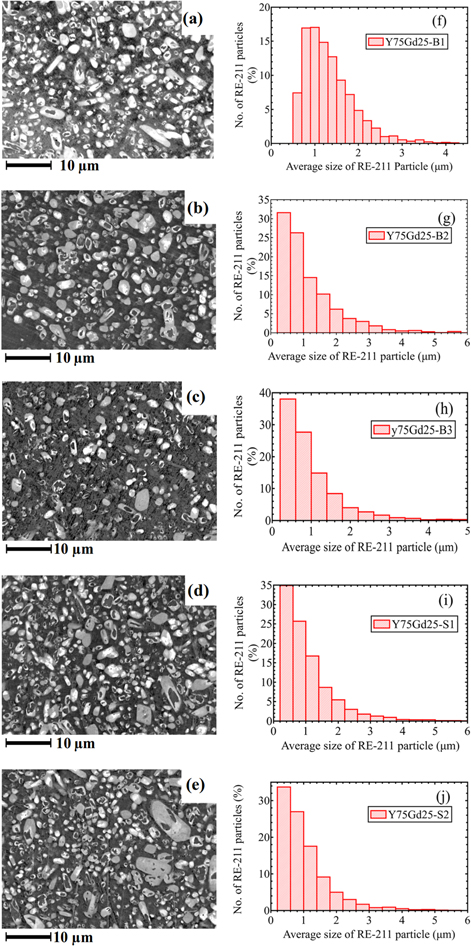
Figure 9. FESEM images at high magnification 2500x are shown in (a)–(e) for positions B1, B2, B3, S1 and S2 in bulk Y75Gd25 sample. The particle size histogram of YG-211 particles are obtained from images (a)–(e) and are shown in panels (f)–(j).
Download figure:
Standard image High-resolution imageFigure 10(a) shows the plot of Jc at T = 77 K and H = 0.2 T versus volume fraction of YG-211 particles for various positions along the c-axis in the sample Y75Gd25. It is evident from the plot that Jc increased with the volume fraction of YG-211 particles in the presence of a magnetic field, which has also been reported in REBCO system by N Hari Babu et al [56]. Figure 10(b) shows the plot of Jc versus the ratio of volume fraction and the average size of YG-211 inclusions for the same sample Y75Gd25. This is also in good agreement with the linear relationship between critical current density and the ratio of volume fraction to the average size of 211 particles, as already established by Murakami et al [3].

Figure 10. Plots of critical current density versus (a) volume fraction of YG-211 particles, and (b) ratio of percentage volume fraction and size of YG-211 particles for the positions of B1, B2 and B3 in bulk Y75Gd25 sample along the c-axis from the seed crystal.
Download figure:
Standard image High-resolution imageThe EDS analysis was also carried out for the sample Y75Gd25. A very interesting feature has been observed in these YG-211 inclusions; namely, that these inclusions show a core-like feature which by elemental mapping (under a magnification of 15 000x) has been confirmed to be yttrium rich core. Figures 11(a) and (b) show the EDS point elemental analysis of three different points within the same YG-211 particle showing that it contains different concentrations of Y:Gd. This core is almost present in every YG-211 inclusion in the matrix.

Figure 11. (a) EDS mapping of YG-211 particle in sample Y75Gd25 at 15 000x magnification showing the variation in concentration of Y and Gd in the YG-211 inclusion and (b) point elemental EDS data for three different positions within the same YG-211 inclusion.
Download figure:
Standard image High-resolution image3.3. Raman scattering spectrum
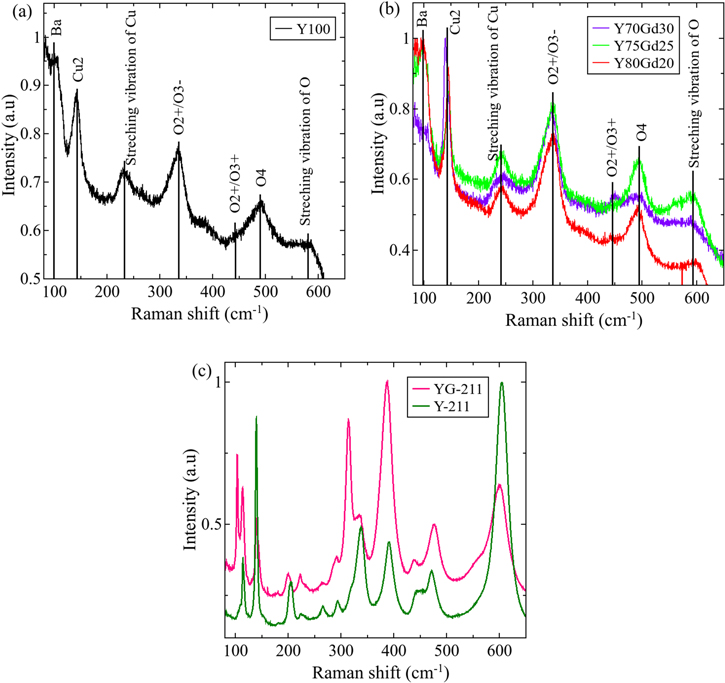
Figure 12(a) shows the Raman scattering spectrum of an IG-processed Y-123 sample, i.e. for sample Y100, where 140 cm−1 is assigned to CuO2-plane copper in-phase mode (Cu2), 334 cm−1 (B1g) mode is CuO2-plane oxygen out of phase mode (O2+/O3−) and Ag mode near 452 cm−1 is the CuO2-plane oxygen in-phase mode (O2+/O3+) [58, 59]. These modes do not depend on oxygen content or cation stoichiometry. The 500 cm−1 is the apical oxygen mode (O4) associated with the stretching of the CuO bond along the c-axis and is highly dependent on the oxygen content of the sample [60]. The position of 500 cm−1 mode shifts to 475 cm−1 in tetragonal phase [61]. It varies from 492 to 502 cm−1 for an oxygen content of 6.2 to 7.0 [62]. Information regarding grain alignment is inferred from the intensity ratio of apical oxygen (O4) mode and O2+/O3− mode [61]. The mode at 118 cm−1 is due to Ba atoms. In addition to these modes, two more modes at 248 cm−1 and 596 cm−1 are observed [58], which are assigned to stretching vibrations of copper and oxygen atoms at the end of short chain fragments [63]. Other secondary phase peaks may also appear due to the presence of Y2BaCuO5 [64]. The peak at 300 cm−1 is due to CuO [65], and the peaks at 592 cm−1, 563 cm−1 and 633 cm−1 are due to Ba2Cu3O5.9, Ba2CuO3 and BaCuO2, respectively [66].
Figure 12. Raman spectra for (a) Y100, (b) Y80Gd20, Y75Gd25 and Y70Gd30 and (c) Y-211 inclusion in Y100 and YG-211 inclusion in YG-123 samples.
Download figure:
Standard image High-resolution image
Frequencies of intrinsic Raman modes of REBa2Cu3O7 (RE = Y, Gd) are slightly dependent on ionic radii of rare earth elements (Y, Gd) [67]. However, 452 cm−1 mode of O2+/O3 + and Cu2 mode at 150 cm−1 show no variation with ionic radii in YBa2Cu3O7 and GdBa2Cu3O7. Raman spectra of (Y, Gd)Ba2Cu3O7 are the same as those of other RE-123 superconducting samples. Our IG-processed bulk YG-123 samples show a similar spectrum to Y-123.
Figure 12(b) shows the Raman scattering spectrum of YG-123 bulk samples produced by the IG method. A similar spectrum has also been reported for TSMG-processed bulk Y-123 samples by Delorme et al [68]. The position of O4 mode between 491 and 500 cm−1 signifies that these YG-123 are in their orthorhombic (superconducting) phase.
Figure 12(c) shows the Raman spectrum of the Y-211 and YG-211 inclusions in Y-123 and YG-123 bulk IG-processed samples respectively. The peaks with ω > 300 cm−1 belong to oxygen vibrations [64]. Both the spectra are almost similar and the peak positions match with the modes of Y-211 and Gd-211 as given by Abrashev et al [64]. Jin et al [59] have also reported the similar spectrum of (Y,Gd)BCO thin film samples as our IG-processed YG-123 spectrum. Since both the O2+/O3− and O4 modes are present in the spectrum of YG-123, we can conclude that our IG-processed YG-123 samples have both a-axis as well as c-axis oriented grains.
4. Conclusions
We have successfully grown (Y, Gd)Ba2Cu3Oy (YG-123) bulk samples with a top-seeded IG method by varying the content of (Y, Gd)2BaCuO5 (YG-211). Adding Gd-211 to Y-211 in the precursor has increased the critical current density Jc compared to bulk YBa2Cu3Oy (Y-123). The superconducting transition temperature Tc has also increased accompanied by reduced transition width with increasing Gd-211 content. A spatial variation in Tc and Jc has been observed due to variations in the volume fraction and size of YG-211 inclusions. The volume fraction of YG-211 and thereby Jc values decreased by increasing the distance from the seed along both a- and c-axis directions. Increased volume fraction near the seed not only leads to increased critical current density but also signifies the presence of more pinning sites and hence increased pinning efficiency in IG-processed YG-123 samples. As the content of Gd-211 was increased in the precursor, the volume fraction and particle size of YG-211 decreased in the YG-123 matrix. The irreversibility field Hirr of bulk YG-123 samples was ∼5.10 T, which was higher than that of bulk Y-123 sample. The vibrational studies done by Raman measurement have been performed for the first time on these bulk IG-grown YG-123 samples and produced the same results as expected for binary mixed rare earth superconductors.
Acknowledgments
This work was supported by Japan Student Services Organization (JASSO), Shibaura Institute of Technology (SIT) under the Top Global University Project, Designed by Ministry of Education, Culture, Sports, Science & Technology in Japan.
Footnotes
- 3
Temperature at which the peak of dχ/dT versus T curve appears.
- 4
FWHM of dχ/dT versus T curve.
- 5
Temperature where dc susceptibility becomes negative (χ < 0).