

Abstract
The influence of a fast electromagnetic perturbation, such as plasma disruption, on the ITER toroidal field (TF) coil conductor was studied. When a fast magnetic field change is superimposed, the TF conductor is inductively heated by internally generated eddy currents. To measure the inductive heating (IH) energy amount by calorimetry, an IH experiment using short TF conductor samples with length of 20 cm was performed in a liquid He bath. The sample components used were a TF conductor, TF jacket and a TF conductor cable. A 60-turn, single layer solenoid coil was installed around each sample as an IH coil. Also, the Joule heat of the IH coil was solely measured to subtract its thermal contribution from the other samples. A 1 kHz sinusoidal AC current was applied to each IH coil, changing the current amplitude. The heat generated in the samples, including the IH coil, was eventually absorbed into the liquid He, and the liquid He was then vaporized. Thus, the heat amount was measured by a He level sensor inside a gas collection cylinder attached above the sample. The validity of the experimental results was confirmed by comparing them with computation results of the IH energy of the samples with a computation model. Also, the consumed energy was calculated from the measured waveforms of the applied AC voltage and current to the samples. As the result, the measured and calculated IH energy were found to be in good agreement. Finally, based on the results of the experiment, the minimum magnetic field strength, which triggers quench of the TF conductor by fast dumping like plasma disruption, was evaluated using estimated TF conductor minimum quench energy.
Export citation and abstract BibTeX RIS
1. Introduction
The National Institute for Quantum and Radiological Science and Technology is responsible for procuring nine toroidal field (TF) Coils and 25% of the TF conductors for the ITER project [1]. The cable-in-conduit TF conductor is composed of 900 Nb3Sn superconducting strands, 522 copper strands and circular pipe made of SS316LN with 1.9 mm thickness [2–4]. The TF coils [5] are installed and operated around fusion plasma to confine it in a doughnut-shaped vacuum vessel by the magnetic field. Since the fusion plasma stores a large amount of electromagnetic energy for its fusion reaction, a change of the plasma status affects the surrounding structure as perturbation.
Plasma disruption [6] is a phenomenon during which the plasma current of about 10 MA is rapidly lost in a few milliseconds, which eventually induces large eddy current in the structural components, including the TF coils. This eddy current leads to a large electromagnetic force with an interaction of the magnetic field. And also, by the eddy current, the structural components are inductively heated. For the TF coils, the inductive heating (IH) energy generated in the conductor can be a cause of quench. Therefore, it is important for the stable operation of the TF coils to understand how electromagnetic perturbation thermally affects the TF conductor.
However, an experimental result of IH test for the TF conductor by fast frequency equivalent to plasma disruption has not yet been obtained. The motivation of this study was to obtain such experimental data. A series of IH experiments with short TF conductor samples was performed by calorimetry in a liquid He bath, and the amount of heat energy deposited in the sample was measured. The experimental results were compared with theoretical calculations to confirm their validity. Finally, based on the experimental results, the minimum TF conductor magnetic field strength, which triggers quench by fast dumping like plasma disruption, was evaluated using estimated TF conductor minimum quench energy (MQE).
2. Experimental method
The experimental method applied to evaluate the IH energy deposited on the TF conductor was calorimetry [7–9]. For this experiment, short TF conductor samples with a length of about 20 cm were prepared. A 60-turn single solenoid coil wound with a copper wire of 1.6 mm in diameter was installed around each sample as an IH coil. To study the amount of heat deposition on each component of the TF conductor and resistive heating energy at the IH coil, four different sample types were prepared: 'TF conductor with IH coil', 'TF jacket with IH coil', 'TF conductor cable with IH coil' and 'IH coil only'. The prepared TF conductor, TF jacket and TF conductor cable used for the samples were heat-treated for 250 h at 570 °C and then for 100 h at 650 °C [10]. A picture of the samples and the sample holder schematic are shown in figure 1. The sample was submerged into a liquid He bath with the sample holder during the experiment. The inside of the liquid He bath was connected to the air to keep the inside gas pressure at atmospheric pressure. Since the liquid He inside was gradually lost by vaporizing in this case, the amount of liquid He inside the bath was observed by a liquid He level sensor and liquid He was refilled to keep the level constant. Then, the sample was inductively heated by applying 1 kHz, sinusoidal current to the IH coil on the sample for 40 ms, changing the current amplitude. The applied current, Ih, is expressed by (1) below

Here, I0 is current amplitude, and f is frequency. A frequency of 1 kHz was selected to simulate the same level of electromagnetic wave frequency as plasma disruption. After the sinusoidal current was applied, the heat was eventually absorbed into the liquid He, and the He was vaporized. The vaporized He gas was collected in a cylinder above the sample, which contained a liquid He level sensor inside. The information on the amount of inductively generated energy was obtained from the volume of the vaporized He gas measured by the liquid He level sensor. The relationship between the He gas volume and heating energy amount was calibrated using a resistive heater attached to the sample before the IH tests. After energization of the IH heater or the resistive heater, the He bubble inside the cylinder was released through a pipe connected to a vacuum pump. The IH tests were performed under an 11.8 T magnetic field generated from a backup coil, which is the maximum field TF coils are placed under at their operating condition. The tests were conducted also in zero-field conditions to study the effect of the magnetic field on the samples.
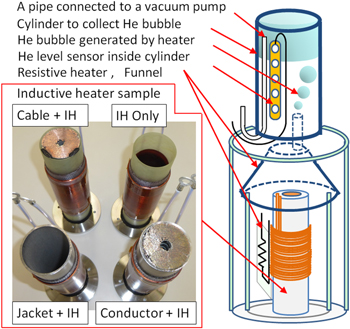
Figure 1. Inductive heating test samples and the experimental apparatus.
Download figure:
Standard image High-resolution imageThe heat that vaporizes the liquid He is separated into two kinds. The first is the heat generated by Joule heating in the IH coil itself, caused by the copper resistance and Ih. The second is the heat generated by electromagnetic induction in the sample cores, namely the TF conductor, TF conductor jacket and TF conductor cable, caused by eddy current. Both of these heats are proportional to the time integral of the Ih squared. Therefore, the total heat energy, Etotal, used to vaporize liquid He is expressed by (2):

Here, th is the energizing time of the IH coil. In this series of experiments, the th was set to 40 ms for each of the tests. Ch is coefficient of the time integral of the Ih squared to obtain Etotal and the unit of Ch is the same as electrical resistance, Ω. Furthermore, as described above, the heat source was separated into the IH coil and the sample core. So the coefficient Ch also can be separated into two terms: contribution from the IH coil, CIH, and that from the sample core, CCore. This CCore was inherent in each sample, and the purpose of the experiment was to obtain the CCore for each sample. In the experiment apparatus, only Ch can be obtained per sample kind. Meanwhile, for the only 'IH coil only' sample, Ch equals CIH because this sample had no inductively heated core. So the CCore for each sample is calculated by subtracting CIH obtained from the 'IH Coil Only' sample from Ch for each sample, assuming that the CIH is identical for all the samples.
3. Results of the experiment
The calorimetry experiment was carried out for the aforementioned four samples under 11.8 and 0 T background field. The result of the experiment is shown in figure 2. In this figure, the obtained heating energy Etotal for each IH shot is organized by the time integral of the Ih squared. As predicted in (2), the obtained Etotal values are proportional to the time integral of the Ih squared. Therefore, the slope in this graph for each sample, which equals Ch, was obtained by linear approximation and is shown in table 1, which also includes the calculated CCore value for each sample.
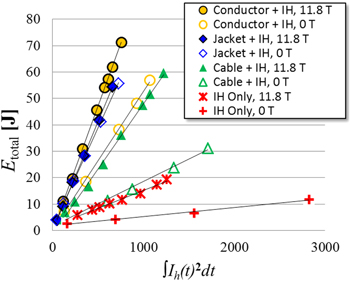
Figure 2. Experiment result of inductive heating test using the short TF conductor samples by calorimetry. The relationship between the time integral of the Ih squared and total heating energy Etotal is shown for each sample.
Download figure:
Standard image High-resolution imageTable 1. The values of proportional coefficient Ch in equation (2) for each inductive heating test sample.
| Sample name | Ch (J A−2 s−1) at 0 T | Ch (J A−2 s−1) at 11.8 T |
|---|---|---|
| (i) Conductor + IH | 0.053 | 0.094 |
| (ii) Jacket + IH | 0.076 | 0.083 |
| (iii) Cable + IH | 0.017 | 0.049 |
| CIH (J A−2 s−1) at 0 T | CIH (J A−2 s−1) at 11.8 T | |
| (iv) IH only | 0.0034 | 0.013 |
| CCore (J A−2 s−1) at 0 T | CCore (J A−2 s−1) at 11.8 T | |
| (v) Conductor core (= (i)–(iv)) | 0.049 | 0.081 |
| (vi) Jacket core (= (ii)–(iv)) | 0.072 | 0.069 |
| (vii) Cable core (= (iii)–(iv)) | 0.014 | 0.036 |
In table 1, the values of CCore for 'Conductor' and 'Cable' samples at 11.8 T are larger than those at 0 T. The main cause of this increase of CCore is magnetoresistance of the copper in the superconducting cable. The 'Jacket' sample did not show the increase of CCore because the jacket material, which is stainless steel, does not significantly increase its resistance by a magnetic field. Table 1 also showed that the largest CCore value at 0 T is obtained from the 'Jacket' sample core, and the second largest is the 'Conductor', while the largest CCore at 11.8 T is the 'Conductor' sample core. This difference in the CCore of the 'Conductor' core is probably caused by the skin depth change in the copper in the superconducting cable due to the magnetic field strength. The calculated skin depth of the copper is 1.5 × 10⁻⁴ m at 4 K, 0 T, 1 kHz, which is shallower than 3.8 × 10⁻⁴ m at 4 K, 11. 8 T, 1 kHz. Thus, the total magnetic flux which penetrates the conductor cross-section at 4 K, 0 T is less than that at 4 K, 11.8 T. Similarly, the induced circumferential voltage in the conductor decreases due to the reduction of the magnetic flux. Therefore, for the same AC current applied to the IH coil, the IH power in the 'Conductor' sample at 4 K, 0 T is less than that at 4 K, 11.8 T. The reason that the IH power of the 'Conductor' sample at 4 K, 0 T is less than that of the 'Jacket' sample at 4 K, 0 T can be also explained by the same theory. Namely, the superconducting cable in the 'Conductor' sample prevents magnetic flux penetration into the bore of the jacket by skin effect. Similarly, the induced circumferential voltage in the jacket thickness decreases due to the reduction of the magnetic flux in it and this leads to the reduction of the IH power in the jacket. The IH power in the conductor is the sum of that in the superconducting cable and that in the jacket. In the case of the 'Conductor' sample at 0 T, the degree of reduction of the power in the jacket caused by the existence of the superconducting cable is large, and thus the sum of the power in the superconducting cable and that in the jacket is less than that of the 'Jacket' sample. On the other hand, at 11.8 T, the IH power of the 'Conductor' sample is larger than that of the 'Jacket' sample. This can be explained by the difference of the skin depth of the copper in the superconducting cable between 0 and 11.8 T mentioned above. The skin depth at 11.8 T is deeper than that at 0 T and thus more magnetic flux is allowed to penetrate the bore of the jacket at 11.8 T.
4. Theoretical calculation of IH energy
The validity of the experiment results were confirmed by comparing them with the values calculated from theoretical calculation models. Here, the calculation was done for the 'TF jacket with IH coil' and 'IH coil only' samples because their structures are simple and easily replaced to the theoretical models.
For the calculation of the AC resistance of the copper wire for the IH coil, which is compared with 'IH coil only' sample, Dowell's equation [11] was applied. In this model, for a solenoidal coil with single layer, the AC resistance Rac is calculated as (3):

where lturn is the copper wire length in one turn, N is the number of winding turns and ρ is the DC resistivity. δ is the skin depth, and deq is the equivalent diameter, which are expressed as:


where μ is the magnetic permeability of the copper, and d is the diameter of the wire. Δ' is expressed as follows:

where h is the width of the coil winding parallel to the winding axis.
To calculate the Rac for the IH coil by (3), the DC resistivity ρ was experimentally obtained at 0 and 11.8 T by the four-terminal method, and the results are 8.9 × 10⁻¹¹ Ω m and 5.8 × 10⁻¹⁰ Ω m, respectively. Therefore, the calculated Rac values at 4 K, 0 T: Rac (4 K, 0 T) is 3.8 × 10⁻³ Ω, and at 4 K, 11.8 T: Rac (4 K, 11.8 T) is 9.7 × 10⁻³ Ω, where the unit Ω can be replaced with J A−2 s−1. The obtained Rac values almost correspond to CIH values shown in table 1. The reason for the difference between the theoretical calculation result here and the experimentally obtained value in table 1 at 4 K, 11.8 T has not understood yet. In table 1, it seems that the two data points around 20 J of Etotal of 'IH Only' sample at 11.8 T increased the slope of the linear approximation. One possibility is that the resistive heat generated inside the copper wire volume of the IH coil raised the temperature of the wire itself while the AC current application, and thus the resistivity of the wire increased. An easy estimation shows that heating energy more than 8 J increases the IH coil wire temperature from 4 K to more than 20 K, provided that there is no heat loss from the wire during the 40 ms of the AC current application. In this case, the resistivity of the wire becomes around 1.3 times at 25 K and the amount of heat generation is increased, accordingly.
To calculate the IH energy generated in the TF jacket, which is compared with the 'TF jacket with IH coil' sample, the jacket was considered to be a circular, multi-layered bark. A schematic of the calculation model is shown in figure 3. The magnetic flux Φ which penetrates each bark at x1 in radius at the time t equals t1 was then calculated as (7):

where B(x, t) is the magnetic flux density at x in radius at t in time, which is parallel to the axial direction of the jacket. The magnetic permeability of the jacket is assumed to be the same at 0 and 11.8 T because the jacket is composed of non-magnetic material. Thus, the calculation results in the case of both fields are the same. Since the B(x, t) is impacted by the skin effect, the B(x, t) value changes depend on x as follows:
Here a and b are the outer and the inner radii of the jacket, respectively. δjacket is the skin depth of the jacket. Bx=a is the amplitude of the magnetic field strength at the outer surface of the jacket, and μr is the relative permeability of the jacket made of SS316LN. From the obtained Φ, the voltage and the current generated around the bark are calculated by Faraday's law of induction as (10) and (11), respectively

Figure 3. Calculation model of inductive heating energy generated in the 'TF jacket' core.
Download figure:
Standard image High-resolution imageHere ρjacket is the DC resistivity of the jacket. The power generated in the bark during the energizing time th of 40 ms, Δq(x1, th), is calculated as:
The total energy generated in the jacket is calculated by the integrating of Δq over the whole thickness of the jacket. The result of the calculation is shown in figure 4. Eventually, the calculated IH energy in the jacket, Ecomp.jac., is proportional to the time integral of the Ih squared, as predicted in (2). The proportional coefficient obtained from the calculation of the jacket is 0.0627 J A−2 s−1, which is around 10% less than CCore of the jacket. The 10% difference is probably caused by the heat generated by the magnetic field vertical to the axial direction of the jacket, which is not included in the model calculation.
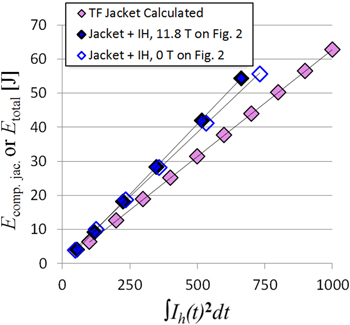
Figure 4. Calculation result of inductive heating energy generated in the 'TF jacket' core.
Download figure:
Standard image High-resolution imageAs described above, the theoretical calculation results of the AC resistance of the IH coil and the IH energy generated in the jacket correspond to the experimental values. Therefore, it was concluded that the experimental method applied for this test series was valid. However, an applicable model for the 'Conductor' and 'Cable' samples which would clearly explain the experimental results has not yet been found. Those samples will be considered in future work.
5. Energy loss calculation in electrical circuit
In this IH experiment series, the AC voltage between both ends of the IH coil on each sample, Vh(t), was measured by the four-terminal method. From the waveforms of this AC voltage and the measured AC current Ih(t), which were recorded with a sampling frequency of 100 kHz, consumed energy Ecircuit at the sample was calculated as following (13):

This calculation was performed for each shot. Then, the relationship between the Ecircuit and the time integral of the Ih squared was studied. Eventually, the result showed a proportional relationship between those items for all of the samples, similarly to figure 2. The proportional coefficient for each sample obtained in this calculation, Kh, is shown in table 2, and the results indicate good agreement within the range of 0.011 Ω with the calorimetry, shown in table 1. The coefficient for 'IH Only' sample at 0 T is not shown in table 2 because the calculation by (13) did not agree with the experiment results over 100%, primarily because the phase shift between Vh(t) and Ih(t) was not measured accurately. A problem of the calculation of the Kh in this measurement is as follows. First, the relationship of the Kh, Vh(t) and Ih(t) are expressed as:
Here Z, L and θ are synthetic impedance, self-inductance of the circuit and the angular phase shift, respectively. When the time shift between Vh(t) and Ih(t) is expressed by ΔT in seconds, the angular phase shift θ is calculated by θ (degree)= 360 · f · ΔT. In the case of 'IH Only' sample at 0 T, Kh should be around 3 mΩ from the result in table 1. The self-inductance L of the IH coil is calculated theoretically with Nagaoka coefficient [12] and the value is 68 μH. Therefore, from the values Kh and L above, θ and cos θ are calculated to be 89.6° and 7.0 × 10−3 by (14), respectively. Meanwhile, Kh is experimentally obtained by Kh = (∣Vh(t)∣max/∣Ih(t)∣max) · cos θ using measured time shift ΔT. Here, the ΔT is needed to be measured accurately in the case of the Kh calculation around θ = 89°. The reason is that the change ratio in value of cos θ per one degree from θ = 89° is almost 100% due to the nearly zero value of cos θ. In this measurement, much lower Kh value than 2πfL leads value of θ to almost 90° and then this leads to the requirement of higher ΔT accuracy. In the case of this 'IH Only' sample at 0 T, to reduce the error of cos θ value within 100% at θ = 89.6°, the accuracy of the measurement of ΔT should have been finer than 1 μs. However, the error of measured ΔT was over 1 μs, probably caused by an amplifier or a voltage divider used in the measurement system. As the other factor of the ΔT error, 100 kHz sampling frequency was not enough to read ΔT with the accuracy within 1 μs. A noise on the Vh(t) and Ih(t) could also be a cause of the error of the integration in (13).
Table 2. The values of proportional coefficient Kh of the calculated Ecircuit by (13) and the time integral of the Ih squared for each inductive heating energy calibration sample.
| Sample name | Kh (J A−2 s−1) at 0 T | Kh (J A−2 s−1) at 11.8 T |
|---|---|---|
| (I) Conductor + IH | 0.046 | 0.094 |
| (II) Jacket + IH | 0.067 | 0.081 |
| (III) Cable + IH | 0.0094 | 0.060 |
| (IV) IH Only | — | 0.0079 |
In the cases of the other samples, Kh is expected to be more than around 0.013 mΩ from the result of 'IH Only' sample at 11.8 T in table 1, which is the second lowest among the Ch and CIH values in the table. Then, if the L is assumed to be 68 μH for these samples, θ values are less than 88.3°. In the case of θ = 88.3°, if the accuracy of the measurement of ΔT is finer than 2.5 μs, the error of cos θ value becomes within 50%. In the case of 'TF conductor with IH coil' sample at 11.8 T, which has the largest Ch value of 0.094 mΩ in table 1, the θ value is 77.6°. In this case, if the accuracy of the measurement of ΔT is finer than 2.5 μs, the error of cos θ value becomes within 7.5%. As described here, the accuracy of the cos θ value was influenced by the difference between Kh and 2πfL values. The 'TF Conductor with IH coil' and 'TF jacket with IH coil' samples at 11.8 T, which have relatively high Ch values among the test samples, showed good agreement within 2.5% difference between the Kh and Ch values. For the 'TF conductor cable with IH coil' sample at 0 T and 'IH Only' sample at 11.8 T, which have relatively low Ch values among the test samples, showed some difference between the Kh and Ch values and the differences of the former sample and the latter sample were 45% and 40%, respectively. Although these differences seem to be high in percentage, the absolute values of the differences are not so large in comparison with the other samples, and the error of ΔT for each was also comparable to that of the other sample. From the aggregate result of all of the samples, the error of the measured ΔT was estimated to be within 1–4 μs.
Although some improvement of the measurement system is necessary, the experiment results indicate that it is possible to obtain IH energy from accurately measured Vh(t) and Ih(t).
6. Evaluation of minimum dump field as fast as plasma disruption to induce quench
Finally, based on the experiment result, the minimum magnetic field strength, which triggers quench by fast dumping like plasma disruption of the TF conductor was evaluated. For this evaluation, estimated MQE of the TF conductor was calculated in advance, using HEPAK code which is referenced to [13]. First, the status of the TF conductor, before being heated, was assumed to be 4.5 K, and the pressure inside the TF conductor to be at 0.6 MPa. The range of the calculation was limited within 101 mm, which is equal to the width of the IH coil on the IH experiment samples. Second, it was assumed that the TF conductor and He inside within the calculation range received IH energy equivalent to the energy by which the whole TF conductor volume inside the range uniformly reaches the current sharing temperature, Tcs, under constant-pressure condition at the point of quench. This assumption is based on the stability test result of the ITER CS conductor in the CS insert coil (CSIC) [14–19] test performed in the past. CS conductor is a cable-in-conduit type conductor, which is composed of 576 Nb3Sn superconducting strands and 288 Cu strands twisted and bundled through multi-stage process and inserted into a circle-in-square type jacket [20, 21]. The CSIC is a nine-turn single-layer solenoid coil with a 1.5 m diameter wound from CS conductor. This coil was force-cooled by supercritical He introduced to the inside of the conductor and the test condition of CSIC was 40 kA current application under a 13 T magnetic field. In the stability test [18], the heat deposition into the CS conductor was performed by an inductive heater coil with 60-turn single layered windings installed around the CS conductor. The applied IH frequency was 1 kHz and the duration was 40 ms, which are the same condition with the test described in section 2. The result of the CS conductor stability test showed that the MQE for the CS conductor was equivalent to the energy by which the whole CS conductor volume inside the range including He uniformly reaches Tcs of the CS conductor under constant-pressure condition. The analysis result of the CS conductor stability test also showed that more than 90% of the IH energy was deposited into the CS conductor jacket by skin effect and then the heat was transferred to the He and the superconductor cable inside. This situation is similar to the case of the TF conductor because the experiment result in section 2 showed that IH energy of the 'TF jacket' is relatively large when this sample is compared with the other samples. That is the reason why the assumption for the calculation was set. Here, 6.0 K was selected as a typical Tcs of the TF conductor during hundreds of electrical magnetic force cycles [22] studied at SULTAN [2]. According to the assumption above, the total energy input to induce quench, Equench, is 48.3 J. When the Equench is divided by the volume of the TF conductor in 101 mm, Vcond, Equench/Vcond equals 0.319 J cm−3. Also in [23], MQE calculation when plasma disruption occurs was evaluated with a calculation system which combined one-dimensional electric and thermohydraulic calculation code [24, 25] in the conductor and three-dimensional thermohydraulic code [26] in the TF coil structure. The derived MQE was 0.330 J cm−3-strand at the location with the lowest temperature margin, where the initial temperature before plasma disruption was 4.9 K. Here, the unit 'J cm−3-strand' means that the MQE calculation was performed by the code provided that the initial energy deposition by the plasma disruption was only on the superconducting cable part in the TF conductor. The MQE value of 0.330 J cm−3-strand in the reference above and Equench/Vcond of 0.319 J cm−3 are compatible, although the heat deposition on the TF jacket and on the He inside the conductor is also included in the case of Equench/Vcond, and initial temperature condition is different in 0.4 K in the two cases.
In this evaluation, the waveform of the field dump was assumed to be the same as a quarter period of a 1 kHz sinusoidal wave. Although an actual wave shape of the plasma current dump at the disruption is mostly fit by linear or exponential approximation [6], a sinusoidal wave also matches with the approximations within about 20%. In a fusion reactor, the period of a high-frequency wave from the plasma is attenuated through the vacuum vessel to be more than several milliseconds or several tens of milliseconds. So the evaluation here is more conservative than the actual IH energy. The dumping field was assumed to be generated from the IH coil which has a configuration identical to the IH experiment sample. This duration of 0.25 ms is 1/160 of th in (2). Thus, for the assumption above, the relationship between the magnetic field at the longitudinal center at the jacket surface before the dump, Bdisr, and the energy deposited into the TF conductor in 0.25 ms, Edisr, is obtained using (2) and CCore of the conductor sample at 11.8 T identified in table 1, as follows:


where Ih-disr is a hypothetical current to represent the field dump. I1 is current amplitude between the IH coil current just before the dump and that at the end of the dump. An example of waveform of Ih-disr is shown in figure 5. μ0 is the magnetic permeability in vacuum, and n is the number of winding turns of the IH coil per unit length. k is a correction coefficient of the magnetic field, and the value is 0.9189. When the k is removed, equation (17) is a formula to calculate magnetic field inside a single-layered solenoidal coil with infinite winding length. Here in this section, magnetic field inside the IH coil, which is a 60-turn solenoidal coil with finite winding length, was calculated. This correction coefficient k was introduced to correct the discrepancy between the infinity and finiteness of the solenoid coil windings at the calculation point. Due to the symmetry of the sinusoidal wave, (16) is further developed as follows:
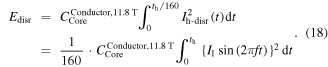
Thus, when I1 is settled, Edisr and Bdisr are also fixed. Figure 6 shows the relationship of the calculated Bdisr and Edisr/Vcond. The energy per volume, Edisr/Vcond, was eventually proportinal to the square of Bdisr by a factor of 0.142. And also, the calculated temperature of the TF conductor including He inside, Tcond, after the field Bdisr is dumped, is shown in figure 6. From this result, the field Bdisr when Edisr equals Equench is determined to be 1.51 T.
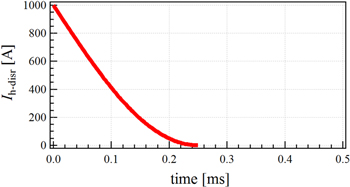
Figure 5. An example of waveform of the dumping magnetic field, which was used for the evaluation of the IH energy deposition on the TF conductor by plasma disruption. The magnetic field was assumed to be produced by the dumping current Ih-disr applied to the IH coil.
Download figure:
Standard image High-resolution image
Figure 6. Evaluation of IH energy in the unit volume of the TF conductor, Edisr/Vcond, generated by the dumping field from Bdisr in 0.25 ms. The calculated temperature of the TF conductor including He inside, Tcond, after the IH energy is deposited is also shown. The original condition of the He is 4.5 K and 0.6 MPa.
Download figure:
Standard image High-resolution imageThe evaluated Bdisr above was compared with a calculated magnetic field generated from ITER plasma current, Bplasma, at the point where the most stringent operation condition for the TF conductor in the TF coils. The calculation conditions of the Bplasma are described in the following sentences. As mentioned previously, the shape of the ITER plasma [27] is doughnut shape. The radius of the doughnut ring counted from the center of the cross-section, which is called major radius Rmajor, is 6.2 m. The horizontal and the vertical radii of the cross-section at the plasma surface are 2.0 m and 3.7 m, respectively. Here, the horizontal radius is called minor radius rminor. Since the cross-section has ellipticity and triangularity, these shaping factors were also considered. Then the plasma was assumed to be multi-layered coils horizontally divided into 20 coils in equal width, as shown in figure 7(a). In this figure the direction of the Rplasma is the same as Rmajor and zplasma indicates the distance in the vertical direction from the center of the plasma cross-section. Each coil has single turn current path and the current density inside each path was assumed to be uniform in the cross-section. The designed strength of the plasma current is 15 MA in total and this current was distributed with dependence in rminor direction to each coil. Although the plasma current distribution in plasma cross-section is changed according to its operation, in the calculation of the Bplasma a normal convex current distribution shown in figure 7(b) was assumed. In this figure, when the coil current in mth layer (m is an integer) numbered from the inner bore side is put as Imth, the relative current strength on each layer compared with the current on the twelfth layer, Imth/I12th, is shown. With respect to the TF coil, the maximum magnetic field is superimposed on the conductor at its inboard side during its operation. Also, largest magnetic field dump by plasma disruption occurs in the conductor nearest to the plasma current center at the inboard side. Thus, the quench of the TF coil is estimated to be initiated from this point, which corresponds to 2.966 m in Rmajor. And the point was selected as the calculation point of Bplasma.

Figure 7. (a) Cross-section of the plasma replaced by 20-layered coils. (b) Plasma current strength distribution for each coil for the calculation of Bplasma.
Download figure:
Standard image High-resolution image
The result of the calculation above showed that Bplasma is 1.48 T, and this value is below Bdisr. Therefore, this calculation revealed that the TF conductor would not lead to quench by the plasma disruption under the assumption set at the beginning of this section.
Although quench does not happen, the temperature of the TF conductor including He inside rises up to 5.97 K after the plasma disruption by the deposited energy according to figure 6. However, the actual temperature rises of the TF conductor in ITER just after the plasma disruption is expected to be lower than that because the frequency used for the Edisr calculation is several times higher than that observed ever in the other fusion experiment device for the conservative evaluation [28]. Generally, IH power depends on the frequency of the magnetic field and higher frequency leads to higher heating power. This fact is understood also from equations (10)–(12), for instance. The dependency of the IH power deposited in the TF conductor on the magnetic field frequency will be studied in the future work. The result of this future study will make it possible to predict the heat load from the TF coil into the cryogenic refrigerator after plasma disruption more accurately by implementing the result in a three-dimensional transient analysis of the heat in the TF coil, because the dumping speed of the disruption is changeable in each plasma discharge. The heat transfer analysis in the TF coil was already performed in the past [23, 29]. In these past analysis, however, heat generation inside the TF conductor by plasma disruption was not considered in detail because any available experimental or analytical data did not exist at that time, although thermal radiation, thermal conduction from the support structure, nuclear heating due to neutrons and eddy current losses in the structure were considered.
Apart from the experimental apparatus described in this paper, a series of IH tests of the TF conductor is being planned in the 'TF insert coil' (TFIC) test [30, 31]. The TFIC is a single layer 8.875-turn solenoid coil wound from ITER TF conductor. The coil diameter is 1.44 m and the conductor length is around 40 m. The TFIC is force-cooled by supercritical He inside the TF conductor. The test condition of the TFIC is 68 kA current application under an 11.8 T magnetic field. This large coil has two IH coils with the same winding configuration as the one mentioned in this paper: 60 turn with a copper wire 1.6 mm in diameter. The IH coils are located at the central turn of the TFIC and used for stability test. The TFIC also has several temperature sensors attached on the surface of the TF conductor jacket. When the TFIC is inductively heated by the IH coils without following quench, the IH energy will be absorbed into the He and then transition of the conductor temperature will be observed. Therefore, the deposited IH energy will be obtained from the measured transition of the He temperature and pressure. The studied IH energy in the TFIC test will be compared to the results of the 'Conductor + IH coil' sample for the validation of the results. MQE will be also studied in the TFIC test and compared with the result of the analysis in this paper.
7. Conclusion
To understand the thermal influence of IH on the TF conductor by 1 kHz of fast frequency, which is the equivalent of plasma disruption, a series of IH experiments with short ITER TF conductor samples was performed. In the experiments, the IH energy amount for each of the samples was measured by calorimetry in a liquid He bath. The sample kinds were separated as 'TF conductor', 'TF jacket', 'TF conductor cable' and 'IH coil only' components. They were tested in 11.8 T and zero fields to consider the distribution of heat generation. The validity of the experimental data was confirmed by comparing them with both the theoretical calculation model and the consumed energy calculation of the IH coil electrical circuit. Finally, the relationship between the dumping magnetic field like plasma disruption and IH energy generated in the TF conductor was evaluated based on the experimental results. The evaluation result showed that TF conductor in the TF coil in ITER does not quench by plasma disruption since the temperature of the TF conductor after plasma disruption is below its Tcs.