
Abstract
A major benefit of additive manufacturing technologies is precise control over structural topologies and material properties, which allows to tailor, for instance, energy absorption and dissipation. While vat photopolymerization is generally restricted to a single material, grayscale masked stereolithography (gMSLA) allows to customize material behavior by grading the light intensity within a structure. This study investigates the impact and opportunities of grayscale grading strategies on the rate-dependent mechanical behavior of structures fabricated by gMSLA. Considering the viscoelastic nature of polymers, rate-dependent energy dissipation is explored, introducing a parametric linear viscoelastic constitutive model for varying grayscales. The investigation includes the comprehensive characterization of mechanical properties, numerical finite element simulation, validation through experimental procedures, and exploration of dissipation energy under different strain rates. In this way, a rational function successfully determines the critical strain rate at which the maximum dissipation occurs. Overall, the research offers a comprehensive investigation of the mechanical dissipation behavior of graded 3D printed structures, laying the foundation for further studies and advancements aimed at optimizing these structures for enhanced energy absorption capabilities.
Export citation and abstract BibTeX RIS

Original content from this work may be used under the terms of the Creative Commons Attribution 4.0 license. Any further distribution of this work must maintain attribution to the author(s) and the title of the work, journal citation and DOI.
1. Introduction
Enhancing energy absorption and dissipation capabilities is a key goal in the development of polymeric structures with multiple materials, microstructures, and graded compositions. This is especially crucial for industries like aerospace, automotive, and packaging. A thorough investigation into how these materials absorb and dissipate energy is imperative. By gaining insights into the fundamental mechanisms and properties involved, it becomes possible to optimize the design of materials and structures. This optimization contributes to improved safety, impact resistance, and overall performance across a range of applications. Utilizing emerging additive manufacturing techniques, such as 3D printing [1–5], enables the explicit fabrication of intricate polymeric structures with high accuracy. Novel materials and designs are developed to enhance absorption properties, incorporating lattice structures [6–10], multistable structures [11–14], and meta structures [15–18].
Lattice structures, valued for their lightweight and flexible geometry, are explored for energy absorption, with investigations into unit cell topology variations at different strain rates [6] and the incorporation of hybrid unit cells [10] to enhance absorption performance. A grading strategy, involving changes in unit cell height and diameter [8], and the implementation of graded lattice structures with diverse topologies [7], are also employed to improve energy absorption. Lightweight structures exploit element instability to reduce strain peaks [13], while artificial structures with bi-stable units absorb energy through stable configurations. Dual-material auxetic meta-sandwiches, introduced through 4D printing [12], exhibit non-linear stiffness and dissipate energy through mechanical hysteresis. These reversible structures, leveraging the hyperelastic and elasto-plastic properties of polymers, hold promise for 4D printing applications in tunable energy absorption systems [15].
Among different additive manufacturing methods for polymers, vat photopolymerization-based methods have the advantage of fast printing. In this method, a 3D solid is fabricated layer-by-layer by photo-curing of liquid resin. A wide range of applications of this process is reported in ceramics, glass, biomaterials, electronics, and shape-memory polymers [19]. However, compared to other additive manufacturing methods such as extrusion and fusion of solid filaments or droplet-based photopolymerization, vat polymerization methods suffer from the disadvantage of single material printing. While fabrication of multi-material structures with functionally material properties is illustrated for injekt 3D printing [20–22], the single material printing restrict the vat photopolymerization methods [23–26]. Grayscale Masked Stereolithography (gMSLA) overcomes this disadvantage of vat photopolymerization methods by regulating light intensity through grayscale pixels [27–31]. Hence, the gMSLA printing method has the capability to fabricate complex and material-graded structures.
Polymers generally exhibit strongly rate-dependent material behavior, necessitating the use of viscoelastic constitutive models to accurately capture their time-dependent characteristics [32, 33]. Viscoelastic structures possess distinctive characteristics that make them valuable in diverse engineering and materials applications, primarily due to their effectiveness in dissipating and absorbing energy. Energy dissipation signifies the capacity of a material or structure to convert mechanical energy into different forms, such as heat or deformation, during loading conditions. Viscoelastic materials exhibit a mixed behavior of viscous and elastic, combining the characteristics of both fluids and solids. This quality enables them to efficiently dissipate energy through internal molecular rearrangements and relaxation processes.
The viscoelastic nature of a material is defined by hysteresis, where the loading and unloading curves do not overlap, as indicated in figure 1. This phenomenon illustrates the irreversible energy dissipation that occurs during material loading and subsequent unloading. The area under the stress–strain curve represents absorbed energy, while the region between the loading and unloading curves signifies dissipated energy. Leveraging this phenomenon is particularly crucial in materials like certain polymers and soft metals such as lead, renowned for their exceptional damping capabilities [34]. The combined properties of these materials enable viscoelastic structures to effectively mitigate vibrational energy, reduce impact forces, and enhance overall structural integrity, making them highly desirable for applications such as shock absorbers, noise reduction systems, and structural components exposed to dynamic loading conditions.
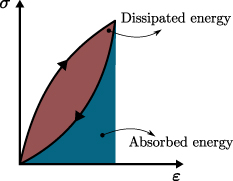
Figure 1. A diagram illustrating hysteresis as a consequence of non-recoverable energy during loading and unloading. The absorbed energy corresponds to the area under the stress–strain curve, while the dissipated energy can be quantified by the region between the loading and unloading curves.
Download figure:
Standard image High-resolution imageIn this study, we investigate the rate-dependent energy dissipation of graded viscoelastic materials and structures fabricated by gMSLA, a topic that, to the best of our knowledge, has not been studied before. Here, we establish a parametric, grayscale-dependent linear viscoelastic constitutive model for graded material properties and show how the grading affects the material response. To accomplish this, we first print and test samples with different grayscales to characterize their mechanical properties and establish complementary constitutive relations. Subsequently, we print and test a complex graded lattice structure under uniaxial compression, which is utilized to validate numerical finite element simulation framework. Finally, for a particular lattice structure, we establish a relation of energy dissipation at different strain rates and show the critical strain rate, at which the maximum dissipation appears.
The structure of the remaining sections in this manuscript is as follows: firstly, section 2 introduces key modeling concepts, encompassing the gMSLA 3D printing method, constitutive modeling, and the experimental approaches employed throughout this study. Moving forward, section 3.1 addresses the characterization of 3D printed polymers in terms of grayscale values. Subsequent to that, section 3.2 validates the numerical simulation framework through experimental procedures. Following validation, the influence of grading on structure behavior is studied in section 3.3 and the rate-dependent dissipation energy of viscoelastic structures is explored in section 3.4. Finally, the key findings and insights are consolidated in section 4.
2. Methodology
This section outlines the research methodologies utilized, encompassing the photopolymerization process and 3D printing, constitutive modeling, and the experimental setup. It begins with an overview of the photopolymerization process in the context of 3D printing using the gMSLA method. The discussion then shifts to the constitutive modeling of viscoelastic materials. Following this, the experimental methodology is elaborated, covering aspects such as sample preparation and testing procedures.
2.1. Grayscale masked stereolithography
A 3D printer utilizing the gMSLA method primarily comprises a UV light source, an LCD chip, a vat of liquid photopolymer resin, and a print platform, as depicted in figure 2. During the printing process, UV light is emitted from the source onto the LCD chip, where grayscale masks are loaded to control the light intensity and thus the curing process on a pixel-by-pixel basis. Every mask comprises grayscale pixels, spanning from white with RGB  or G = 1, signifying full light intensity, to black with RGB
  or G = 0, indicating zero exposure, i.e. keeping the photopolymer at the material point uncured. These masks illustrate the pattern to be solidified in a printed layer [31]. The UV light is filtered and directed by the mask onto the optic lenses, which control the transmitted area and focus on the tank of liquid resin.
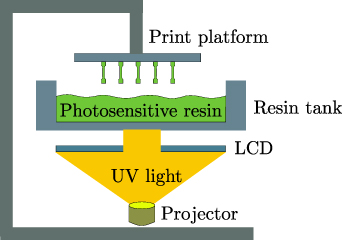
Figure 2. The structure of the printer following photopolymerization of photosensitive resin.
Download figure:
Standard image High-resolution imageThe photopolymer resin, composed mainly of free monomers and photoinitiators, undergoes a transformation under the UV light's influence, see figure 3. The photoinitiators decompose into active radicals, initiating a reaction with the monomers, converting them into active monomers. Subsequently, these active monomers react with other monomers, forming polymeric chains. As the process progresses, the activation and propagation of active monomers lead to an increase in the crosslink density, resulting in the formation of networks of molecules. Consequently, a solid-state polymer materializes in the designated domain, with the degree of cure depending on the incident light energy [35–37]. For additional insights into photopolymerization and cross-linking during printing, refer to [36, 38, 39] among others.

Figure 3. Schematic illustration of the photopolymerization process, depicting the components of liquid resin before and solidified material after photopolymerization.
Download figure:
Standard image High-resolution imageMoreover, the solidification process and crosslink density play a crucial role in determining the mechanical properties of the polymer [40]. In figure 3, the fully crosslinked polymer network, depicted in green, represents the material's elastic behavior. Conversely, the orange regions in figure 3 represent the remaining free monomer chains, which are essential for the material's viscoelastic behavior. Consequently, the viscoelastic properties of the material are contingent on both the degree of monomer conversion and the density of the crosslinked network [33, 41].
2.2. Viscoelastic constitutive modeling
The mechanical properties of viscoelastic materials can be effectively represented by rheological models [42–44]. The one-dimensional spring-dashpot presentation of a generalized Maxwell-type viscoelastic model that demonstrates relaxation characteristics is shown in figure 4. A set of springs, which respond linear elastic, is assumed to model the solid behavior. The stiffnesses of the free spring on one end and the spring for the so-called Maxwell element are determined by Young's moduli, denoted as  and
and  , respectively, where i takes values from 1 to n and represents the number of Maxwell elements, which are connected in parallel to the elastic spring. The flow behavior is represented by a Newtonian viscous fluid that acts like a dashpot. The viscosity of the fluid in the ith-Maxwell element is adequately specified by a material coefficients denoted as
  .
.
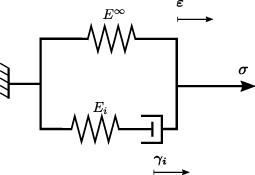
Figure 4. One-dimensional rheological model representing viscoelastic material behavior.
Download figure:
Standard image High-resolution imageFor a generalized Maxwell rheological model with n viscous branches, the starting point for deriving the relationship between the Cauchy stress σ and the strain tensor ε is the assumption of a Helmholtz free energy potential in the form

which is defined in terms of the total strain
ε
and internal variables denoting the viscous strains γi
. The energy function can be divided into the equilibrium (elastic) part  and the non-equilibrium (viscoelastic) parts
  as
as
The Clausius–Planck inequality for purely mechanical problem can be rewritten for small strains as

where  denotes the rate of the strain tensor, and
  is the material time derivative of the energy function. This inequality asserts that the scalar product of the stress tensor and the rate of strain tensor (stress power) must be greater than (for irreversible process) or equal to (for reversible process) the ratio of the rate of internal energy. It captures the irreversible processes and energy dissipation occurring within a material system. Calculating the time derivative of energy function equation (1) using the chain rule and substituting in equation (3) results in
The Coleman–Noll procedure is applied to fulfill the requirement of  . By considering arbitrary choices of the tensor variable
ε
, a physical expression for the Cauchy stress
σ
is deduced, along with an inequality that governs the non-negativeness of the internal dissipation
. By considering arbitrary choices of the tensor variable
ε
, a physical expression for the Cauchy stress
σ
is deduced, along with an inequality that governs the non-negativeness of the internal dissipation  , as it is required by second law of thermodynamics. Substituting the right side of equation (2) into equation (4) results in
In the rheological model illustrated in figure 4, the total strain in the ith Maxwell element is the sum of the elastic spring and dashpot strains for that element. This relationship results in

In the context of viscoelasticity theory, the volumetric component does not have any impact on the viscous behavior and can be considered negligible [44, 45]. Hence, the Cauchy stress tensor σ can be expressed for incompressible material in reduced form as
where p is the hydrostatic pressure and  . In consideration of the observation that only the isochoric component of an incompressible material contributes to viscoelastic deformation, the material's behavior can be described using (isochoric) fourth-order stiffness tensors as

where  represents the elastic shear modulus,
  corresponds to the viscoelastic shear moduli, and
  denotes the fourth-order identity tensor. The total shear modulus, denoted as µ, can be defined as
The linear equations that govern the complementary evolution of viscous strains  are expressed by the following equation
where  represent the relaxation times.
In this study, n = 1 viscous branches were deemed sufficient to accurately model the viscoelastic behavior of a gMSLA 3D-printed photopolymer. The simulations were conducted using Ansys software (version 2021 R2, ANSYS Inc. Canonsburg, PA, USA). For finite element calculations, the Prony shear viscoelastic constitutive model in Ansys was selected to apply the described theory. In the ANSYS Mechanical simulation, a mesh comprising second-order tetrahedral elements was employed, totaling 220 000 elements in the domain. Ansys Parametric Design Language (APDL) was utilized for grading the structures. The corresponding code is detailed in appendix
2.3. Experimental setup
All specimens considered in this study are manufactured using the commercial MSLA printer, 'Original Prusa SL1S', developed by Prusa research a.s. This printer incorporates a UV LED with a 405 nm wavelength and a monochrome LCD module for uploading masks with dimensions of  and a resolution of
  pixels. The printing process employs the UV-sensitive 'Prusament Resin Tough Prusa Orange' by Prusa Research a.s. The material composition includes epoxy resin (20%–40%), color pigment (2%–5%), and photoinitiators (3%–5%).
The geometries of the test samples are created using CAD software, and they are exported in STL file format. The masks (slices) are generated from the STL files using the 'PrusaSlicer' software with a desired layer thickness. In configuring the print parameters, the exposure time t and layer thickness h are set within the slicer software and exported with the printable file. Notably, the slicer software defaults to providing only black and white masks. Hence, for printing graded structures, 'MATLAB' (version R2022a, The MathWorks Inc.) is employed for image processing, adjusting the white pixels to achieve the desired grayscale values G. A MATLAB code for grading structures is provided in
The light intensity  is measured on the LCD surface using a slim photodiode power sensor (PM100D with S120VC sensor, Thorlabs Inc. Newton, NJ) with a ±5% measurement accuracy. The maximum light intensity of the printer under consideration is
  mW cm−2. The relation between grayscale and light intensity is well-approximated as
  , see also [40].
For mechanical characterization, uniaxial tensile tests are conducted following the ASTM D638 standard, employing sample type IV. A T500-1200-5kN machine (MFC Sensortechnik GmbH) is used for testing, adhering to EN ISO 7500-1, and providing a 1 µm travel resolution accuracy. To obtain the elastic and viscoelastic material responses, a minimum of three different test samples are utilized in tensile and relaxation tests. The samples have the same form as the uniaxial tension test samples in the ASTM D638 standard.
3. Results and discussion
In this section, the experimental characterization of the material is conducted across various grayscale values, and complementary constitutive parameters are characterized. Subsequently, the finite element simulation using these material models is thoroughly validated through experimental data. Proceeding with confidence in the validated numerical framework, we explore how the grading influences the overall mechanical behavior of lattice structures. Finally, our attention turns to the study and formulation of rate-dependent energy dissipation specifically tailored for a graded lattice structure.
3.1. Material characterization
To formulate a constitutive model for the materials, four distinct grayscale values, namely G = 0.6, 0.75, 0.85, and 1.0, were selected for calibration purposes, as explained in [31]. The exposure time for the calibration process was fixed at t = 5 s, while maintaining a layer thickness of h = 0.05 mm. Note that we use a minimum value of G = 0.6 for this particular choice of exposure time, layer thickness, MSLA printer, and photopolymer material in order to ensure solidification of the resin. The viscoelastic material model was tailored to fit experimental curves obtained at three different strain rates. Initially, the elastic component of the model in terms of the shear modulus µe
was calibrated using a uniaxial tensile test performed at a strain rate of  1/s. Subsequently, the viscoelastic constitutive model with n = 1 viscous branches was fitted to higher strain rates of
  1/s and
  1/s to determine the relaxation time τ1 and relative modulus α1. The resulting constitutive parameters for each grayscale value are illustrated in figure 5.
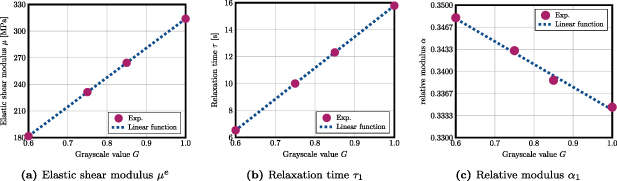
Figure 5. Constitutive parameters plotted against grayscale values ranging from G = 0.6 to G = 1.0, derived from experiments and a linear interpolation function.
Download figure:
Standard image High-resolution imageImportantly, as can be seen in figure 5, the behavior of the constitutive parameters exhibits nearly linear characteristics across the range of grayscale values. Consequently, a linear function can be utilized to approximate the constitutive parameters  for arbitrary grayscale values between G = 0.6 and G = 1.0 as

where the corresponding coefficients are provided in table 1.
Table 1. Coefficients of the linear interpolation function to determine viscoelastic constitutive parameters for arbitrary values of grayscale G.
| Parameter | a | b |
|---|---|---|
| µe | 330.5 | −16.55 |
| α1 | −0.123 | 0.455 |
| τ1 | 23.16 | −7.368 |
Here, a linear interpolation approach is suitable for predicting mechanical properties based on grayscale variations within the specified range. This approach aligns with similar characterizations of grayscale-graded materials [31].
3.2. Validation of numerical model
To avoid the need for repetitive physical experiments, simulations offer a valuable alternative for investigating diverse physical conditions and grading strategies. Thus, the primary aim now is to validate the framework using a graded 3D printed complex structure.
In this case, a shell lattice structure comprising  'Schwarz primitive' cells, with dimensions of
  , was selected for this purpose, as illustrated in figure 6. To grade the lattice, grayscale variation was employed, ranging from G = 0.6 to G = 1.0. The gradation initiates from the bottom, with the first layer of unit cells printed using G = 1.0, followed by the second layer using G = 0.9, and concluding with G = 0.6 in the top layer. The gradation is visually represented in figure 6(c).
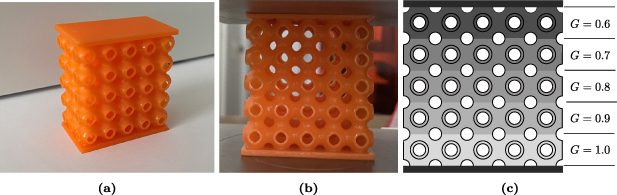
Figure 6. A graded 'Schwarz primitive' 3D shell lattice structure with  cells with overall dimensions of
  . (a), (b) The gMSLA 3D printed graded lattice structure. (c) Linear cell grading of lattice structure from bottom to top.
Download figure:
Standard image High-resolution imageTo validate the grayscale-dependent viscoelastic constitutive model and finite element simulations, two test case scenarios were examined. The first scenario involves cyclic loading, where the graded lattice structure is compressed up to 2% strain and then immediately unloaded. The strain rate in loading and unloading is  1/s. The corresponding force-strain and force-time curves are illustrated in figure 7. The graph clearly shows a high level of agreement between the experimental results and the numerical simulations conducted using Ansys. In the second scenario, also the relaxation behavior of the material and structure are examined. In this case, the graded lattice structure is loaded to 2% compressive strain and then held at that that strain for a duration of 30 s before being unloaded. Once again, a comparison between the numerical and experimental data demonstrates a good level of agreement in figure 8.

Figure 7. Validation of viscoelastic material model and numerical simulations through a cyclic loading scenario of the shell lattice structure.
Download figure:
Standard image High-resolution image
Figure 8. Validation of viscoelastic material model and numerical simulations through cyclic loading with relaxation of the shell lattice structure.
Download figure:
Standard image High-resolution image3.3. Influence of grading on structural behavior
After validating the numerical framework and simulations, we focus on exploring the influence of material grading strategies on the viscoelastic mechanical behavior of 3D lattice structures.
Like in the previous investigation, 'Schwarz primitive' shell lattices with  cells such as the one shown in figure 6 are considered. Now, different grading strategies are explored, where the grayscale value varies locally, i.e.
  , but ensuring that the average grayscale value
  in each structure is consistent as
Figure 9 shows 5 different grading strategies, including (a) the initial scenario of the lattice structure presented in figure 6, which exhibits grading from G = 1.0 at the bottom to G = 0.6 at the top by assigning distinct grayscale values to individual cell layers, resulting in a discontinuous shift between layers. The subsequent case (b) involves a continuous linear grading of the lattice structure, progressing smoothly from G = 1.0 at the bottom to G = 0.6 at the top. In case (c), the structure undergoes grading from the left side with G = 1.0 to the right side with G = 0.6, where each vertical layer of cells maintains a uniform and constant grayscale. A disordered vertical cell grading strategy is demonstrated in (d) and in (e) the cells are inhomogeneously graded in a random fashion. It should be highlighted that the average grayscale value remains consistent across all grading cases with  .
.

Figure 9. Grading strategies for shell lattice structures with identical average grayscale value  . (a) Cell layer grading from bottom to top. (b) Linear grading from bottom to top. (c) Cell layer grading from left to right. (d) Inhomogenous cell layer grading. (e) Inhomogenous, random cell grading.
Download figure:
Standard image High-resolution imageSimilar to section 3.2, the 5 different shell lattice structures are subjected to cyclic compression tests with loading up to an applied strain of 2% and subsequent unloading, both at a strain rate of  1/s. The resulting force-strain curves corresponding to different gradings, which were all obtained numerically using finite element simulation, are depicted in figure 10. It is evident that the mechanical behavior remains largely consistent when the average grayscale values are identical, indicating minimal impact of the grading strategy on the mechanical behavior within the linear viscoelastic region.

Figure 10. Comparison of numerical force-displacement curves for the 5 grading strategies in cyclic loading.
Download figure:
Standard image High-resolution image3.4. Rate-dependent energy dissipation of graded structures
Finally, the rate-dependence of the energy dissipation of the graded shell lattice structure illustrated in figure 9(a) is examined.
The structure undergoes cyclic loading up to 2% strain across various strain rates, spanning from quasi-static conditions at  1/s to higher rates at
  1/s. The dots in figure 11 represent the normalized energy, calculated as the ratio of dissipated energy to absorbed energy under various strain rates. Notably, the dissipated energy is relatively low at lower strain rates. However, with an increase in strain rate, the dissipated energy attains peak values before subsequently decreasing and converging to very small magnitudes for high strain rates. Comprehending this observed behavior and the dissipation of energy across different strain rates holds significant importance in the design of structures intended for applications requiring specific or high energy dissipation.

Figure 11. Energy dissipation for different strain rates in simulation and fit rational function.
Download figure:
Standard image High-resolution imageIn this context, a rational function can be utilized to model the energy dissipation for different strain rates, adhering to the specified form
where the coefficients are found to best approximate the values from figure 11 as
The solid line in figure 11 represents the fitted dissipated energy. The strain rate at which maximum energy dissipation occurs can be identified from this fit by obtaining the stationary point with  at
at  1/s.
1/s.
This behavior can be explained by the fact that, at lower strain rates, the viscoelastic element in figure 4 moves freely and is unable to endure stress. Consequently, the rheological system behaves like an elastic element with an elastic modulus of  . Conversely, at higher strain rates, the dashpot in the viscoelastic element behaves like a rigid element, resulting in an effective modulus of
  .
.
It is crucial to note that plastic deformation of the material is not considered in this investigation. Therefore, when designing structures, it is important to take into account that at larger deformations and higher strains, the material may undergo plastic deformation.
4. Conclusions
In this study, we systematically explored the rate-dependent, viscoelastic mechanical properties and behaviors of graded structures fabricated by grayscale vat photopolymerization. Such investigations at different stiffness distributions and loading conditions can be used to obtain the best grading strategy and optimize energy dissipation in practical applications.
Initially, we established a parametric viscoelastic constitutive model in terms of grayscales and characterized the gMSLA 3D printed material. We then validated the material model in finite element simulations through experiments conducted on a graded shell lattice structure in cyclic loading scenarios with and without relaxation. Following that, we examined the impact of the grading strategy on the material behavior for reversible deformations. Our findings indicate that, when the average grayscale remains constant, the grading strategy has minimal influence on the mechanical behavior of a graded lattice structure during small deformations. Subsequently, the developed constitutive model was applied to examine the rate-dependent dissipative behavior of 3D printed graded lattice structures across a range of strain rates. Employing a rational function, we successfully fitted the dissipated energy data, allowing us to identify the precise strain rate at which maximum dissipation occurs.
Overall, this research provides insights into the mechanical dissipation behavior of graded 3D printed structures and the influence of grading strategies on the general mechanical behavior. Furthermore, it opens the door for additional studies and enhancements aimed at optimizing these structures for improved energy absorption and dissipation capabilities. The implications of this work extend beyond the current understanding, offering opportunities for advancements in the design and performance of graded lattice structures across diverse applications.
Acknowledgments
We express our gratitude to our colleague Jasper Schommartz from TU Darmstadt for his assistance with the simulation of test cases. Additionally, we extend our thanks to Alexander Kohlstetter for his contribution to implementing gradation in Ansys during his Master's thesis at TU Darmstadt.
Data availability statement
All data that support the findings of this study are included within the article (and any supplementary files).
Appendix A: Ansys APDL code for material grading
The Ansys APDL code supplied illustrates a technique for implementing material grading in structural analysis. Material grading involves assigning different material properties to distinct finite elements based on their location or other specified criteria. This particular code facilitates material grading along the x-direction of the structural model.
The initiation of the code involves the selection of all elements designated for grading. The chosen elements are stored in a component for subsequent use. Material properties, including the minimum and maximum Young's modulus E_min and E_max, are established. Additionally, the geometric parameters, particularly the length of the structure in the x-direction, are configured. The grading process initiates with a loop that iterates through all elements. The x-coordinate of the centroid for each element is acquired. Subsequently, all elements located at this specific x-coordinate are chosen and designated to a distinct component. The material parameters at the current x-position are calculated using the specified grading formula. A novel material is generated with the computed material properties, and the material number attribute of the selected elements is consequently updated. Following that, the code advances to the next iteration, iterating through the process until no further elements are selected. Once the grading process is concluded, the material assignment for all elements is ultimately confirmed. The code concludes by saving and dispatching the designated materials.
It is essential to note that the provided code offers a simplified representation of linear grading. Additional functions and grading strategies can be incorporated using a similar approach.
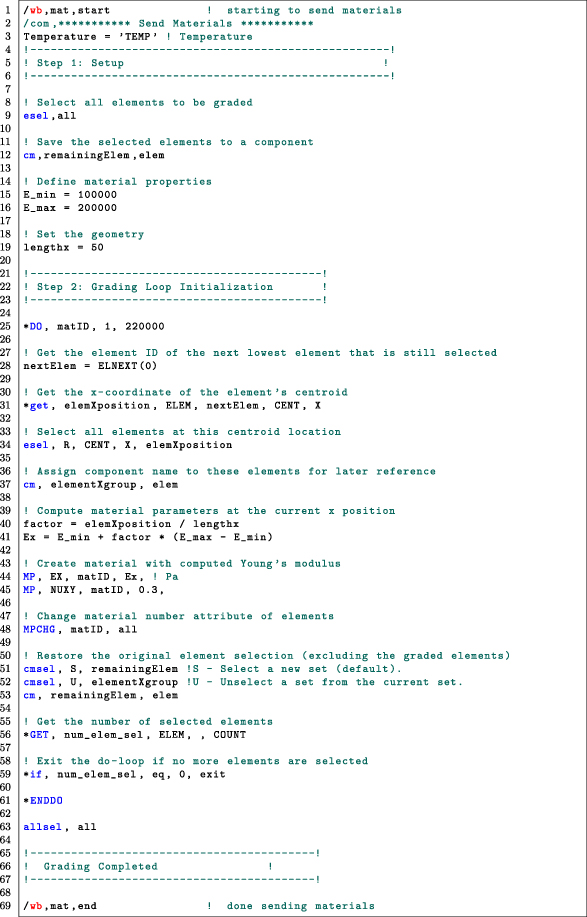
Listing 1: Ansys parametric design language for material grading
Download figure:
Standard image High-resolution image
Listing 2: Matlab code for changing grayscale values of the masks
Download figure:
Standard image High-resolution image
Appendix B: Grayscale pixel modification and color transformation in Matlab
The supplied Matlab code provides the capability to adjust the grayscale values of pixels within a mask. This code facilitates a consistent color transformation for white pixels. It is important to highlight that this framework can accommodate additional grading techniques, including linear and inhomogeneous grading.
In the code provided below, the mask is processed layer by layer. For each layer, the code loads a PNG image, reads the pixels in both the x- and y-directions, examining the RGB value of each pixel. If the color is identified as white, the code substitutes it with the color G. Then, a new PNG image is saved with the adjusted pixel values.
It is important to emphasize that the presented code is a basic illustration of grading. Further functions and grading strategies can be integrated in a similar manner.