
Abstract
In this paper, a piezoelectric energy harvester composed of a buckled beam and an extended beam with a tip mass is proposed. This study develops a mathematical model and a prototype of the energy harvester. The performance of the energy harvester is influenced by the axial load applied at the end of the buckled beam. Under an axial force below the critical load, the energy harvester exhibits a pre-buckling state with a hardening nonlinear characteristic. Conversely, when the axial force exceeds the critical load, a post-buckling state with a softening nonlinear characteristic is observed. Simulation results are validated through experiments, and the relationship between axial displacement and axial force is obtained through experimental data. Moreover, increasing the tip mass enhances the output voltage under the same acceleration. The energy harvester demonstrates superior performance in terms of output power and strain distribution compared to a cantilever counterpart.
Export citation and abstract BibTeX RIS

Original content from this work may be used under the terms of the Creative Commons Attribution 4.0 license. Any further distribution of this work must maintain attribution to the author(s) and the title of the work, journal citation and DOI.
1. Introduction
Vibration is a common way to release energy. Through the design of energy harvesters, dissipated energies can be harnessed for reuse. Among these research on energy harvesters, a piezoelectric energy harvester(PEH) stands out due to its advantages such as easy application and high power density. The conventional structure of PEH is a cantilevered structure proposed by Erturk and Inman [1–3]. Their research involved the derivation and comparison of different mathematical models. However, this structure has some notable drawbacks, such as a small bandwidth, large tip displacement, and uneven strain distribution. To improve the performance of PEHs, many researchers have proposed different ideas based on the cantilever beam structure. Goldschmidtboeing and Woias [4] utilized a cantilever beam with different widths to improve the energy harvesting efficiency. Paquin and St-Amant [5] modified the thickness of the cantilever beam and discovered that its strain distribution is superior to that of a conventional cantilever beam. Čeponis et al [6] changed the cross-sectional structure of the cantilever beam to increase the output power of the energy harvester. Xu et al [7] proposed a hollow cantilever beam that not only enhances efficiency but also reduces the resonant frequency of the cantilever beam. Ali et al [8] applied artificial intelligence algorithms to optimize the performance of an m-shaped PEH. In addition to modifying the cantilever beam, some studies have also employed various methods, such as multi-modal techniques, frequency tuning, and nonlinear methods, to solve the problem of narrow bandwidth in PEH.
The multi-modal technique involves employing different structural configurations to make the first and second resonant frequencies of the system closer, ultimately resulting in an increased bandwidth for energy harvesting. This approach allows the PEH to capture energy over a wider range of frequencies, thereby improving its overall efficiency. Studies conducted by Liu et al [9], Xue et al [10], Qi et al [11], Upadrashta and Yang [12], and Li et al [13] utilized arrays of PEHs with different lengths and tip masses to expand the bandwidth. Arafa et al [14] and Zhou et al [15] added an additional amplification structure at the fixed end of the cantilever beam to increase the bandwidth. Erturk et al proposed an L-shaped beam structure, allowing the control of the spacing between the first and second resonant frequencies by adjusting the length ratio between the main and secondary beams. Su and Zu [16] proposed a V-shape configuration for the PEH, where changing the angle of the structure allowed the second resonant frequency to become closer to the first resonant frequency. Shih and Su [17] introduced a U-shaped beam structure, enabling energy harvesting from vibrations in two orthogonal directions and exhibiting multi-modal characteristics. Additionally, Wu et al [18] utilized a cutout cantilever beam structure with two degrees of freedom, providing a better bandwidth.
Frequency tuning is primarily achieved by changing the position of the tip mass, applying magnetic forces, or introducing axial preload to adjust the system's resonant frequency. Hu et al [19] and Eichhorn et al [20] used bolts to exert axial preload at the end of the beam for frequency tuning. Challa et al [21] positioned a pair of magnets at the end of the cantilever beam for frequency tuning. Mansour et al [22] and Al-Ashtari et al [23] also added a pair of magnets at the end of the cantilever beam to provide axial preload and altered the resonant frequency by adjusting the distance between the magnets. Aboulfotoh et al [24] used coils to detect the ambient frequency and employed a stepper motor to automatically adjust the distance between the magnets for automatic frequency tuning. Karadag and Topaloglu [25] achieved frequency tuning by adjusting the position of the end-mass to achieve the desired resonant frequency. These frequency tuning methods facilitate better matching of the energy harvester to the environment, thereby improving energy harvesting efficiency. However, it is essential to consider the additional space required for implementing these methods.
Nonlinear methods involve applying non-linear forces and stiffness to the system. Nonlinear forces, such as magnetic forces, and the use of stoppers, also result in nonlinear stiffness, which induces nonlinear effects and increases the bandwidth. Sebald et al [26] and Yan et al [27] demonstrated nonlinear effects in the system using magnetic forces. Stanton et al [28] and Zou et al [29] utilized magnetic repulsion at the free end of the cantilevered beam. Experimental results showed that magnetic forces effectively increased the bandwidth. Zhao et al [30] added a movable stopper beam below the cantilevered beam, introducing a nonlinear impact force to broaden the bandwidth of the energy harvester. Zhou et al [31] further studied the material and type of stopper, providing insights on stopper design. Qi et al [32] added stoppers in a two-degree-of-freedom structure, achieving the effect of expanding the bandwidth.
Some studies have explored the use of different types of beams, rather than cantilever beams, for energy harvesting. Chang and Su [33] demonstrated a tensile-mode PEH that not only outperforms bending mode harvesters but also has the capability to adjust resonance frequency through preload. Chen et al [34] proposed an M-shaped beam and tested it with various levels of buckling, demonstrating different nonlinear characteristics. Buckled beams exhibit nonlinear characteristics [35], and their resonant frequency changes with varying levels of buckling [36]. Buckled beams can be achieved through two main methods. One method involves applying weight or external forces to the beam, inducing stretching and buckling. The other method involves inducing buckling by applying end displacement.
The research on buckling is as follows. Sneller et al [37] conducted tests on buckling beams with different center masses and found that higher central masses can enhance the performance of the energy harvester and reduce the snap-through threshold. Zhu and Zu [38] discovered that adding magnetic repulsion at the center of a beam with both ends fixed can induce nonlinearity and trigger the second buckling mode in the system, thereby improving the performance of the energy harvester. Nan et al [39] designed a structure with buckling and an intermediate-mass block, replacing the mass block with a U-shaped torsion device to achieve an extended bandwidth effect. Shim et al [40] achieved nonlinearity and expanded bandwidth by using multiple buckling beams with different central masses. Yu et al [41] added weights at both ends and a central mass to a simply supported beam structure and investigated their effects on the system performance. Instead of central masse, Alimanesh and Zamanian [42] mounted two foam cylinders on the clamped-clamped beam. When the system is exposed to a certain wind speed, the stretching effect results in a buckling effect.
Studies on buckling induced by applying end displacement are as follows. Leland and Wright [43] developed a beam with both pinned ends where the system's resonance frequency could be altered by applying axial displacement. However, the brittleness of the piezoelectric material PZT limited the axial preload to a maximum of 65 N. Masana and Daqaq [44, 45] also proposed a PEH with axial pre-displacement. In their experiments, base excitation was conducted in both the pre-buckling and post-buckling states, revealing both hardening and softening nonlinear phenomena. Xu et al [46] applied various axial pre-displacements to a simply supported beam and investigated the effects on the system. Zhu et al [47] used magnets to apply pre-displacement, and experimental results demonstrated a wider bandwidth and nonlinear behavior. Chen and Yan [48] analyzed the characteristics of a simply supported beam under different axial preload. The simulation results revealed that the system exhibits different nonlinear phenomena based on the magnitude of the axial force.
Applying pre-load at the end of a thin beam induces buckling, leading to system nonlinearity. Moreover, this method facilitates the straightforward adjustment of the system's resonance frequency. Based on Su and Patel's research [49, 50], it is evident that simply supported beams exhibit more uniform strain distribution and a smaller working space compared to cantilever beams, albeit with a higher resonance frequency. Khazaee et al [51] designed a four-point bending PEH under pin-pin boundary conditions. Due to the uniform surface strain, this design led to enhanced energy conversion performance. The resonance frequency of a simply supported beam is higher than that of a cantilever beam. Therefore, in this study, an extended beam and a tip mass will be added to one end of the buckled beam to reduce the system's resonance frequency. This design not only lowers the system's resonance frequency but also harnesses the strain energy generated during buckling, thereby further enhancing the system's efficiency.
This study differs from previous ones in several aspects. Firstly, the prototype of the buckled beam is applied to a simply supported beam with pinned-pinned boundary conditions, whereas most studies use clamped-clamped conditions. Secondly, a mathematical model is built and tested, which can be utilized for future designs. The outline of this paper is as follows: the proposed design and its mathematical model are presented in section 2. Section 3 introduces the experimental setup and the prototype of the proposed energy harvester. The simulation and experimental results are shown in section 4. Finally, the conclusions are drawn in section 5.
2. System configuration and modeling
The proposed extended buckled (EB) PEH is illustrated in figure 1. Figure 1(a) shows the schematics of the proposed energy harvester, which is composed of a main beam and an extended beam with a tip mass. A piezoelectric material PVDF is attached to the main beam to generate energy and the boundary conditions of the main beam are pinned-pinned. When axial displacement is applied at the end of the main beam, the beams will deform as illustrated in figure 1(b). In this state, the system will enter static buckling. Under different magnitudes of axial displacement, the shape of static buckling will also be affected. In the state of static buckling, the beam will be tested under harmonic excitations as figure 1(c).

Figure 1. The proposed EB-PEH: (a) schematics (b) static buckling (c) buckling under base excitation.
Download figure:
Standard image High-resolution imageIn the mathematical model, due to the different stiffness of the buckled beam and the extended beam, the system is divided into two segments for analysis, and two coordinate systems are established in figure 1(a). The governing equations of the main beam and the extended beam can be written as [52]
where ωn
is the lateral displacement of the beam,  represents the bending stiffness of the composite beam, mn
is the mass density of the beam and the subscript n denotes the nth segment of the beam. ca
is the air damping constant, δ is the Dirac Delta function, wb
is the displacement in the base vibration direction. In equation (1), θ is the piezoelectric coupling coefficient, P represents the pre-stress caused by axial displacement, Keq
is the stiffness of the beam in the buckled state. In equation (2), Mt
represents the mass of the tip mass.
represents the bending stiffness of the composite beam, mn
is the mass density of the beam and the subscript n denotes the nth segment of the beam. ca
is the air damping constant, δ is the Dirac Delta function, wb
is the displacement in the base vibration direction. In equation (1), θ is the piezoelectric coupling coefficient, P represents the pre-stress caused by axial displacement, Keq
is the stiffness of the beam in the buckled state. In equation (2), Mt
represents the mass of the tip mass.
When the buckled beam is subjected to different amounts of displacement Δ, the lateral displacement ωn can be represented as follows:


The lateral displacement of the first and second segments of the beam in equations (3) and (4). ωn can be respectively represented by the static function Wsn and the dynamic function Wdn . The following two sections will derive the static and vibration models of the EB beam separately. Then by combining the electrical model, the complete dynamic system equations can be obtained.
2.1. Static buckling model
The static model represents the state of the system after applying axial displacement but before applying base excitations. Therefore, we can remove the time-dependent terms, damping terms, piezoelectric terms, and external force terms from the vibration equation and the lateral displacement equation. Finally, equations (1) and (2) can be rewritten as
The magnitude of the lateral displacement in equation (6) is only influenced by the end mass and the length of the second segment of the beam. Additionally, in equation (5), the nonlinear term can be treated as a constant, which can be denoted as:
Let  , to simplify equation (5)
After calculation the solutions for the modal functions can be obtained
To solve for the coefficients of the modal functions, substitute the modal function equations into the boundary conditions and continuity conditions of the system.
The boundary conditions are:


The continuity conditions are:
The boundary conditions in the free end are:
The coefficients,  in equations (9) and (10) can be determined by the maximum lateral deflection h0 caused by the pre-displacement.
2.2. Dynamic buckling model
This section will derive the dynamic model of an EB beam. First, removing the damping, piezoelectric, and external force terms from equations (1) and (2). Therefore, the free vibration equation is modified as follows:
Then substituting the lateral displacement equations (3) and (4) into equations (19) and (20) respectively. The results are as follows:
By Galerkin method, the lateral displacement in equations (21) and (22) can be represented as:
where  is the mode shape function and
  is the temporal function. Then substitute equations (23) and (24) into equations (21) and (22), then remove the nonlinear term in equation (21), we can get:
The modal functions  and
and  are:
are:
where  is composed of a homogeneous solution and a particular solution that is related to the initial shape. The eigenvalue λrn
is a function of natural frequency ωr
as following equations:
is composed of a homogeneous solution and a particular solution that is related to the initial shape. The eigenvalue λrn
is a function of natural frequency ωr
as following equations:

The coefficients of mode shape function, Arn ,Brn ,Crn and Drn , which can be solved by the boundary and continuous conditions in equations (11)–(18). After substituting the shape function, these equations can be rewritten as the matrix form:
where M is an 8-by-8 matrix. By setting the determinant of M equal to zero, we can obtain the characteristic equation and thereby determine the natural frequency. Furthermore, the undetermined coefficients of the shape function can be determined using the orthogonal condition.
The dynamic function of the proposed energy harvester can be expressed as following:
By the orthogonal method, the dynamic equation in the r mode is:
where ζr is the damping ratio, A and D are the corresponding coefficient, Qr is the electro-mechanical coupling term and f(t) is external force. These terms are defined as follows:
The PVDF film is connected to a load resistor. The equivalent circuit can be illustrated in figure 2. By the piezoelectric constitutive equation, the electrical circuit equation is

Figure 2. Equivalent circuit.
Download figure:
Standard image High-resolution image
where D3 is the electric displacement, e31 is the piezoelectric constants and  is the permittivity at constant stress. By Gauss's law, the electric charge q(t) can be represented as:
where Lp is the length of PVDF. Then the equation for current can be obtained by taking the derivative of the charge with respect to time:
By ohm's law, the circuit equation can be rewritten as:
where Cp is the capacitance of the PVDF film can be expressed:
and κr is the modal coupling term can be expressed:
By Combining equations (35) and (43), the total governing equations of the EB-PEH are listed as follows:
3. Experiment setting
The prototype of the proposed PEH is shown in figure 3. The substrate of the main beam and the extended beam is made of stainless steel. A PVDF film of the same size as the main beam is attached to the substrate using epoxy. A tip mass is composed of a screw and nuts fixed at the free end of the extended beam. The linear adjustable stage is attached to the base, and two pinned holders are fixed to the stage and base, respectively. The pinned holder consists of a steel shaft on each side, which is supported by two bearings. This design improves the robustness of the pinned end, and the use of two bearings further enhances its stability, especially when an axial displacement is applied. The pin connector is designed with a seam that allows for the main beam and extended beam to fit in. At the end pin connector have a closed-ended seam that enables the main beam to buckle, while at the middle pin connector, the screw is used to hold the beam's position when it is under pre-displacement.

Figure 3. The proposed EBEH-PEH.
Download figure:
Standard image High-resolution imageThe experimental setup is shown in figure 4. The energy harvester is mounted on an LDS V406 shaker, which can provide a frequency range of 12–24 Hz for both positive and negative sweep harmonic base excitation tests. The controller can be used to control the vibrator via a PC and drive it through a power amplifier. The output voltage of the EBEH can be measured using an oscilloscope (Keysight DSOX4024A), while the displacement can be detected using a laser displacement sensor (MTI LTS-120-40). The optimal load resistance for the energy harvester can be determined using the resistance box.

Figure 4. Experiment setup.
Download figure:
Standard image High-resolution image4. Results
The primary distinction between the cantilever beam PEH and the EB-PEH lies in the boundary conditions, as illustrated in figure 5. The cantilever beam has a fixed end, while the EB-PEH features a pinned-pinned end configuration. This section aims to compare the two conditions using the same beam. Initially, experimental results from the cantilever beam will validate the dimensions and parameters of the proposed energy harvester. Subsequently, various initial displacements will be applied at the end of the main beam to induce buckling and test performance under harmonic excitation. Furthermore, we will compare the effects of different resistances and amounts of tip mass. Finally, we will discuss the output power under optimal resistance and examine the strain distribution at different axial displacements.

Figure 5. Schematics of the beam with different boundary conditions: (a) cantilever beam (b) extended buckled beam.
Download figure:
Standard image High-resolution image4.1. Parameter validation
The parameters of the main beam, PVDF, epoxy resin, and extended beam are listed in table 1. For simplification, we assumed that the main beam, PVDF and epoxy resin have the same length and width. To validate these parameters, the cantilever beam model is employed, and the fitting parameters are presented in table 2. The validation involves comparing the model predictions with both displacement and voltage experimental results under base excitation.
Table 1. Parameters of the prototype.
| Part | Symbol | Parameters | Value |
|---|---|---|---|
| Main beam | L1 | Length | 78 mm |
| H1 | Thickness | 0.2 mm | |
| W1 | Width | 25 mm | |
| Y1 | Young's Modulus | 193 GPa | |
| D1 | Density | 793 kg m−3 | |
| PVDF | Lp | Length | 78 mm |
| Hp | Thickness | 0.2 mm | |
| Wp | Width | 25 mm | |
| Yp | Young's Modulus | 2.9 GPa | |
| Dp | Density | 1780 kg m−3 | |
| Cp | Capacitance | 1.4 nF | |
| Epoxy | LEX | Length | 78 mm |
| HEX | Thickness | 0.24 mm | |
| WEX | Width | 25 mm | |
| YEX | Young's Modulus | 27 MPa | |
| DEX | Density | 1200 kg m−3 | |
| Extended beam | L2 | Length | 50 mm |
| H2 | Thickness | 0.2 mm | |
| W2 | Width | 25 mm | |
| W2 | Young's Modulus | 200 GPa | |
| W2 | Density | 7930 kg m−3 |
Table 2. Fitting parameters by the cantilever beam experiment.
| Symbol | Description | Value |
|---|---|---|
| HAB | Thickness of the epoxy | 0.24 mm |
| ζr | Damping ratio | 0.0212 |
| d31 | Piezoelectric constant of the PVDF | 130 pm V−1 |
4.2. Effects of axial displacement under base excitations
The mathematical model of the EB-PEH requires determining the stiffness parameter Keq . To obtain the stiffness of the buckled beam, a stiffness test setup is shown in figure 6, with a load cell mounted on a linear adjustable stage. The relationship between pre-displacement and axial force is illustrated in figure 7. Using the dimensions of the buckled beam, the estimated critical load can be calculated using equation (47). As the pre-load reaches the critical load, the system will start to buckle. Therefore, the region before reaching the critical load is referred to as pre-buckling, and after that as post-buckling. The experiment demonstrates that the stiffness in the pre-buckling region is greater than in the post-buckling region. The equivalent stiffness value is obtained through linear regression and applied in the mathematical model. When the pre-displacement exceeds 0.65 mm, the performance of the proposed energy harvester will be hindered by the potential energy barrier. This phenomenon, commonly referred to as bistability, a topic not discussed in this paper.

Figure 6. Experiment setup for stiffness test.
Download figure:
Standard image High-resolution image
Figure 7. Experiment results for stiffness test.
Download figure:
Standard image High-resolution image
To examine the effect of the pre-displacement on the performance of the proposed EB-PEH. Experiment results in different pre-displacement are shown as figure 8. Δ = 0.1 mm and 0.3 mm are in pre-buckling region and Δ = 0.5 mm and 0.7 mm are in post-buckling region. It is obvious in figure 8 that the resonant frequency change and nonlinear effect occur at various levels of pre-displacement. The resonant frequency decreases in the pre-buckling region and increases in the post-buckling region. Additionally, a hardening nonlinear characteristic is exhibited in the post-buckling region, while a softening nonlinear characteristic is observed in the pre-buckling region.

Figure 8. Positive sweep under different pre-displacement.
Download figure:
Standard image High-resolution imageTo fit the experimental results with the mathematical model, the first natural frequency can be calculated using equation (32) from the mathematical model, with parameters based on the pre-displacement and the estimated stiffness obtained from the stiffness test. Due to the disparity between the resonant frequency and the first-order natural frequency, a single impulse test is conducted to determine the resonant frequency. The comparsion is shown in figure 9. When the pre-displacement reaches approximately 0.45 mm, there is a noticeable drop in the first natural frequency. Conversely, there is no obvious drop in resonant frequency. As the pre-displacement increases, particularly in the post-buckling region, the distinction between the natural frequency and the resonant frequency becomes more pronounced. The difference is attributed to the increased complexity resulting from the occurrence of buckling, a phenomenon that Leland and Wright [43] also observed. Thus, calibration will be included in the post-buckling model.

Figure 9. Comparison of the first natural frequency and resonant frequency by single impulse.
Download figure:
Standard image High-resolution imageThe simulation and experiment results of the forward sweep and the backward sweep in the pre-buckling region can be seen in figure 10. The red solid line represents the forward sweep simulation results, while the dashed line represents the experiment results. The blue solid line represents the backward sweep simulation results, and the dashed line represents the experiment results. The simulation results can be adjusted to match the resonant frequency of the experiment by tuning the pre-displacement, and the corresponding axial force and the stiffness value of buckled beam are listed in table 3. Additionally, the piezoelectric constant and damping ratio are determined by fitting the experimental data. Figure 10 shows similar trends between experimental and simulated results in voltage and displacement. The main reason for the mismatch is the Abbe error caused by the linear adjustable stage. Furthermore, this error is also included in the stiffness test which will also influence the deduce of the actual axial force and stiffness.

Figure 10. Simulation and experiment results of the proposed EB-PEH under different axial pre-displacement: (a) and (b) Voltage and displacement applied with  mm, (c) and (d) Voltage and displacement applied with
  mm.
mm.
Download figure:
Standard image High-resolution imageTable 3. Parameters in the mathematical model.
| Name | Δ | Axial force (N) | Stiffness (N m−1) | d31 (pm V−1) | Damping ratio |
|---|---|---|---|---|---|
| Pre1 | 0.04 | 0.328 | 14 970 | 130 |

|
| Pre2 | 0.36 | 8.698 | 16 900 | 130 |

|
| Post1 | 0.51 | 9.771 | 4580 | 78 |

|
| Post2 | 0.58 | 10.06 | 3760 | 78 |

|
Figure 11 displays the results in the post-buckling region. The solid line represents the original simulation results of forward sweep and backward sweep, while the dotted line represents the results after adjusting the resonant frequency. The adjustment method involves substituting the calibrated resonance frequency into the first-order natural frequency ωr in equation (46). After replacing the first-order natural frequency, a good agreement can be observed through the adjustment. The reason for its success is that the impulse test is effective, and the mathematical model alone is insufficient to describe the system in the region near the critical load. In table 3, the piezoelectric constant in the post-buckling region is smaller than that in the pre-buckling region. This indicates that buckling will affect the performance of the PVDF.
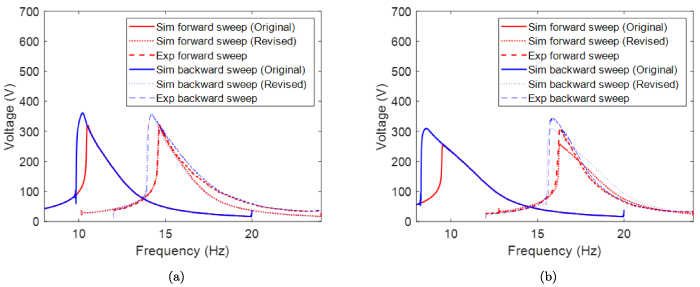
Figure 11. Simulation and experiment results of the proposed EB-PEH under different axial pre-displacement: (a) Voltage applied with  mm (b) Voltage applied with
  mm.
mm.
Download figure:
Standard image High-resolution image4.3. Effects of tip mass
In this section, a comparison is made among four different tip masses at various axial displacements, and the corresponding data is presented in table 4. Figure 12 displays the experiment and simulation results for the forward sweeps. The estimated pre-displacement in the simulation is 0.05 mm in the pre-buckling state and 0.55 mm in the post-buckling state. In both the pre-buckling and post-buckling states, an increase in the tip mass lead to a higher peak output voltage, while simultaneously decreasing the resonant frequency. Additionally, in table 5, an increase in the tip mass results in a reduced damping ratio in both states. This is attributed to the greater variation in potential energy, which helps suppress energy loss due to friction.

Figure 12. Simulation and experiment results of proposed EB-PEH under different tip mass (a) voltage under the pre-buckling state (b) voltage under the post-buckling state.
Download figure:
Standard image High-resolution imageTable 4. Parameters of the tip mass.
| Config. | M0 | M1 | M2 | M3 |
|---|---|---|---|---|
| Mass(g) | 1.27 | 2.75 | 3.25 | 3.73 |
Table 5. Damping ratios of configurations with different tip mass.
| Configuration | damping ratio in 
| damping ratio in 
|
|---|---|---|
| M0 |

|

|
| M1 |

|

|
| M2 |

|

|
| M3 |

|

|
4.4. Effects of optimal resistance
This section aims to demonstrate the influence of different resistances. The experiment results of different resistances in the pre-buckling and the post-buckling states are shown in figure 13. From the figure, the optimal resistance of proposed EB-PEH is 10 MΩ in the pre-buckling state and around 15 MΩ–20 MΩ in the post-buckling state. The effects of resistance in the resistance range between 10 MΩ–20 MΩ are smaller than the range between 1 MΩ–10 MΩ, so here we choose resistance 12.5 MΩ as optimal resistance and use it in the result of the previous section.
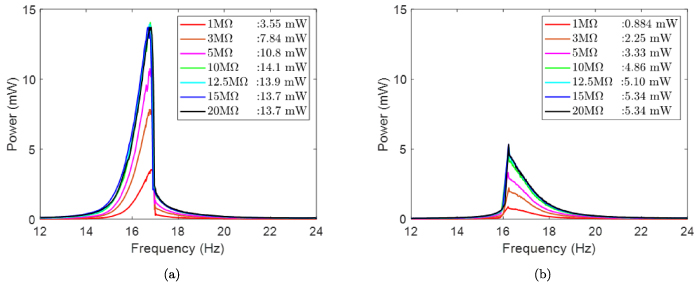
Figure 13. Output power of the proposed EB-PEH with different resistance: (a) pre-buckling (b) post-buckling.
Download figure:
Standard image High-resolution image4.5. Comparison between the EB-PEH and the cantilevered PEH
In this section, a comparison of the proposed energy harvester(EB-PEH) and the traditional cantilevered energy harvester will be discussed. For the optimal output power under acceleration of 0.5 g, the experimental results are shown in figure 14. Because the EB-PEH exhibits varying output power with different axial displacements, the better output power under the pre-buckling state is chosen for the comparison. In the experiment, the resonant frequency of the cantilevered beam is smaller than that of the EB-PEH. To facilitate better comparison, the length of the extended beam is reduced in simulation, bringing the resonant frequency of the cantilevered beam closer to that of EB-PEH. From figure 14, the output power from the proposed energy harvester in the experiment is approximately 14.1 mW, while the output power from the cantilevered beam in the simulation is around 10.9 mW. It's evident that the output power can be increased by 29.4%

Figure 14. Comparison of the output power by the proposed energy harvester(EB-PEH) and the traditional cantilevered energy harvester.
Download figure:
Standard image High-resolution imageIn addition to discussing the optimal output power, the strain distribution will also be addressed here. A more even strain distribution can enhance the efficiency of PVDF in different sections of the beam. Figure 15 shows the strain distribution of the PVDF under the cantilevered or buckled condition calculated by the mathematical model. The red line represents the result under the cantilevered condition, while the others represent the results under different axial displacements. In the cantilevered part, the strain is concentrated at the fixed end (Position = 0 mm). In the buckled condition, the strain concentrates at the nearby middle part of the PVDF, and the position gets closer to the center as the axial displacement increases. Furthermore, figures 15(a) and (b) are the strain distribution of EB-PEH under different amount of tip mass. From the figure 15(b), even strain distribution at the middle can be observed at the buckled condition and a more even strain distribution occurs when the  which is in the pre-buckling state.

Figure 15. Comparison of the strain distribution by different tip mass: (a) Tip mass = 1.27 g (b) Tip mass = 3.73 g.
Download figure:
Standard image High-resolution image
5. Conclusion
In this paper, an EB PEH is proposed. The mathematical model and prototype of the energy harvester were successfully built and tested. The proposed energy harvester exhibited nonlinear characteristics and shifting in the resonant frequency under different axial preloads. Besides, the effect of axial displacement, tip mass, and load of the resistance were also discussed. Adjusting either the pre-displacement or the tip mass can change the resonant frequency and the output power of the system. In the pre-buckling state, under excitations of 0.5 g with an optimal resistance of 10 MΩ, the proposed EB-PEH can generate power of 14.1 mW, resulting in an output power approximately 29.4% higher than that in the cantilevered condition. Additionally, the strain distribution is more even by the changing of the boundary condition and the tip mass.
Acknowledgment
This work was supported by the National Science and Technology Council of Taiwan under Grant MOST 110-2221-E-002-141-MY3.
Data availability statement
All data that support the findings of this study are included within the article (and any supplementary files).